3588 Nash Dr · Napoleon, MI
Flood risk 1/10 · Minimal
- FEMA flood zone
- X (unshaded)
- Chance of flooding over 30 yrs
- 0.0%
- Est. flood insurance / yr
- $473 – $860
Fire risk 3/10 · Minor
- Est. fire insurance / yr
- $784 – $1,456
Heat risk 3/10 · Minor
- Hot days now (above 98°F)
- 7 days/yr
- Hot days in 30 yrs
- 15 days/yr
Wind risk 2/10 · Minimal
- Chance of severe wind over 30 yrs
- —
Air-quality risk 2/10 · Minimal
- Unhealthy air days now
- 1 days/yr
- Unhealthy air days in 30 yrs
- 2 days/yr
Risk factors via First Street. Map © Google.
Why this score? — see what drove the D+ grade
The composite is a weighted blend of 9 inputs, each scored 0–100. Each bar is that input's sub-score; the figure is the points it added to the 100-point composite (weight × sub-score).
- Cash flow +15.0/30.0
- ARV discount +7.5/15.0
- 1% rule +5.0/10.0
- DSCR +5.0/10.0
- Rent growth +5.0/5.0
- Livability +3.0/5.0
- Condition / age +2.5/5.0
- Schools +2.4/10.0
- Appreciation +0.0/10.0
$19,000
🖨 Deal sheet 📄 Offer letter ✓ Due diligence
Listing remarks MLS
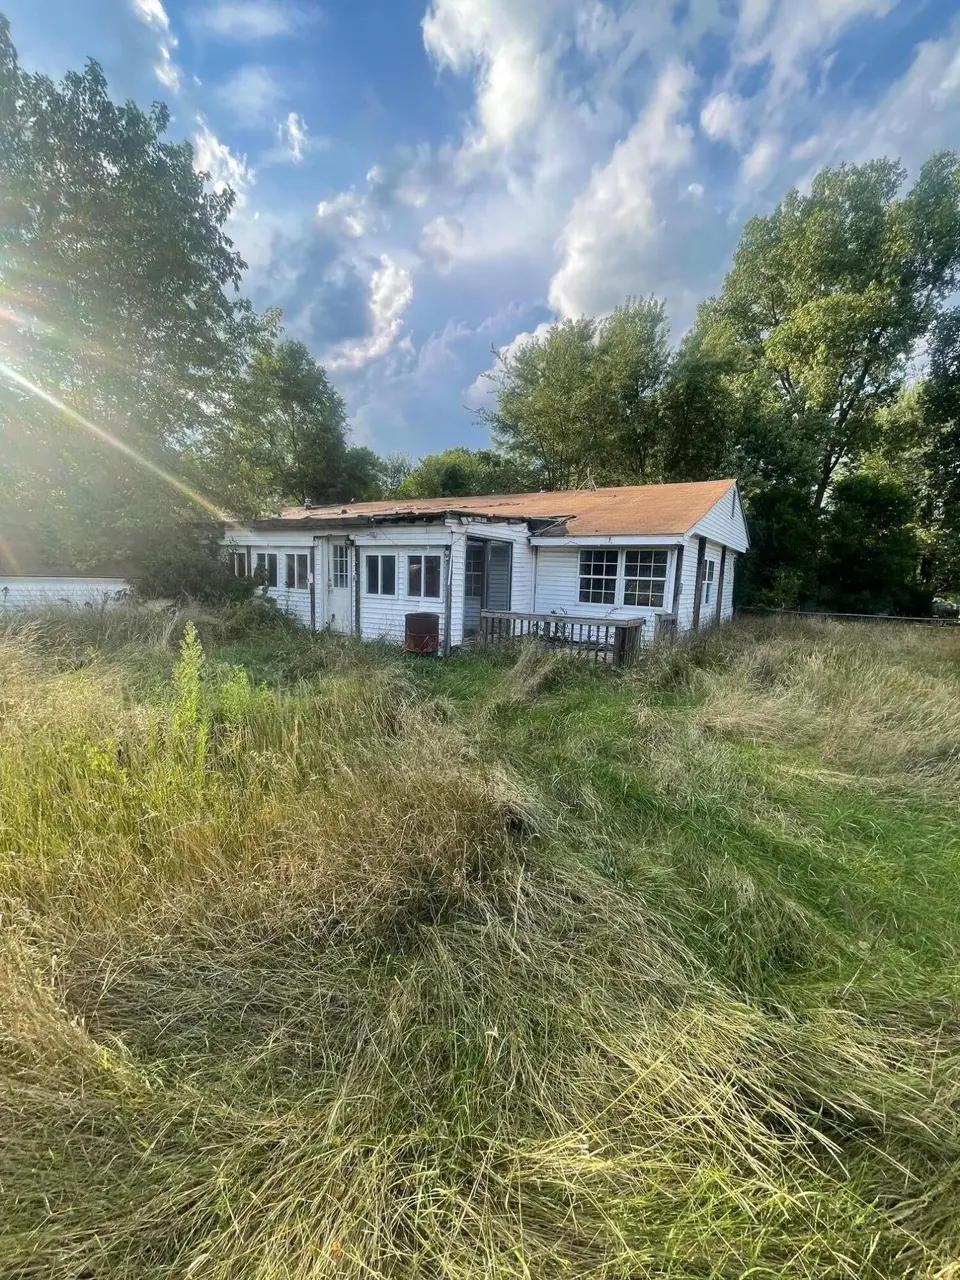
3588 Nash Drive - Investor ROI Potential This 3-bedroom, 1-bath home sits on a spacious corner lot with a fenced yard, offering strong fundamentals for appreciation. While the property is currently uninhabitable, upgraded electrical is already in place -- reducing one major cost item. Significant renovations are required, but this creates a clear value-add opportunity: investors can reposition the home for rental income or resale at a premium. The seller is motivated!
Key facts
- Fenced yard
- Upgraded electrical
- Corner lot
Tags
Neighborhood map
What this means for you Summary
Snapshot
- This is a 3-bed/1.0-bath single-family listed at $19k.
Deal economics
- At list price, monthly cash flow is $1k ($12k/yr) — positive.
- The deal already cash-flows at list — no discount required.
- Meets the 1% rule at list price ($1k rent vs $19k).
- Recommended offer: $17k (9.0% below list) — sets the bar for market timing.
- Cap rate 70.0% vs local median 1.6% in Napoleon — top-decile yield for the area; either an underpriced asset or a hidden risk that comps aren't pricing in. Stress-test before assuming the spread holds.
Location & tenants
- Location reads 59/100 on livability (#600 in MI) — a working-class tenant base; expect higher turnover. Strengths: cost of living A+, housing A+; Watch: crime F, amenities F, commute F.
- Michigan Center School District (suburban): math 19% / reading 37% proficiency, ranked #387 of 540 in MI (top 72%) — low school quality limits family demand, transient renter base, plan for 1-2y turnover.
- Market conditions: Rents rising fast (+10.3%/yr); 362 active listings in the ZIP; 317 units permitted in Jackson County in 2024 (103 in 5+ unit buildings).
Forward outlook
- Local home prices are declining (-3.0%/yr); year-one equity from $131 of loan paydown is wiped out by about $570 of value loss. Plan a longer hold.
- Jackson County population projected at -13% by 2050 — secular population decline; favor cash flow + early exit over multi-decade hold.
- At projected returns (-3.0% appreciation + 8.0% rent growth), your $5k cash investment doubles in ~1 year — after that, you're playing with house money.
Negotiation context
- It's been on market 94 days — a 9% lower offer ($17k) is reasonable based on typical stale-listing flexibility.
- 10 sale attempts since 16y ago with the ask held roughly flat each time — persistent listings suggest the price (not the market) is what's stuck; bring a comps-based counter.
- Current owner paid $10k; list at $19k implies a 90% gain — meaningful room to come down on a strong offer.
Questions for the listing agent
- It's been on market 94 days. Have you received any prior offers? Is the seller open to a 9% concession, seller financing, or rate buy-down credit?
- Built in 1961 — when were the roof, HVAC, electrical panel, plumbing, and water heater last replaced?
- Why hasn't it sold? Are there any deal-killer items the seller is aware of (foundation, flood, title, zoning, code violations)?
- Is there a deadline driving the sale (1031 exchange, divorce, estate, relocation)? That informs how much negotiation room exists.
- Schools are B-rated — typically a magnet for longer-tenancy family renters. What's the average tenant stay here, and is there a school-zone premium baked into asking?
- Crime grade is F in this area — have there been break-ins, vandalism, or insurance claims at this property in the last 3 years? What carrier currently insures it and at what premium?
- The area grade is low — what's the realistic commute time and amenity access for the typical tenant pool here? Any planned neighborhood developments (good or bad) we should know about?
- What's the average days-on-market for RENTAL listings here right now (not sales)? A rising rental-DOM trend means longer vacancies and softer asking-rent achievability than the comps imply.
- What's the recent tenant-quality profile in this submarket — average credit score on applications, eviction rate, late-payment / NSF rate, and stable-employment percentage? A property-management company in the area should have these aggregated.
- How much new for-sale + rental construction is in the pipeline within 1–3 miles? Heavy new supply typically softens prices + rents 12–24 months out; constrained supply supports both.
Investment metrics
- 1% rule
- 7.59% ✓
- Cap rate
- 70.00%
- Cash-on-cash
- 227.51%
- DSCR
- 11.12
- GRM
- 1.1
CMA / ARV
- ARV (median comp)
- $378,259
- List price
- $19,000
- Delta
- -94.98%
- Verdict
- UNDERPRICED
- Comps
- 6 within 1.0 mi
Projected returns pro-forma
-3.0% appreciation · 8.0% rent growth · sell at horizon
- IRR
- —
- Equity multiple
- 13.93×
- Total profit
- $68,810
- Equity at exit
- $2,833
- IRR
- —
- Equity multiple
- 34.35×
- Total profit
- $177,436
- Equity at exit
- $1,643
Cash invested: $5,320 (down + closing). Projections, not guarantees.
Landlord ↔ Tenant lean methodology
- Overall (STATE)
- 62 Landlord-Friendly
- State Michigan
- 62 Landlord-Friendly · EVEN
- County
- — inherits STATE
- City
- — inherits STATE
ZIP-level market 49201
- Rents YoY
- 10.3%
- Active inventory
- 362
- Price-to-rent
- 1.1×
Monthly cashflow live
- Estimated rent
- $1,443 medium interval (Pro) →
- Mortgage (P&I)
- −$100
- Tax est. 1.5%
- −$24 /mo · $285/yr
- Insurance
- −$8
- HOA
- −$0
- Vacancy / Maint / Mgmt
- −$303
- Net cashflow
- $1,009
Break-even live
UW: 25.0% down · 7.5% · 30yr · 1.5% tax · 5.0% vac · 8.0% maint · 8.0% mgmt
Financing live
Cash to close
- Down payment
- $4,750
- Closing costs
- $570
- Reserves months
- —
- Total cash needed
- —
Loan-product check · same deal, 3 products live
Conventional
25% down · 7.5% · 30yr
- Down + closing
- —
- Monthly P&I
- —
- Monthly cashflow
- —
- DSCR
- —
- Eligible?
- —
Personal DTI + credit; lowest rate.
DSCR
20% down · 8.5% · 30yr
- Down + closing
- —
- Monthly P&I
- —
- Monthly cashflow
- —
- DSCR
- —
- Eligible?
- —
No personal income docs; deal must DSCR.
Hard money
10% down · 12.0% · 12mo
- Down + closing
- —
- Monthly P&I
- —
- Monthly cashflow
- —
- DSCR
- —
- Eligible?
- —
Short-term bridge; refi at stabilization.
Listing history 31 events
-
2026-06-09status $19,000 Pending 94 DOM
-
2026-06-08days on market $19,000 Active 94 DOM
-
2026-06-07days on market $19,000 Active 93 DOM
-
2026-06-02days on market $19,000 Active 88 DOM
-
2026-06-01days on market $19,000 Active 87 DOM
-
2026-05-31days on market $19,000 Active 86 DOM
-
2026-05-30days on market $19,000 Active 85 DOM
-
2026-04-21status Active 472-char remark
Show marketing remark (472 chars)
3588 Nash Drive - Investor ROI Potential This 3-bedroom, 1-bath home sits on a spacious corner lot with a fenced yard, offering strong fundamentals for appreciation. While the property is currently uninhabitable, upgraded electrical is already in place -- reducing one major cost item. Significant renovations are required, but this creates a clear value-add opportunity: investors can reposition the home for rental income or resale at a premium. The seller is motivated!
-
2026-04-20historical 472-char remark
Show marketing remark (472 chars)
3588 Nash Drive - Investor ROI Potential This 3-bedroom, 1-bath home sits on a spacious corner lot with a fenced yard, offering strong fundamentals for appreciation. While the property is currently uninhabitable, upgraded electrical is already in place -- reducing one major cost item. Significant renovations are required, but this creates a clear value-add opportunity: investors can reposition the home for rental income or resale at a premium. The seller is motivated!
-
2026-03-06$19,000 Active 472-char remark
Show marketing remark (472 chars)
3588 Nash Drive - Investor ROI Potential This 3-bedroom, 1-bath home sits on a spacious corner lot with a fenced yard, offering strong fundamentals for appreciation. While the property is currently uninhabitable, upgraded electrical is already in place -- reducing one major cost item. Significant renovations are required, but this creates a clear value-add opportunity: investors can reposition the home for rental income or resale at a premium. The seller is motivated!
-
2026-03-06$19,000 Active
Show marketing remark (472 chars)
3588 Nash Drive - Investor ROI Potential This 3-bedroom, 1-bath home sits on a spacious corner lot with a fenced yard, offering strong fundamentals for appreciation. While the property is currently uninhabitable, upgraded electrical is already in place -- reducing one major cost item. Significant renovations are required, but this creates a clear value-add opportunity: investors can reposition the home for rental income or resale at a premium. The seller is motivated!
-
2026-02-12historical
-
2026-01-15status Active
-
2026-01-15status Active
-
2025-12-23status Pending
-
2025-12-23status Pending
-
2025-12-23historical
-
2025-12-12price $19,000
-
2025-12-11price $19,000
-
2025-12-11price $19,000
-
2025-09-16price $23,000
-
2025-09-16price $23,000
-
2025-09-16price $23,000
-
2025-08-11$25,000 Active
-
2025-08-11$25,000 Active
-
2010-06-14soldstatus $10,000
-
2010-06-14soldstatus $10,000
-
2010-05-27historical
-
2010-05-10$10,345
-
2010-05-10$10,345
ⓘ Source: listings_history table (triggers on properties + properties_extension) + one-shot
backfill from property_details.listing_events for pre-trigger history.
Climate risk First Street
- Flood 1/10 Low FEMA zone X (unshaded) · 0% chance over 30 yrs
- Wildfire 3/10 Moderate
- Heat 3/10 Moderate 7 d/yr ≥98°F today · 15 d/yr by 30 yrs out
- Wind 2/10 Low
- Air quality 2/10 Low 1 unhealthy d/yr today · 2 by 30 yrs out
Nearby sold comps map
Loading sold comps map…
Walkable amenities ~0.75 mi
Loading nearby amenities…
Taxation est. · year 1
- Rental income
- $17,316
- − Mortgage interest
- −$1,064
- − Property taxes
- −$285
- − Insurance
- −$95
- − Repairs & maintenance
- −$1,385
- − Management
- −$1,385
- − Depreciation
- −$553
- Taxable income
- $12,548
- Est. tax owed @ 24.0%
- −$3,012
- After-tax cash flow
- $9,092/yr
For passive investors: Depreciation is non-cash, so a rental often shows a tax loss while cash-flowing — sheltering income. Rental losses are passive: they offset passive income freely, and up to $25,000/yr can offset ordinary (W-2) income if you actively participate and your MAGI is under $100k (phasing out to $0 by $150k); unused losses carry forward. On sale, claimed depreciation is recaptured at up to 25%, and gains may owe capital-gains tax (a 1031 exchange can defer both). Figures are a year-1 estimate at your 24.0% rate — not tax advice; consult a CPA.
Schools (NCES district)
- District
- Michigan Center School District
- NCES district ID
- 2623790
- Math proficiency
- 19% ▼ -13.00%
- Reading proficiency
- 37% ▼ -6.00%
- Median HH income
- $46,224
- Composite
- 24.11/100
- National rank
- #7753
- State rank
- #387 of 540 in MI
Livability — Napoleon
- Score
- 59/100
- State rank
- #600
- US rank
- #19694
Category grades
Schools grade is shown separately in the Schools card above.
Census & demographics
- County
- Jackson County · 85,581 people
- City population
- 243
- Metro
- Jackson, MI
- Population (ZIP)
- 49,107
- Household income
- $74,484
- Rent vs Own
- Severe rent burden
- 840.0
Population outlook (Jackson County) Hauer SSP2
- Today (2025)
- 156,365 people
- By 2030
- 153,123 · -2.1%
- By 2040
- 144,981 · -7.3%
- By 2050
- 135,671 · -13.2%
- By 2075
- 113,833 · -27.2%
- By 2100
- 86,592 · -44.6%
Race, ethnicity, and origin ACS 2023
- Neighborhood character
- Predominantly White (80%)
- Race & ethnicity
- White 80% Black 9% Two or more races 6% Hispanic / Latino 5%
- Hispanic origin (detail)
- Mexican 4%
- Common ancestry
- Romanian 7% Lithuanian 3% Slovak 2%
- Foreign-born
- 3% · Canada
- Languages at home
- 96% English-only · Spanish 2% Other Indo-European 1% Russian/Polish/Slavic 1%
Political lean MEDSL · Jackson
- 2024 margin
- Strong R (+21.3) · D 38.6% · R 59.9% · Other 1.5%
- 2008→2024 swing
- -23.7pp toward R · 2008: 2.4pp · 2024: -21.3pp
- All cycles
- 2024: R+21.3 2020: R+19.0 2016: R+20.1 2012: R+5.8 2008: D+2.4
Not yet ingested
- Civics
- —
Market trends
- HPI YoY
- ▼ -198.89%
- Current HPI
- 185.3773
- Rent YoY
- ▲ 10.32%
- Metro
- Jackson, MI
- State GDP YoY
- ▲ 1.37%
- F500 in state
- 28
Industry mix (Fortune 500 HQ in MI)
| Industry | F500 HQs | Revenue |
|---|---|---|
| Automotive Parts | 3 | $48B |
|
||
| Automotive | 2 | $372B |
|
||
| Chemicals | 1 | $45B |
|
||
| Automotive Retail | 1 | $29B |
|
||
| Healthcare / Medical Devices | 1 | $23B |
|
||
| Automotive Technology | 1 | $20B |
|
||
Price history
+83.7% since first listed24 events — show timeline
- 2026-04-21 Relisted — REALCOMP
- 2026-04-20 Listing Removed — REALCOMP
- 2026-03-06 Listed $19,000 MiRealSource-MiMLS
- 2026-03-06 Listed $19,000 SW Michigan MLS
- 2026-03-06 Listed $19,000 REALCOMP
- 2026-02-12 Listing Removed — MiRealSource-MiMLS
- 2026-01-15 Relisted — REALCOMP
- 2026-01-15 Relisted — MiRealSource-MiMLS
- 2025-12-23 Pending — MiRealSource-MiMLS
- 2025-12-23 Pending — REALCOMP
- 2025-12-23 Listing Removed — REALCOMP
- 2025-12-12 Price Changed $19,000 MiRealSource-MiMLS
- 2025-12-11 Price Changed $19,000 REALCOMP
- 2025-12-11 Price Changed $19,000 SW Michigan MLS
- 2025-09-16 Price Changed $23,000 MiRealSource-MiMLS
- 2025-09-16 Price Changed $23,000 REALCOMP
- 2025-09-16 Price Changed $23,000 SW Michigan MLS
- 2025-08-11 Listed $25,000 REALCOMP
- 2025-08-11 Listed $25,000 MiRealSource-MiMLS
- 2010-06-14 Sold (MLS) $10,000 MiRealSource-MiMLS
- 2010-06-14 Sold (MLS) $10,000 REALCOMP
- 2010-05-27 Listing Removed — MiRealSource-MiMLS
- 2010-05-10 Listed $10,345 MiRealSource-MiMLS
- 2010-05-10 Listed $10,345 REALCOMP
Property tax history
+9.1%/yrLatest (2025): $1,198 · +3.7% YoY. Source: county tax records.
Cash-flow waterfall
monthlySold comps — $/sqft
last 12 mo · ≤1 miLoading sold comps…