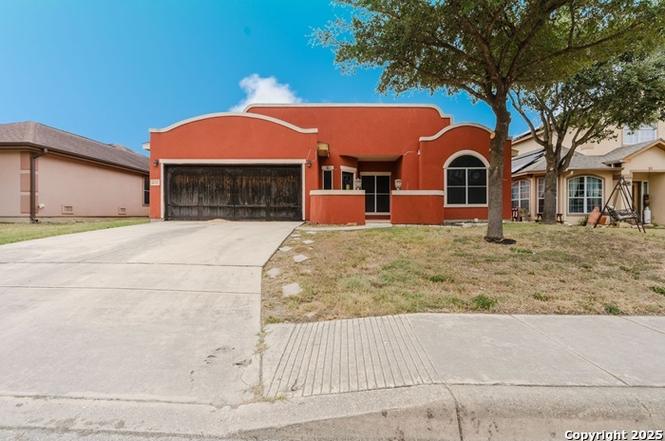
12307 Course View Dr · San Antonio, TX
Flood risk 1/10 · Minimal
- FEMA flood zone
- X (unshaded)
- Chance of flooding over 30 yrs
- 0.0%
- Est. flood insurance / yr
- $507 – $1,088
Fire risk 5/10 · Moderate
- Est. fire insurance / yr
- $1,222 – $2,270
Heat risk 8/10 · Major
- Hot days now (above 109°F)
- 7 days/yr
- Hot days in 30 yrs
- 24 days/yr
Wind risk 8/10 · Major
- Chance of severe wind over 30 yrs
- 80.0%
Air-quality risk 2/10 · Minimal
- Unhealthy air days now
- 0 days/yr
- Unhealthy air days in 30 yrs
- 1 days/yr
Risk factors via First Street. Map © Google.
Why this score? — see what drove the D+ grade
The composite is a weighted blend of 9 inputs, each scored 0–100. Each bar is that input's sub-score; the figure is the points it added to the 100-point composite (weight × sub-score).
- Cash flow +13.2/30.0
- ARV discount +7.5/15.0
- 1% rule +7.4/10.0
- Appreciation +6.0/10.0
- DSCR +4.0/10.0
- Livability +4.0/5.0
- Condition / age +2.5/5.0
- Schools +1.8/10.0
- Rent growth +0.7/5.0
$175,000
🖨 Deal sheet 📄 Offer letter ✓ Due diligence
Listing remarks
Drive out to Mission Del Lago to see this custom stucco home on the golf course. Stained concrete and lots of tile offer a unique beauty. Plenty of space, large kitchen with abundance of cabinets and nice covered patio with course view! Home may need new flooring and some repairs. RESERVE AUCTION PROPERTY- Property sold "AS-IS" without contingencies, repairs, warranties, guarantees or representation as to listing accuracy, property information, photo or other depiction included or described herein. Inspect before bidding. List price is $206,800.
Key facts
- Stained concrete
- Custom stucco home
- Golf course view
Tags
Neighborhood map
What this means for you Summary
Snapshot
- This is a 4-bed/2.5-bath land listed at $175k.
Deal economics
- At list price, monthly cash flow is $-4 ($-50/yr) — negative.
- To cash-flow at today's rent, offer at most $174k (0.4% below list).
- Meets the 1% rule at list price ($2k rent vs $175k).
- Recommended offer: $154k (12.0% below list) — sets the bar for market timing.
- Cap rate 6.3% vs local median 3.8% in San Antonio — top-decile yield for the area; either an underpriced asset or a hidden risk that comps aren't pricing in. Stress-test before assuming the spread holds.
Location & tenants
- Location reads 80/100 on livability (#31 in TX, #1,616 nationally) — a professional / high-income tenant draw. Strengths: amenities A+, commute A+, cost of living A+; Watch: crime F.
- Southside ISD (rural): math 16% / reading 25% proficiency, ranked #771 of 826 in TX (top 93%) — low school quality limits family demand, transient renter base, plan for 1-2y turnover; 76% free/reduced lunch — lower-income household profile, screen leases tightly.
- Zoned schools: Julian C Gallardo El (math 13% / reading 22%, grade F, #3,805 of 4,322 statewide, top 89%, 544 students, 87% FRL); Southside H S (math 18% / reading 25%, grade F, #1,377 of 1,632 statewide, top 85%, 1,685 students, 85% FRL).
- Market conditions: Rents falling (-7.2%/yr); 369 active listings in the ZIP; 11 comparable units currently listed for rent nearby; rentals at typical pace (median 24d on market — plan ~3-4 weeks tenant-placement turnaround); 8,308 units permitted in Bexar County in 2024 (2,506 in 5+ unit buildings).
- This rent runs 41% of the median local income ($64k/yr) — at the standard rent-burdened threshold; future hikes will face affordability resistance.
Forward outlook
- In year one you build about $5k of equity ($1k loan paydown + $4k appreciation (2.0% local appreciation)).
- Bexar County population projected at +50% by 2050 — long-run rental-demand tailwind backs the buy-and-hold thesis.
- By year 7, paydown + projected appreciation supports a ~$31k cash-out refi (75% LTV) — recoverable capital for the next deal without selling this one.
Negotiation context
- It's been on market 261 days — a 12% lower offer ($154k) is reasonable based on typical stale-listing flexibility.
- 9 sale attempts since 8y ago; this cycle's ask has dropped $154k (47%) from the opening price — seller is motivated, your offer sets the floor, not the list.
Risks & watch-outs
- Watch-outs: property tax is 4.8% of price.
- Climate carrying-cost: severe wind risk, 80% chance of damaging wind over 30y; moderate wildfire risk; extreme-heat days projected 7→24/yr by 2055 (HVAC capex compounding) — expect insurance premiums to compound above CPI over the hold.
Questions for the listing agent
- What do current leases actually rent for vs. the listed asking? Can we see a recent rent roll and the last 12 months of T-12 income?
- It's been on market 261 days. Have you received any prior offers? Is the seller open to a 12% concession, seller financing, or rate buy-down credit?
- Property tax is high relative to price — has the assessment been appealed recently, and will the sale trigger a re-assessment?
- What does the HOA fee cover, when was the last increase, and are there any pending special assessments or reserve-fund shortfalls?
- Why hasn't it sold? Are there any deal-killer items the seller is aware of (foundation, flood, title, zoning, code violations)?
- Is there a deadline driving the sale (1031 exchange, divorce, estate, relocation)? That informs how much negotiation room exists.
- Crime grade is F in this area — have there been break-ins, vandalism, or insurance claims at this property in the last 3 years? What carrier currently insures it and at what premium?
- The area grade is low — what's the realistic commute time and amenity access for the typical tenant pool here? Any planned neighborhood developments (good or bad) we should know about?
- What's the average days-on-market for RENTAL listings here right now (not sales)? A rising rental-DOM trend means longer vacancies and softer asking-rent achievability than the comps imply.
- What's the recent tenant-quality profile in this submarket — average credit score on applications, eviction rate, late-payment / NSF rate, and stable-employment percentage? A property-management company in the area should have these aggregated.
- How much new for-sale + rental construction is in the pipeline within 1–3 miles? Heavy new supply typically softens prices + rents 12–24 months out; constrained supply supports both.
Investment metrics
- 1% rule
- 1.24% ✓
- Cap rate
- 6.26%
- Cash-on-cash
- -0.10%
- DSCR
- 1.00
- GRM
- 6.7
CMA / ARV
No comps found within radius.
Projected returns pro-forma
2.03% appreciation · 0.0% rent growth · sell at horizon
- IRR
- 2.3%
- Equity multiple
- 1.12×
- Total profit
- $5,979
- Equity at exit
- $69,294
- IRR
- 4.2%
- Equity multiple
- 1.53×
- Total profit
- $26,123
- Equity at exit
- $99,992
Cash invested: $49,000 (down + closing). Projections, not guarantees.
Landlord ↔ Tenant lean methodology
- Overall (STATE)
- 87 Strongly Landlord-Friendly
- State Texas
- 87 Strongly Landlord-Friendly · R+5
- County
- — inherits STATE
- City
- — inherits STATE
ZIP-level market 78221
- Home prices YoY
- 0.8%
- Rents YoY
- -7.2%
- Active inventory
- 369
- Price-to-rent
- 6.7×
Monthly cashflow live
- Estimated rent
- $2,168 high interval (Pro) →
- Mortgage (P&I)
- −$918
- Tax from tax record
- −$697 /mo · $8,363/yr
- Insurance
- −$73
- HOA
- −$29
- Vacancy / Maint / Mgmt
- −$455
- Net cashflow
- $-4
Break-even live
UW: 25.0% down · 7.5% · 30yr · 1.5% tax · 5.0% vac · 8.0% maint · 8.0% mgmt
Financing live
Cash to close
- Down payment
- $43,750
- Closing costs
- $5,250
- Reserves months
- —
- Total cash needed
- —
Loan-product check · same deal, 3 products live
Conventional
25% down · 7.5% · 30yr
- Down + closing
- —
- Monthly P&I
- —
- Monthly cashflow
- —
- DSCR
- —
- Eligible?
- —
Personal DTI + credit; lowest rate.
DSCR
20% down · 8.5% · 30yr
- Down + closing
- —
- Monthly P&I
- —
- Monthly cashflow
- —
- DSCR
- —
- Eligible?
- —
No personal income docs; deal must DSCR.
Hard money
10% down · 12.0% · 12mo
- Down + closing
- —
- Monthly P&I
- —
- Monthly cashflow
- —
- DSCR
- —
- Eligible?
- —
Short-term bridge; refi at stabilization.
Rent comps 11 comps
| Address | Beds | Baths | Sqft | Rent | $/sqft | DOM | Units | Dist |
|---|---|---|---|---|---|---|---|---|
| 11723 Faldo Way San Antonio, TX | 4.0 | 3.5 | 2680 | $3,500 | $1.31 | 3d | 1 | 0.24mi |
| 11426 Four Iron Way San Antonio, TX | 4.0 | 2.5 | 1814 | $1,695 | $0.93 | 4d | 1 | 0.43mi |
| 12015 Still Pass San Antonio, TX | 4.0 | 2.0 | 1635 | $1,600 | $0.98 | 20d | 1 | 0.50mi |
| 934 Cook Bnd San Antonio, TX | 4.0 | 2.0 | 1627 | $1,445 | $0.89 | 24d | 1 | 0.51mi |
| 922 Manero Pass San Antonio, TX | 4.0 | 2.5 | 1950 | $1,850 | $0.95 | 24d | 1 | 0.58mi |
| 742 Haas Way San Antonio, TX | 4.0 | 2.0 | 1699 | $2,100 | $1.24 | 18d | 1 | 0.59mi |
| 710 Titleist Cv San Antonio, TX | 4.0 | 2.5 | 1950 | $1,680 | $0.86 | 44d | 1 | 0.67mi |
| 13206 Dutra Rd San Antonio, TX | 4.0 | 2.5 | 1956 | $1,700 | $0.87 | 44d | 1 | 0.91mi |
| 2203 Cielo Rio, Lot 102 San Antonio, TX | 2.0–4.0 | 2.0–2.5 | 1574 | $2,845 | $1.81 | 2d | 152 | 0.95mi |
| 13806 S Strange Way San Antonio, TX | 4.0 | 2.0 | 1668 | $1,795 | $1.08 | 24d | 1 | 1.24mi |
| 9879 Chavaneaux Lndg San Antonio, TX | 4.0 | 2.0 | 1585 | $1,700 | $1.07 | 24d | 1 | 1.26mi |
HOA detail
- Monthly dues
- $29 · $348/yr
Listing history 41 events
-
2026-04-24status Pending
-
2026-04-02price $175,000
-
2026-04-01status Back on Market
-
2026-03-16status Pending
-
2026-02-18price $199,000
-
2026-01-29price $205,700
-
2026-01-13price $206,800
-
2025-12-27price $207,900
-
2025-12-11price $209,000
-
2025-11-25price $211,500
-
2025-11-07price $212,600
-
2025-10-11price $213,700
-
2025-09-22price $241,900
-
2025-09-06price $259,200
-
2025-08-21price $286,200
-
2025-08-07price $301,900
-
2025-07-21$328,600 New
-
2025-07-07historical
-
2025-06-18$397,500 New
-
2023-08-15historical
-
2023-06-15historical
-
2023-06-14status Pending
-
2023-06-14status Pending
-
2023-06-14status Pending
-
2023-06-14historical
-
2023-06-14historical
-
2023-01-24price $330,000
-
2023-01-24price $330,000
-
2023-01-24price
-
2022-12-15price $340,000
-
2022-12-15price $340,000
-
2022-12-15price
-
2022-11-14price $330,000
-
2022-11-14price $340,000
-
2022-11-11$330,000
-
2022-11-11$350,000 New
-
2022-11-11$350,000 Active
-
2022-11-11Active
-
2022-11-11$350,000 Active
-
2019-02-14historical
-
2018-12-12$199,000 New
ⓘ Source: listings_history table (triggers on properties + properties_extension) + one-shot
backfill from property_details.listing_events for pre-trigger history.
Tax reassessment forecast TX · Resets to sale price
- Current annual tax
- $8,363 · $697/mo
- Projected year-2 tax
- $8,363 · $697/mo
- Expected delta
- $0/yr ($0/mo · 0.0%)
ⓘ Screening estimate from a state-policy table — verify with the county assessor before closing.
Climate risk First Street
- Flood 1/10 Low FEMA zone X (unshaded) · 0% chance over 30 yrs
- Wildfire 5/10 Major
- Heat 8/10 Severe 7 d/yr ≥109°F today · 24 d/yr by 30 yrs out
- Wind 8/10 Severe 80% chance of damaging wind over 30 yrs
- Air quality 2/10 Low 0 unhealthy d/yr today · 1 by 30 yrs out
Nearby sold comps map
Loading sold comps map…
Walkable amenities ~0.75 mi
Loading nearby amenities…
Taxation est. · year 1
- Rental income
- $26,011
- − Mortgage interest
- −$9,803
- − Property taxes
- −$8,363
- − Insurance
- −$875
- − Repairs & maintenance
- −$2,081
- − Management
- −$2,081
- − HOA
- −$348
- − Depreciation
- −$5,091
- Taxable loss
- −$2,630
- Est. tax savings @ 24.0%
- +$631
- After-tax cash flow
- $581/yr
For passive investors: Depreciation is non-cash, so a rental often shows a tax loss while cash-flowing — sheltering income. Rental losses are passive: they offset passive income freely, and up to $25,000/yr can offset ordinary (W-2) income if you actively participate and your MAGI is under $100k (phasing out to $0 by $150k); unused losses carry forward. On sale, claimed depreciation is recaptured at up to 25%, and gains may owe capital-gains tax (a 1031 exchange can defer both). Figures are a year-1 estimate at your 24.0% rate — not tax advice; consult a CPA.
Schools (NCES district)
- District
- Southside ISD
- NCES district ID
- 4840920
- Math proficiency
- 16% ▼ -15.00%
- Reading proficiency
- 25% ▼ -2.00%
- Median HH income
- $43,526
- Composite
- 17.68/100
- National rank
- #9027
- State rank
- #771 of 826 in TX
Livability — San Antonio
- Score
- 80/100
- State rank
- #31
- US rank
- #1616
Category grades
Schools grade is shown separately in the Schools card above.
Census & demographics
- Census place
- San Antonio, TX
- County
- Bexar County · 1,990,555 people
- City population
- 1,806,925
- Metro
- San Antonio-New Braunfels, TX
- Population (ZIP)
- 42,178
- Household income
- $63,811
- Rent vs Own
- Severe rent burden
- 1180.0
Population outlook (Bexar County) Hauer SSP2
- Today (2025)
- 2,336,851 people
- By 2030
- 2,560,728 · +9.6%
- By 2040
- 3,020,569 · +29.3%
- By 2050
- 3,493,522 · +49.5%
- By 2075
- 4,668,459 · +99.8%
- By 2100
- 5,533,242 · +136.8%
Race, ethnicity, and origin ACS 2023
- Neighborhood character
- Predominantly Hispanic (89%)
- Race & ethnicity
- Hispanic / Latino 89% Two or more races 28% White 9% Native American 2%
- Hispanic origin (detail)
- Mexican 74%
- Common ancestry
- Lithuanian 1% Romanian 1%
- Foreign-born
- 16% · Canada
- Languages at home
- 45% English-only · Spanish 54%
Political lean MEDSL · Bexar
- 2024 margin
- Lean D (+9.8) · D 54.3% · R 44.6% · Other 1.1%
- 2008→2024 swing
- +4.2pp toward D · 2008: 5.6pp · 2024: 9.8pp
- All cycles
- 2024: D+9.8 2020: D+18.2 2016: D+13.5 2012: D+4.6 2008: D+5.6
Not yet ingested
- Civics
- —
Market trends
- HPI YoY
- ▲ 2.03%
- Current HPI
- 251.1635
- Rent YoY
- ▼ -7.21%
- Metro
- San Antonio-New Braunfels, TX
- State GDP YoY
- ▲ 3.95%
- F500 in state
- 110
Industry mix (Fortune 500 HQ in TX)
| Industry | F500 HQs | Revenue |
|---|---|---|
| Energy | 16 | $1,198B |
|
||
| Technology | 5 | $198B |
|
||
| Engineering / Construction | 4 | $72B |
|
||
| Energy Services | 3 | $60B |
|
||
| Utilities | 3 | $41B |
|
||
| Healthcare | 2 | $330B |
|
||
Price history
-12.1% since first listed41 events — show timeline
- 2026-04-24 Pending — LERA
- 2026-04-02 Price Changed $175,000 LERA
- 2026-04-01 Relisted — LERA
- 2026-03-16 Pending — LERA
- 2026-02-18 Price Changed $199,000 LERA
- 2026-01-29 Price Changed $205,700 LERA
- 2026-01-13 Price Changed $206,800 LERA
- 2025-12-27 Price Changed $207,900 LERA
- 2025-12-11 Price Changed $209,000 LERA
- 2025-11-25 Price Changed $211,500 LERA
- 2025-11-07 Price Changed $212,600 LERA
- 2025-10-11 Price Changed $213,700 LERA
- 2025-09-22 Price Changed $241,900 LERA
- 2025-09-06 Price Changed $259,200 LERA
- 2025-08-21 Price Changed $286,200 LERA
- 2025-08-07 Price Changed $301,900 LERA
- 2025-07-21 Listed $328,600 LERA
- 2025-07-07 Listing Removed — LERA
- 2025-06-18 Listed $397,500 LERA
- 2023-08-15 Listing Removed — LERA
- 2023-06-15 Listing Removed — HARMLS
- 2023-06-14 Pending — LERA
- 2023-06-14 Pending — Unlock MLS
- 2023-06-14 Pending — CTXMLS
- 2023-06-14 Listing Removed — LERA
- 2023-06-14 Listing Removed — CTXMLS
- 2023-01-24 Price Changed $330,000 HARMLS
- 2023-01-24 Price Changed $330,000 CTXMLS
- 2023-01-24 Price Changed — Unlock MLS
- 2022-12-15 Price Changed $340,000 HARMLS
- 2022-12-15 Price Changed $340,000 CTXMLS
- 2022-12-15 Price Changed — Unlock MLS
- 2022-11-14 Price Changed $340,000 LERA
- 2022-11-14 Price Changed $330,000 LERA
- 2022-11-11 Listed $350,000 LERA
- 2022-11-11 Listed $330,000 LERA
- 2022-11-11 Listed $350,000 CTXMLS
- 2022-11-11 Listed — Unlock MLS
- 2022-11-11 Listed $350,000 HARMLS
- 2019-02-14 Listing Removed — LERA
- 2018-12-12 Listed $199,000 LERA
Property tax history
+3.8%/yrLatest (2025): $8,363 · +5.6% YoY. Source: county tax records.
Cash-flow waterfall
monthlySold comps — $/sqft
last 12 mo · ≤1 miLoading sold comps…