742 Miner Rd · Orinda, CA
Flood risk 1/10 · Minimal
- FEMA flood zone
- X (unshaded)
- Chance of flooding over 30 yrs
- 0.0%
- Est. flood insurance / yr
- $507 – $1,088
Fire risk 5/10 · Moderate
- Est. fire insurance / yr
- $659 – $1,223
Heat risk 2/10 · Minimal
- Hot days now (above 92°F)
- 7 days/yr
- Hot days in 30 yrs
- 15 days/yr
Wind risk 1/10 · Minimal
- Chance of severe wind over 30 yrs
- —
Air-quality risk 8/10 · Major
- Unhealthy air days now
- 14 days/yr
- Unhealthy air days in 30 yrs
- 15 days/yr
Risk factors via First Street. Map © Google.
Why this score? — see what drove the F grade
The composite is a weighted blend of 9 inputs, each scored 0–100. Each bar is that input's sub-score; the figure is the points it added to the 100-point composite (weight × sub-score).
- ARV discount +15.0/15.0
- Schools +7.3/10.0
- Livability +3.8/5.0
- Rent growth +2.5/5.0
- Condition / age +2.5/5.0
- Cash flow +2.0/30.0
- 1% rule +0.0/10.0
- DSCR +0.0/10.0
- Appreciation +0.0/10.0
$1,395,000
🖨 Deal sheet 📄 Offer letter ✓ Due diligence
Listing remarks
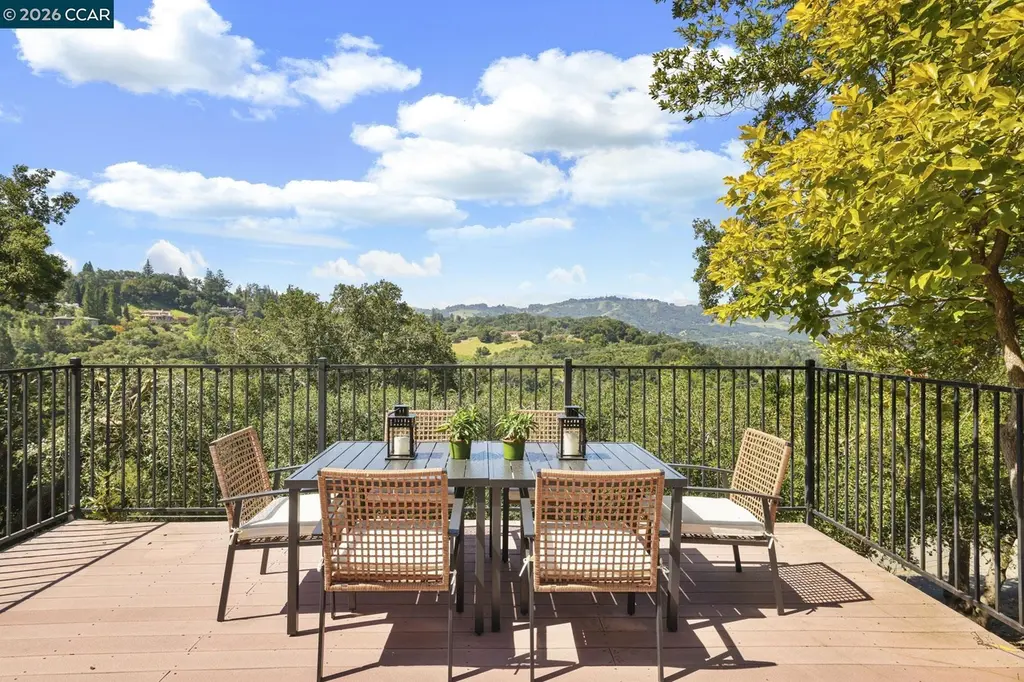
Privately situated place up where the views are gorgeous, this single-level 4-bedroom, 3-full-bathroom home measuring 2,420 sq ft is special. With 1.28 acres of land, there is room to expand or add an ADU. The home has been lovingly cared for by an Orinda family for 50 + years. Architecturally unique, it lends itself to a mid-century modern feel. Walls of large windows offer striking views of the verdant Berkeley hills from the living room, dining room, kitchen, and bedrooms, and flood the home with natural light. Multiple large glass sliding doors allow for easy indoor - outdoor living. Dine, entertain friends or relax on the expansive deck. There’s also an oversized garag
Key facts
- Natural light
- 1.28 acres of land
- Oversized garage
Tags
Property features AI
Finance
- HOA & community: Pets allowed with number limit
Exterior
- Parking: Attached enclosed garage with 3 spaces; Private parking; Additional uncovered parking (2+ spaces); Garage door opener; Parking lot
- Utilities: Public sewer; Cable available; Natural gas available and connected
- Home design: Single family residence; Residential property; Faces southwest; Built in 1958; Raised foundation
- Construction: Wood siding construction
- Exterior features: Deck; Side yard; Terraced down; Terraced up; Back yard; Sloped up and sloped down areas; Irregular, secluded lot
Interior
- Kitchen: Dishwasher; Disposal; Microwave; Built-in range/oven; Refrigerator
- Bedrooms: 3 bedrooms; Primary bedroom suite on main level
- Flooring: Hardwood; Linoleum; Tile
- Bathrooms: 3 full bathrooms
- Heating & cooling: Natural gas heating; Wall/window air conditioning units
- Interior features: Dining area; Storage; No steps to entry; Crawl space
- Laundry & utility: Washer and dryer; Laundry closet; Gas water heater
Neighborhood map
What this means for you Summary
Snapshot
- This is a 3-bed/2.0-bath single-family listed at $1.40M.
Deal economics
- At list price, monthly cash flow is $-5k ($-62k/yr) — negative.
- To cash-flow at today's rent, offer at most $481k (65.5% below list).
- To meet the 1% rule (rent ≥ 1% of price), the offer needs to be $481k (65.5% below list).
- Recommended offer: $481k (65.5% below list) — sets the bar for cash-flow.
Location & tenants
- Location reads 76/100 on livability (#107 in CA, #3,728 nationally) — a middle-class / working-renter tenant base. Strengths: schools A+, crime A+, commute A+; Watch: amenities F, cost of living F.
- Acalanes Union High (suburban): math 73% / reading 85% proficiency, ranked #21 of 517 in CA (top 4%) — strong family-tenant draw, lease renewals of 3-5y typical.
- Market conditions: 93 active listings in the ZIP; 2,169 units permitted in Contra Costa County in 2024 (896 in 5+ unit buildings).
Forward outlook
- Local home prices are declining (-3.0%/yr); year-one equity from $10k of loan paydown is wiped out by about $42k of value loss. Plan a longer hold.
- Contra Costa County population projected at +26% by 2050 — long-run rental-demand tailwind backs the buy-and-hold thesis.
Negotiation context
- Only 9 days on market — expect competitive offers; lowballing is unlikely to land.
Risks & watch-outs
- Watch-outs: built in 1958 — expect roof / HVAC / electrical / plumbing capex.
- Climate carrying-cost: moderate wildfire risk — expect insurance premiums to compound above CPI over the hold.
Questions for the listing agent
- What do current leases actually rent for vs. the listed asking? Can we see a recent rent roll and the last 12 months of T-12 income?
- Built in 1958 — when were the roof, HVAC, electrical panel, plumbing, and water heater last replaced?
- What does the HOA fee cover, when was the last increase, and are there any pending special assessments or reserve-fund shortfalls?
- Is there a deadline driving the sale (1031 exchange, divorce, estate, relocation)? That informs how much negotiation room exists.
- Schools are A-rated — typically a magnet for longer-tenancy family renters. What's the average tenant stay here, and is there a school-zone premium baked into asking?
- The area grade is low — what's the realistic commute time and amenity access for the typical tenant pool here? Any planned neighborhood developments (good or bad) we should know about?
- What's the average days-on-market for RENTAL listings here right now (not sales)? A rising rental-DOM trend means longer vacancies and softer asking-rent achievability than the comps imply.
- What's the recent tenant-quality profile in this submarket — average credit score on applications, eviction rate, late-payment / NSF rate, and stable-employment percentage? A property-management company in the area should have these aggregated.
- How much new for-sale + rental construction is in the pipeline within 1–3 miles? Heavy new supply typically softens prices + rents 12–24 months out; constrained supply supports both.
Investment metrics
- 1% rule
- 0.35% ✗
- Cap rate
- 1.84%
- Cash-on-cash
- -15.89%
- DSCR
- 0.29
- GRM
- 24.1
CMA / ARV
- ARV (on-the-fly)
- $1,716,624
- Comps found
- 12
Show comp detail 12 sales within ~0.75 mi
| Address | Dist | Beds/Ba | Sqft | Sold | Price | $/sf | Match |
|---|---|---|---|---|---|---|---|
| 32 Las Vegas Rd | 0.48mi | 4/2.0 (+1) | 2,058 (-2%) | 0mo | $2,050,000 | $996 | 69 |
| 22 Las Palomas | 0.54mi | 3/3.0 | 2,087 (-0%) | 4mo | $1,550,000 | $743 | 67 |
| 47 Charles Hill Cir | 0.55mi | 3/2.0 | 2,043 (-2%) | 5mo | $2,300,000 | $1,126 | 66 |
| 700 Miner | 0.27mi | 3/2.0 | 2,365 (+13%) | 4mo | $1,649,000 | $697 | 63 |
| 19 Via Floreado | 0.66mi | 3/2.0 | 1,990 (-5%) | 5mo | $925,000 | $465 | 56 |
| 20 Coachwood Ter | 0.44mi | 4/2.5 (+1) | 2,348 (+12%) | 1mo | $2,325,000 | $990 | 51 |
| 184 Lombardy Ln | 0.38mi | 4/2.0 (+1) | 1,892 (-10%) | 12mo | $1,810,000 | $957 | 51 |
| 61 Van Ripper Ln | 0.57mi | 3/2.5 | 1,879 (-10%) | 10mo | $1,475,000 | $785 | 46 |
| 7 Los Dedos Rd | 0.71mi | 3/3.0 | 1,985 (-5%) | 13mo | $1,625,000 | $819 | 43 |
| 39 Las Vegas Rd | 0.44mi | 3/2.0 | 1,781 (-15%) | 14mo | $1,700,000 | $955 | 43 |
| 40 Las Palomas | 0.50mi | 4/3.5 (+1) | 2,354 (+12%) | 4mo | $1,435,000 | $610 | 42 |
| 34 Las Palomas | 0.51mi | 4/3.0 (+1) | 1,850 (-12%) | 10mo | $1,421,185 | $768 | 40 |
Match score weights: distance 35% · size 25% · config 20% · recency 20%. Top-matched comps best support the ARV.
Projected returns pro-forma
-3.0% appreciation · 3.0% rent growth · sell at horizon
- IRR
- -47.3%
- Equity multiple
- -0.42×
- Total profit
- $-555,882
- Equity at exit
- $207,999
- IRR
- -90.4%
- Equity multiple
- -1.33×
- Total profit
- $-909,693
- Equity at exit
- $120,614
Cash invested: $390,600 (down + closing). Projections, not guarantees.
Landlord ↔ Tenant lean methodology
- Overall (STATE)
- 18 Strongly Tenant-Friendly
- State California
- 18 Strongly Tenant-Friendly · D+13
- County
- — inherits STATE
- City
- — inherits STATE
ZIP-level market 94563
- Active inventory
- 93
- Price-to-rent
- 24.1×
Monthly cashflow live
- Estimated rent
- $4,814 medium interval (Pro) →
- Mortgage (P&I)
- −$7,316
- Tax from tax record
- −$1,078 /mo · $12,935/yr
- Insurance
- −$581
- HOA
- −$2
- Vacancy / Maint / Mgmt
- −$1,011
- Net cashflow
- $-5,173
Break-even live
UW: 25.0% down · 7.5% · 30yr · 1.5% tax · 5.0% vac · 8.0% maint · 8.0% mgmt
Financing live
Cash to close
- Down payment
- $348,750
- Closing costs
- $41,850
- Reserves months
- —
- Total cash needed
- —
Loan-product check · same deal, 3 products live
Conventional
25% down · 7.5% · 30yr
- Down + closing
- —
- Monthly P&I
- —
- Monthly cashflow
- —
- DSCR
- —
- Eligible?
- —
Personal DTI + credit; lowest rate.
DSCR
20% down · 8.5% · 30yr
- Down + closing
- —
- Monthly P&I
- —
- Monthly cashflow
- —
- DSCR
- —
- Eligible?
- —
No personal income docs; deal must DSCR.
Hard money
10% down · 12.0% · 12mo
- Down + closing
- —
- Monthly P&I
- —
- Monthly cashflow
- —
- DSCR
- —
- Eligible?
- —
Short-term bridge; refi at stabilization.
HOA detail
- Monthly dues
- $2 · $24/yr
Listing history 2 events
-
2026-05-22status Pending
-
2026-05-12$1,395,000 Active
ⓘ Source: listings_history table (triggers on properties + properties_extension) + one-shot
backfill from property_details.listing_events for pre-trigger history.
Tax reassessment forecast CA · Resets to sale price
- Current annual tax
- $12,935 · $1,078/mo
- Projected year-2 tax
- $12,935 · $1,078/mo
- Expected delta
- $0/yr ($0/mo · 0.0%)
ⓘ Screening estimate from a state-policy table — verify with the county assessor before closing.
Climate risk First Street
- Flood 1/10 Low FEMA zone X (unshaded) · 0% chance over 30 yrs
- Wildfire 5/10 Major
- Heat 2/10 Low 7 d/yr ≥92°F today · 15 d/yr by 30 yrs out
- Wind 1/10 Low
- Air quality 8/10 Severe 14 unhealthy d/yr today · 15 by 30 yrs out
Nearby sold comps map
Loading sold comps map…
Walkable amenities ~0.75 mi
Loading nearby amenities…
Taxation est. · year 1
- Rental income
- $57,772
- − Mortgage interest
- −$78,142
- − Property taxes
- −$12,935
- − Insurance
- −$6,975
- − Repairs & maintenance
- −$4,622
- − Management
- −$4,622
- − HOA
- −$24
- − Depreciation
- −$40,582
- Taxable loss
- −$90,129
- Est. tax savings @ 24.0%
- +$21,631
- After-tax cash flow
- $-40,450/yr
For passive investors: Depreciation is non-cash, so a rental often shows a tax loss while cash-flowing — sheltering income. Rental losses are passive: they offset passive income freely, and up to $25,000/yr can offset ordinary (W-2) income if you actively participate and your MAGI is under $100k (phasing out to $0 by $150k); unused losses carry forward. On sale, claimed depreciation is recaptured at up to 25%, and gains may owe capital-gains tax (a 1031 exchange can defer both). Figures are a year-1 estimate at your 24.0% rate — not tax advice; consult a CPA.
Schools (NCES district)
- District
- Acalanes Union High
- NCES district ID
- 0601650
- Math proficiency
- 73% ▲ 1.00%
- Reading proficiency
- 85% ▼ -4.00%
- Median HH income
- $120,138
- Composite
- 73.49/100
- National rank
- #179
- State rank
- #21 of 517 in CA
Livability — Orinda
- Score
- 76/100
- State rank
- #107
- US rank
- #3728
Category grades
Schools grade is shown separately in the Schools card above.
Census & demographics
- Census place
- Orinda, CA
- Population (ZIP)
- 19,409
Population outlook (Contra Costa County) Hauer SSP2
- Today (2025)
- 1,287,720 people
- By 2030
- 1,364,937 · +6.0%
- By 2040
- 1,506,209 · +17.0%
- By 2050
- 1,624,373 · +26.1%
- By 2075
- 1,853,193 · +43.9%
- By 2100
- 1,901,231 · +47.6%
Race, ethnicity, and origin ACS 2023
- Neighborhood character
- Predominantly White (68%)
- Race & ethnicity
- White 68% Asian 16% Two or more races 15% Hispanic / Latino 6%
- Hispanic origin (detail)
- Mexican 3%
- Common ancestry
- Romanian 5% Lithuanian 4% Italian 4%
- Foreign-born
- 20% · China, Canada, Vietnam
- Languages at home
- 80% English-only · Chinese 6% Other Indo-European 4% Spanish 3%
Political lean MEDSL · Contra Costa
- 2024 margin
- Solid D (+38.0) · D 67.3% · R 29.4% · Other 3.3%
- 2008→2024 swing
- +0.2pp no change · 2008: 37.8pp · 2024: 38.0pp
- All cycles
- 2024: D+38.0 2020: D+45.3 2016: D+43.5 2012: D+33.7 2008: D+37.8
Not yet ingested
- Civics
- —
Market trends
- HPI YoY
- ▼ -977.89%
- Current HPI
- 142.3285
- Rent YoY
- —
- Metro
- —
- State GDP YoY
- ▲ 3.21%
- F500 in state
- 116
Industry mix (Fortune 500 HQ in CA)
| Industry | F500 HQs | Revenue |
|---|---|---|
| Technology | 27 | $1,492B |
|
||
| Financial Services | 3 | $174B |
|
||
| Retail | 3 | $44B |
|
||
| Insurance | 3 | $26B |
|
||
| Media / Entertainment | 2 | $115B |
|
||
| Pharmaceuticals / Biotech | 2 | $62B |
|
||
Price history
2 events — show timeline
- 2026-05-22 Pending — bridgeMLS, Bay East AOR, or Contra Costa AOR
- 2026-05-12 Listed $1,395,000 bridgeMLS, Bay East AOR, or Contra Costa AOR
Property tax history
+11.4%/yrLatest (2025): $12,935 · +1.6% YoY. Source: county tax records.
Cash-flow waterfall
monthlySold comps — $/sqft
last 12 mo · ≤1 miLoading sold comps…