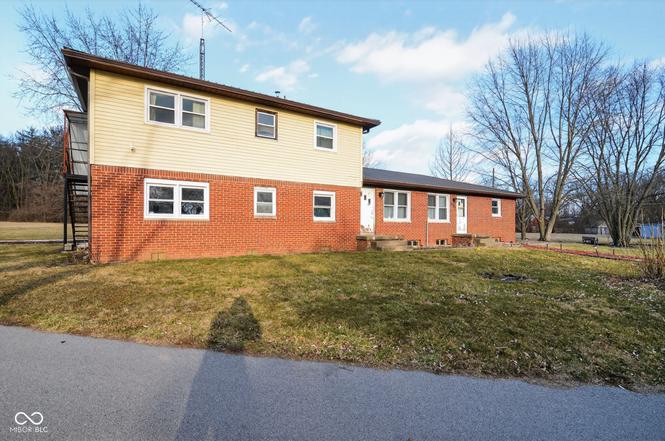
8568 S Academy Way · Ladoga, IN
Flood risk 1/10 · Minimal
- FEMA flood zone
- X (unshaded)
- Chance of flooding over 30 yrs
- 0.0%
- Est. flood insurance / yr
- $473 – $860
Fire risk 1/10 · Minimal
- Est. fire insurance / yr
- $717 – $1,331
Heat risk 3/10 · Minor
- Hot days now (above 101°F)
- 7 days/yr
- Hot days in 30 yrs
- 18 days/yr
Wind risk 2/10 · Minimal
- Chance of severe wind over 30 yrs
- 1.0%
Air-quality risk 2/10 · Minimal
- Unhealthy air days now
- 1 days/yr
- Unhealthy air days in 30 yrs
- 2 days/yr
Risk factors via First Street. Map © Google.
Why this score? — see what drove the B- grade
The composite is a weighted blend of 9 inputs, each scored 0–100. Each bar is that input's sub-score; the figure is the points it added to the 100-point composite (weight × sub-score).
- Cash flow +20.3/30.0
- ARV discount +15.0/15.0
- Appreciation +10.0/10.0
- DSCR +6.5/10.0
- 1% rule +4.9/10.0
- Schools +4.4/10.0
- Livability +3.4/5.0
- Rent growth +2.5/5.0
- Condition / age +2.5/5.0
$139,500
🖨 Deal sheet 📄 Offer letter ✓ Due diligence
Listing remarks MLS
IMAGINE a 3950 sq ft. tri-level BRICK home! Endless possibilities! 26x18 Living Room, Large Kitchen, 6 Bedrooms, 3 Full Baths, Office, 17x13 Sitting Room! Newer: Generac generator (New in 2015), Whole House Fan, Recently Installed Steel Roof, Some windows, Electrical Upgraded! Spacious Walk-Out Basement, Comfy Hot Water Boiler Heat/NEW motor, (4) Portable A/C Units Stay! Large KT, Dishwasher, Electric Range, Refrigerator, Microwave. Washer & Dryer Stay in Laundry Room. This BIG Home Needs some TLC, however, owners continue working to update, paint and renew this home! Come see the progress! Situated on a 1/2 ACRE LOT, WITH PARTIAL CHAIN LINK FENCED AREA! Additional 3.06 ACRES Available - to be Sold Separately!
Key facts
- Ample counter space
- Tranquil ladoga
- Storage
Tags
Neighborhood map
What this means for you Summary
Snapshot
- This is a 4-bed/3.0-bath single-family listed at $140k.
Deal economics
- At list price, monthly cash flow is $180 ($2k/yr) — positive.
- The deal already cash-flows at list — no discount required.
- To meet the 1% rule (rent ≥ 1% of price), the offer needs to be $139k (0.6% below list).
- Recommended offer: $137k (1.5% below list) — sets the bar for market timing.
Location & tenants
- Location reads 67/100 on livability (#244 in IN) — a middle-class / working-renter tenant base. Strengths: crime A+, cost of living A+, housing A+; Watch: employment C-, amenities F, commute F.
- South Montgomery Community School Corporation (rural): math 52% / reading 49% proficiency, ranked #46 of 301 in IN (top 15%) — acceptable for families but not a draw, mixed tenant base, ~2y average lease.
- Market conditions: 14 active listings in the ZIP; 52 units permitted in Montgomery County in 2024 (0 in 5+ unit buildings).
Forward outlook
- In year one you build about $15k of equity ($964 loan paydown + $14k appreciation (10.0% local appreciation)).
- Montgomery County population projected to shrink 9% by 2050 — rents likely to lag national; underwrite the cash flow, not the appreciation.
- At projected returns (10.0% appreciation + 3.0% rent growth), your $39k cash investment doubles in ~3 years — after that, you're playing with house money.
- By year 3, paydown + projected appreciation supports a ~$38k cash-out refi (75% LTV) — recoverable capital for the next deal without selling this one.
Negotiation context
- It's been on market 26 days — a 2% lower offer ($137k) is reasonable based on typical stale-listing flexibility.
- 7 sale attempts since 22y ago; this cycle's ask has dropped $8k (5%) from the opening price — seller is motivated, your offer sets the floor, not the list.
Questions for the listing agent
- Built in 1968 — when were the roof, HVAC, electrical panel, plumbing, and water heater last replaced?
- Is there a deadline driving the sale (1031 exchange, divorce, estate, relocation)? That informs how much negotiation room exists.
- Schools are B-rated — typically a magnet for longer-tenancy family renters. What's the average tenant stay here, and is there a school-zone premium baked into asking?
- What's the average days-on-market for RENTAL listings here right now (not sales)? A rising rental-DOM trend means longer vacancies and softer asking-rent achievability than the comps imply.
- What's the recent tenant-quality profile in this submarket — average credit score on applications, eviction rate, late-payment / NSF rate, and stable-employment percentage? A property-management company in the area should have these aggregated.
- How much new for-sale + rental construction is in the pipeline within 1–3 miles? Heavy new supply typically softens prices + rents 12–24 months out; constrained supply supports both.
Investment metrics
- 1% rule
- 0.99% ✗
- Cap rate
- 7.84%
- Cash-on-cash
- 5.53%
- DSCR
- 1.25
- GRM
- 8.4
CMA / ARV
- ARV (on-the-fly)
- $233,728
- Comps found
- 4
Show comp detail 4 sales within ~0.75 mi
| Address | Dist | Beds/Ba | Sqft | Sold | Price | $/sf | Match |
|---|---|---|---|---|---|---|---|
| 210 N Walnut St | 0.20mi | 4/1.5 | 2,820 (+0%) | 22mo | $225,000 | $80 | 66 |
| 321 N Washington St | 0.31mi | 3/1.5 (-1) | 2,634 (-6%) | 0mo | $220,000 | $84 | 64 |
| 5052 E State Road 234 | 0.14mi | 4/2.0 | 2,424 (-14%) | 16mo | $200,000 | $83 | 52 |
| 402 E Main St | 0.55mi | 3/2.0 (-1) | 2,648 (-6%) | 23mo | $150,000 | $57 | 36 |
Match score weights: distance 35% · size 25% · config 20% · recency 20%. Top-matched comps best support the ARV.
Projected returns pro-forma
10.0% appreciation · 3.0% rent growth · sell at horizon
- IRR
- 28.3%
- Equity multiple
- 3.24×
- Total profit
- $87,429
- Equity at exit
- $125,673
- IRR
- 24.6%
- Equity multiple
- 7.36×
- Total profit
- $248,432
- Equity at exit
- $271,018
Cash invested: $39,060 (down + closing). Projections, not guarantees.
Landlord ↔ Tenant lean methodology
- Overall (STATE)
- 90 Strongly Landlord-Friendly
- State Indiana
- 90 Strongly Landlord-Friendly · R+11
- County
- — inherits STATE
- City
- — inherits STATE
ZIP-level market 47954
- Home prices YoY
- 5.0%
- Active inventory
- 14
- Price-to-rent
- 8.4×
Monthly cashflow live
- Estimated rent
- $1,387 medium interval (Pro) →
- Mortgage (P&I)
- −$732
- Tax from tax record
- −$126 /mo · $1,509/yr
- Insurance
- −$58
- HOA
- −$0
- Vacancy / Maint / Mgmt
- −$291
- Net cashflow
- $180
Break-even live
UW: 25.0% down · 7.5% · 30yr · 1.5% tax · 5.0% vac · 8.0% maint · 8.0% mgmt
Financing live
Cash to close
- Down payment
- $34,875
- Closing costs
- $4,185
- Reserves months
- —
- Total cash needed
- —
Loan-product check · same deal, 3 products live
Conventional
25% down · 7.5% · 30yr
- Down + closing
- —
- Monthly P&I
- —
- Monthly cashflow
- —
- DSCR
- —
- Eligible?
- —
Personal DTI + credit; lowest rate.
DSCR
20% down · 8.5% · 30yr
- Down + closing
- —
- Monthly P&I
- —
- Monthly cashflow
- —
- DSCR
- —
- Eligible?
- —
No personal income docs; deal must DSCR.
Hard money
10% down · 12.0% · 12mo
- Down + closing
- —
- Monthly P&I
- —
- Monthly cashflow
- —
- DSCR
- —
- Eligible?
- —
Short-term bridge; refi at stabilization.
Listing history 15 events
-
2026-03-25status Pending
-
2026-03-09price $139,500
-
2026-02-27$147,500 Active
-
2018-11-15soldstatus $125,000 Sold 733-char remark
Show marketing remark (733 chars)
IMAGINE a 3950 sq ft. tri-level BRICK home! Endless possibilities! 26x18 Living Room, Large Kitchen, 6 Bedrooms, 3 Full Baths, Office, 17x13 Sitting Room! Newer: Generac generator (New in 2015), Whole House Fan, Recently Installed Steel Roof, Some windows, Electrical Upgraded! Spacious Walk-Out Basement, Comfy Hot Water Boiler Heat/NEW motor, (4) Portable A/C Units Stay! Large KT, Dishwasher, Electric Range, Refrigerator, Microwave. Washer & Dryer Stay in Laundry Room. This BIG Home Needs some TLC, however, owners continue working to update, paint and renew this home! Come see the progress! Situated on a 1/2 ACRE LOT, WITH PARTIAL CHAIN LINK FENCED AREA! Additional 3.06 ACRES Available - to be Sold Separately!
-
2018-10-14status Pending 733-char remark
Show marketing remark (733 chars)
IMAGINE a 3950 sq ft. tri-level BRICK home! Endless possibilities! 26x18 Living Room, Large Kitchen, 6 Bedrooms, 3 Full Baths, Office, 17x13 Sitting Room! Newer: Generac generator (New in 2015), Whole House Fan, Recently Installed Steel Roof, Some windows, Electrical Upgraded! Spacious Walk-Out Basement, Comfy Hot Water Boiler Heat/NEW motor, (4) Portable A/C Units Stay! Large KT, Dishwasher, Electric Range, Refrigerator, Microwave. Washer & Dryer Stay in Laundry Room. This BIG Home Needs some TLC, however, owners continue working to update, paint and renew this home! Come see the progress! Situated on a 1/2 ACRE LOT, WITH PARTIAL CHAIN LINK FENCED AREA! Additional 3.06 ACRES Available - to be Sold Separately!
-
2017-12-03$129,900 Active 733-char remark
Show marketing remark (733 chars)
IMAGINE a 3950 sq ft. tri-level BRICK home! Endless possibilities! 26x18 Living Room, Large Kitchen, 6 Bedrooms, 3 Full Baths, Office, 17x13 Sitting Room! Newer: Generac generator (New in 2015), Whole House Fan, Recently Installed Steel Roof, Some windows, Electrical Upgraded! Spacious Walk-Out Basement, Comfy Hot Water Boiler Heat/NEW motor, (4) Portable A/C Units Stay! Large KT, Dishwasher, Electric Range, Refrigerator, Microwave. Washer & Dryer Stay in Laundry Room. This BIG Home Needs some TLC, however, owners continue working to update, paint and renew this home! Come see the progress! Situated on a 1/2 ACRE LOT, WITH PARTIAL CHAIN LINK FENCED AREA! Additional 3.06 ACRES Available - to be Sold Separately!
-
2017-11-27historical
-
2017-10-03$129,900 Active
-
2017-10-02$129,900
-
2007-02-19historical
-
2006-08-22$114,490
-
2006-03-15historical
-
2005-09-19$114,500
-
2005-04-15historical
-
2004-10-18$109,900
ⓘ Source: listings_history table (triggers on properties + properties_extension) + one-shot
backfill from property_details.listing_events for pre-trigger history.
Tax reassessment forecast IN · Partial reset (capped growth)
- Current annual tax
- $1,509 · $126/mo
- Projected year-2 tax
- $1,509 · $126/mo
- Expected delta
- $0/yr ($0/mo · 0.0%)
ⓘ Screening estimate from a state-policy table — verify with the county assessor before closing.
Climate risk First Street
- Flood 1/10 Low FEMA zone X (unshaded) · 0% chance over 30 yrs
- Wildfire 1/10 Low
- Heat 3/10 Moderate 7 d/yr ≥101°F today · 18 d/yr by 30 yrs out
- Wind 2/10 Low 100% chance of damaging wind over 30 yrs
- Air quality 2/10 Low 1 unhealthy d/yr today · 2 by 30 yrs out
Nearby sold comps map
Loading sold comps map…
Walkable amenities ~0.75 mi
Loading nearby amenities…
Taxation est. · year 1
- Rental income
- $16,638
- − Mortgage interest
- −$7,814
- − Property taxes
- −$1,509
- − Insurance
- −$698
- − Repairs & maintenance
- −$1,331
- − Management
- −$1,331
- − Depreciation
- −$4,058
- Taxable loss
- −$102
- Est. tax savings @ 24.0%
- +$25
- After-tax cash flow
- $2,184/yr
For passive investors: Depreciation is non-cash, so a rental often shows a tax loss while cash-flowing — sheltering income. Rental losses are passive: they offset passive income freely, and up to $25,000/yr can offset ordinary (W-2) income if you actively participate and your MAGI is under $100k (phasing out to $0 by $150k); unused losses carry forward. On sale, claimed depreciation is recaptured at up to 25%, and gains may owe capital-gains tax (a 1031 exchange can defer both). Figures are a year-1 estimate at your 24.0% rate — not tax advice; consult a CPA.
Schools (NCES district)
- District
- South Montgomery Community School Corporation
- NCES district ID
- 1810450
- Math proficiency
- 52% ▼ -3.00%
- Reading proficiency
- 49% ▼ -4.00%
- Median HH income
- $55,952
- Composite
- 43.79/100
- National rank
- #2935
- State rank
- #46 of 301 in IN
Livability — Ladoga
- Score
- 67/100
- State rank
- #244
- US rank
- #10363
Category grades
Schools grade is shown separately in the Schools card above.
Census & demographics
- Census place
- Ladoga, IN
- Population (ZIP)
- 2,223
Population outlook (Montgomery County) Hauer SSP2
- Today (2025)
- 37,893 people
- By 2030
- 37,539 · -0.9%
- By 2040
- 36,536 · -3.6%
- By 2050
- 34,454 · -9.1%
- By 2075
- 28,852 · -23.9%
- By 2100
- 21,145 · -44.2%
Race, ethnicity, and origin ACS 2023
- Neighborhood character
- Predominantly White (95%)
- Race & ethnicity
- White 95% Two or more races 2% Asian 2% Hispanic / Latino 1%
- Common ancestry
- Scottish 5% Romanian 2% Slovak 2%
- Foreign-born
- 1%
- Languages at home
- 99% English-only · Other Asian/Pacific 1%
Political lean MEDSL · Montgomery
- 2024 margin
- Solid R (+48.2) · D 24.9% · R 73.2% · Other 1.9%
- 2008→2024 swing
- -28.3pp toward R · 2008: -19.9pp · 2024: -48.2pp
- All cycles
- 2024: R+48.2 2020: R+49.1 2016: R+50.9 2012: R+38.5 2008: R+19.9
Not yet ingested
- Civics
- —
Market trends
- HPI YoY
- ▲ 11.04%
- Current HPI
- 232.3894
- Rent YoY
- —
- Metro
- —
- State GDP YoY
- ▲ 2.90%
- F500 in state
- 18
Industry mix (Fortune 500 HQ in IN)
| Industry | F500 HQs | Revenue |
|---|---|---|
| Industrial Machinery | 2 | $37B |
|
||
| Healthcare | 1 | $177B |
|
||
| Pharmaceuticals | 1 | $45B |
|
||
| Metals / Steel | 1 | $18B |
|
||
| Agriculture | 1 | $17B |
|
||
| Packaging | 1 | $12B |
|
||
Price history
+26.9% since first listed15 events — show timeline
- 2026-03-25 Pending — MIBOR as Distributed by MLS Grid
- 2026-03-09 Price Changed $139,500 MIBOR as Distributed by MLS Grid
- 2026-02-27 Listed $147,500 MIBOR as Distributed by MLS Grid
- 2018-11-15 Sold (MLS) $125,000 MIBOR as Distributed by MLS Grid
- 2018-10-14 Pending — MIBOR as Distributed by MLS Grid
- 2017-12-03 Listed $129,900 MIBOR as Distributed by MLS Grid
- 2017-11-27 Listing Removed — MIBOR as Distributed by MLS Grid
- 2017-10-03 Listed $129,900 MIBOR as Distributed by MLS Grid
- 2017-10-02 Listed $129,900 IRMLS
- 2007-02-19 Listing Removed — MIBOR as Distributed by MLS Grid
- 2006-08-22 Listed $114,490 MIBOR as Distributed by MLS Grid
- 2006-03-15 Listing Removed — MIBOR as Distributed by MLS Grid
- 2005-09-19 Listed $114,500 MIBOR as Distributed by MLS Grid
- 2005-04-15 Listing Removed — MIBOR as Distributed by MLS Grid
- 2004-10-18 Listed $109,900 MIBOR as Distributed by MLS Grid
Property tax history
+13.9%/yrLatest (2025): $1,509 · +3.0% YoY. Source: county tax records.
Cash-flow waterfall
monthlySold comps — $/sqft
last 12 mo · ≤1 miLoading sold comps…