Tbb Baywood Ests · Center Moriches, NY
Flood risk No data
- FEMA flood zone
- —
- Chance of flooding over 30 yrs
- —
- Est. flood insurance / yr
- —
Fire risk No data
- Est. fire insurance / yr
- —
Heat risk No data
- Hot days now (above threshold)
- —
- Hot days in 30 yrs
- —
Wind risk No data
- Chance of severe wind over 30 yrs
- —
Air-quality risk No data
- Unhealthy air days now
- —
- Unhealthy air days in 30 yrs
- —
Risk factors via First Street. Map © Google.
Why this score? — see what drove the C+ grade
The composite is a weighted blend of 9 inputs, each scored 0–100. Each bar is that input's sub-score; the figure is the points it added to the 100-point composite (weight × sub-score).
- Cash flow +30.0/30.0
- 1% rule +10.0/10.0
- DSCR +10.0/10.0
- Schools +5.5/10.0
- Livability +3.3/5.0
- Rent growth +2.5/5.0
- Condition / age +2.5/5.0
- ARV discount +0.0/15.0
- Appreciation +0.0/10.0
$995,000
🖨 Deal sheet (PDF) 📄 Offer letter ✓ Due diligence
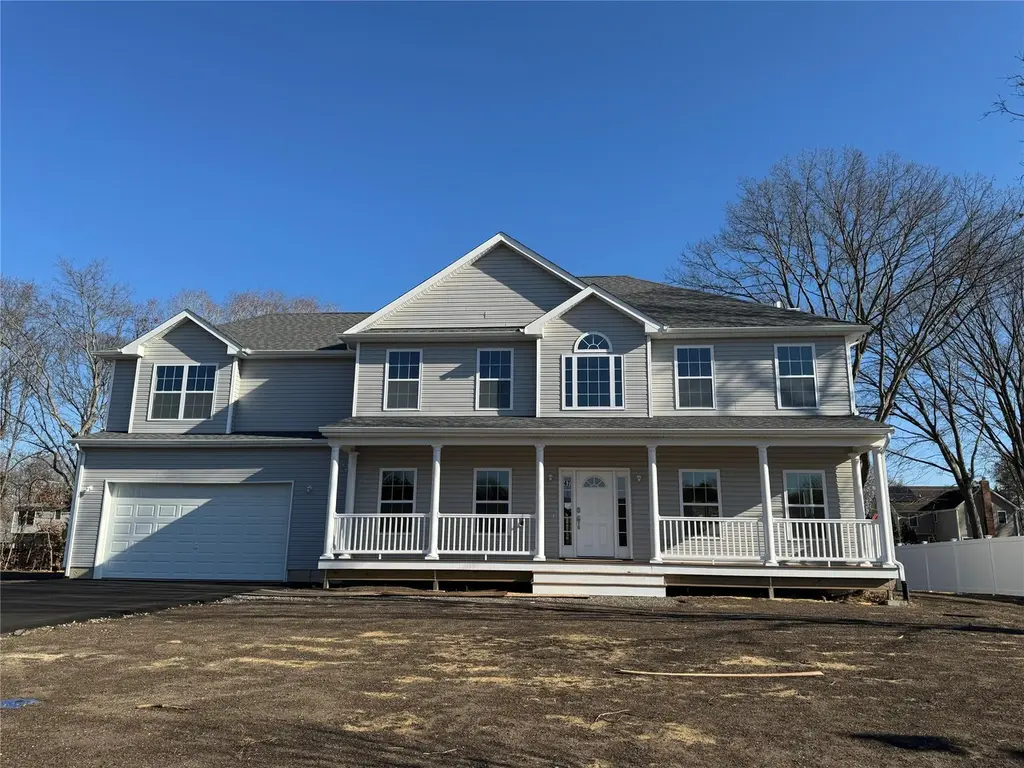
Listing remarks
To Be Built-Last Lot in 4 Lot Baywood Estates Subdivision!!! This 2,850 Sq Ft Colonial will feature 5 Bedrooms & 2.5 Bathrooms, 2 Story Entry Foyer, Formal Living Room & Formal Dining Room, Eik W/ Island Open to Den W/ Optional Fireplace, Granite Counters, Oak First Floor, Central Air, Primary Bedroom W/ Tray Ceiling, Wic, & Spa Like Bathroom, Full Basement & 2 Car Garage. Plans can be customized to suite. Photos show some optional upgrades.
Key facts
- 1.5 acre lot
- 2 garage spots
- Built 2025
Neighborhood map
What this means for you Summary
Snapshot
- This is a 5-bed/2.5-bath single-family listed at $995k.
Deal economics
- At list price, monthly cash flow is $9k ($107k/yr) — positive.
- The deal already cash-flows at list — no discount required.
- Meets the 1% rule at list price ($20k rent vs $995k).
- Recommended offer: $905k (9.0% below list) — sets the bar for market timing.
- Cap rate 17.1% vs local median 1.9% in Center Moriches — top-decile yield for the area; either an underpriced asset or a hidden risk that comps aren't pricing in. Stress-test before assuming the spread holds.
Location & tenants
- Location reads 66/100 on livability (#641 in NY) — a middle-class / working-renter tenant base. Strengths: employment A+, housing A+, schools A; Watch: amenities F, commute F, cost of living F.
- Center Moriches Union Free School District (suburban): math 65% / reading 55% proficiency, ranked #188 of 590 in NY (top 32%) — acceptable for families but not a draw, mixed tenant base, ~2y average lease; only 18% free/reduced lunch — higher-income household profile.
- Market conditions: 64 active listings in the ZIP; 1 comparable units currently listed for rent nearby; 1,366 units permitted in Suffolk County in 2024 (216 in 5+ unit buildings).
Forward outlook
- Local home prices are declining (-3.0%/yr); year-one equity from $7k of loan paydown is wiped out by about $30k of value loss. Plan a longer hold.
- Suffolk County population projected to shrink 5% by 2050 — rents likely to lag national; underwrite the cash flow, not the appreciation.
- At projected returns (-3.0% appreciation + 3.0% rent growth), your $279k cash investment doubles in ~4 years — after that, you're playing with house money.
Negotiation context
- It's been on market 105 days — a 9% lower offer ($905k) is reasonable based on typical stale-listing flexibility.
Questions for the listing agent
- It's been on market 105 days. Have you received any prior offers? Is the seller open to a 9% concession, seller financing, or rate buy-down credit?
- Why hasn't it sold? Are there any deal-killer items the seller is aware of (foundation, flood, title, zoning, code violations)?
- Is there a deadline driving the sale (1031 exchange, divorce, estate, relocation)? That informs how much negotiation room exists.
- Schools are A-rated — typically a magnet for longer-tenancy family renters. What's the average tenant stay here, and is there a school-zone premium baked into asking?
- What's the average days-on-market for RENTAL listings here right now (not sales)? A rising rental-DOM trend means longer vacancies and softer asking-rent achievability than the comps imply.
- What's the recent tenant-quality profile in this submarket — average credit score on applications, eviction rate, late-payment / NSF rate, and stable-employment percentage? A property-management company in the area should have these aggregated.
- How much new for-sale + rental construction is in the pipeline within 1–3 miles? Heavy new supply typically softens prices + rents 12–24 months out; constrained supply supports both.
Investment metrics
- 1% rule
- 2.01% ✓
- Cap rate
- 17.06%
- Cash-on-cash
- 38.44%
- DSCR
- 2.71
- GRM
- 4.1
CMA / ARV
- ARV (on-the-fly)
- $817,950
- Comps found
- 5
Show comp detail 5 sales within ~0.75 mi
| Address | Dist | Beds/Ba | Sqft | Sold | Price | $/sf | Match |
|---|---|---|---|---|---|---|---|
| TBB New Baywood Ests | 0.00mi | 5/2.5 | 2,850 (0%) | 5mo | $902,483 | $317 | 96 |
| N/C Baywood Path | 0.00mi | 4/2.5 (-1) | 2,650 (-7%) | 6mo | $846,148 | $319 | 78 |
| 26 Clinton St | 0.29mi | 4/2.5 (-1) | 2,724 (-4%) | 2mo | $720,000 | $264 | 72 |
| 10 Ocean Ave | 0.11mi | 4/3.0 (-1) | 3,000 (+5%) | 20mo | $662,500 | $221 | 63 |
| 10 Crosby St | 0.57mi | 6/2.0 (+1) | 2,562 (-10%) | 20mo | $735,000 | $287 | 33 |
Match score weights: distance 35% · size 25% · config 20% · recency 20%. Top-matched comps best support the ARV.
Projected returns pro-forma
-3.0% appreciation · 3.0% rent growth · sell at horizon
- IRR
- 34.6%
- Equity multiple
- 2.46×
- Total profit
- $407,429
- Equity at exit
- $148,358
- IRR
- 41.4%
- Equity multiple
- 4.90×
- Total profit
- $1,087,863
- Equity at exit
- $86,029
Cash invested: $278,600 (down + closing). Projections, not guarantees.
Landlord ↔ Tenant lean methodology
- Overall (STATE)
- 15 Strongly Tenant-Friendly
- State New York
- 15 Strongly Tenant-Friendly · D+10
- County
- — inherits STATE
- City
- — inherits STATE
ZIP-level market 11934
- Home prices YoY
- -21.5%
- Active inventory
- 64
- Price-to-rent
- 4.1×
Monthly cashflow live
- Estimated rent
- $20,000 medium interval (Pro) →
- Mortgage (P&I)
- −$5,218
- Tax est. 1.5%
- −$1,244 /mo · $14,925/yr
- Insurance
- −$415
- HOA
- −$0
- Vacancy / Maint / Mgmt
- −$4,200
- Net cashflow
- $8,924
Break-even live
Sensitivity live
| Price | -10% $9,611 | -5% $9,268 | +0% $8,924 | +5% $8,580 | +10% $8,236 |
|---|---|---|---|---|---|
| Rent | -10% $7,344 | -5% $8,134 | +0% $8,924 | +5% $9,714 | +10% $10,504 |
| Rate | -1.0pp $9,425 | -0.5pp $9,177 | base $8,924 | +0.5pp $8,666 | +1.0pp $8,404 |
UW: 25.0% down · 7.5% · 30yr · 1.5% tax · 5.0% vac · 8.0% maint · 8.0% mgmt
Financing live
Cash to close
- Down payment
- $248,750
- Closing costs
- $29,850
- Reserves months
- —
- Total cash needed
- —
Loan-product check · same deal, 3 products live
Conventional
25% down · 7.5% · 30yr
- Down + closing
- —
- Monthly P&I
- —
- Monthly cashflow
- —
- DSCR
- —
- Eligible?
- —
Personal DTI + credit; lowest rate.
DSCR
20% down · 8.5% · 30yr
- Down + closing
- —
- Monthly P&I
- —
- Monthly cashflow
- —
- DSCR
- —
- Eligible?
- —
No personal income docs; deal must DSCR.
Hard money
10% down · 12.0% · 12mo
- Down + closing
- —
- Monthly P&I
- —
- Monthly cashflow
- —
- DSCR
- —
- Eligible?
- —
Short-term bridge; refi at stabilization.
Rent comps 1 comps
| Address | Beds | Baths | Sqft | Rent | $/sqft | DOM | Units | Dist |
|---|---|---|---|---|---|---|---|---|
| 8 Tuthill Point Rd East Moriches, NY | 5.0 | 3.0 | 3000 | $20,000 | $6.67 | 44d | 1 | 1.43mi |
Listing history 2 events
-
2025-08-28status Pending
-
2025-05-15$995,000 Active
ⓘ Source: listings_history table (triggers on properties + properties_extension) + one-shot
backfill from property_details.listing_events for pre-trigger history.
Nearby sold comps map
Loading sold comps map…
Walkable amenities ~0.75 mi
Loading nearby amenities…
Taxation est. · year 1
- Rental income
- $240,000
- − Mortgage interest
- −$55,735
- − Property taxes
- −$14,925
- − Insurance
- −$4,975
- − Repairs & maintenance
- −$19,200
- − Management
- −$19,200
- − Depreciation
- −$28,945
- Taxable income
- $97,019
- Est. tax owed @ 24.0%
- −$23,285
- After-tax cash flow
- $83,801/yr
For passive investors: Depreciation is non-cash, so a rental often shows a tax loss while cash-flowing — sheltering income. Rental losses are passive: they offset passive income freely, and up to $25,000/yr can offset ordinary (W-2) income if you actively participate and your MAGI is under $100k (phasing out to $0 by $150k); unused losses carry forward. On sale, claimed depreciation is recaptured at up to 25%, and gains may owe capital-gains tax (a 1031 exchange can defer both). Figures are a year-1 estimate at your 24.0% rate — not tax advice; consult a CPA.
Schools (NCES district)
- District
- Center Moriches Union Free School District
- NCES district ID
- 3606840
- Math proficiency
- 65% ▼ -9.00%
- Reading proficiency
- 55% ▼ -6.00%
- Median HH income
- $86,698
- Composite
- 54.64/100
- National rank
- #1332
- State rank
- #188 of 590 in NY
Livability — Center Moriches
- Score
- 66/100
- State rank
- #641
- US rank
- #11936
Category grades
Schools grade is shown separately in the Schools card above.
Census & demographics
- Census place
- Center Moriches, NY
- City population
- 8,222
- Population (ZIP)
- 8,222
Population outlook (Suffolk County) Hauer SSP2
- Today (2025)
- 1,505,262 people
- By 2030
- 1,498,318 · -0.5%
- By 2040
- 1,471,101 · -2.3%
- By 2050
- 1,424,848 · -5.3%
- By 2075
- 1,337,157 · -11.2%
- By 2100
- 1,217,720 · -19.1%
Race, ethnicity, and origin ACS 2023
- Neighborhood character
- Predominantly White (79%)
- Race & ethnicity
- White 79% Hispanic / Latino 14% Two or more races 3% Black 2% Asian 2%
- Hispanic origin (detail)
- Common ancestry
- Italian 6% Romanian 6% Scotch-Irish 3%
- Foreign-born
- 6% · Canada, China
- Languages at home
- 90% English-only · Spanish 5% Other Indo-European 2% Chinese 1%
Political lean MEDSL · Suffolk
- 2024 margin
- Lean R (+10.0) · D 45.0% · R 55.0%
- 2008→2024 swing
- -16.0pp toward R · 2008: 6.0pp · 2024: -10.0pp
- All cycles
- 2024: R+10.0 2020: R+0.0 2016: R+8.2 2012: D+2.9 2008: D+6.0
Not yet ingested
- Civics
- —
Market trends
- HPI YoY
- ▼ -95.89%
- Current HPI
- 350.6186
- Rent YoY
- —
- Metro
- —
- State GDP YoY
- ▲ 2.60%
- F500 in state
- 92
Industry mix (Fortune 500 HQ in NY)
| Industry | F500 HQs | Revenue |
|---|---|---|
| Financial Services | 10 | $950B |
|
||
| Consumer Goods | 9 | $162B |
|
||
| Insurance | 4 | $225B |
|
||
| Telecommunications | 2 | $144B |
|
||
| Pharmaceuticals | 2 | $112B |
|
||
| Media / Entertainment | 2 | $69B |
|
||
Price history
2 events — show timeline
- 2025-08-28 Pending — OneKey® MLS as Distributed by MLS Grid
- 2025-05-15 Listed $995,000 OneKey® MLS as Distributed by MLS Grid
Cash-flow waterfall
monthlySold comps — $/sqft
last 12 mo · ≤1 miLoading sold comps…