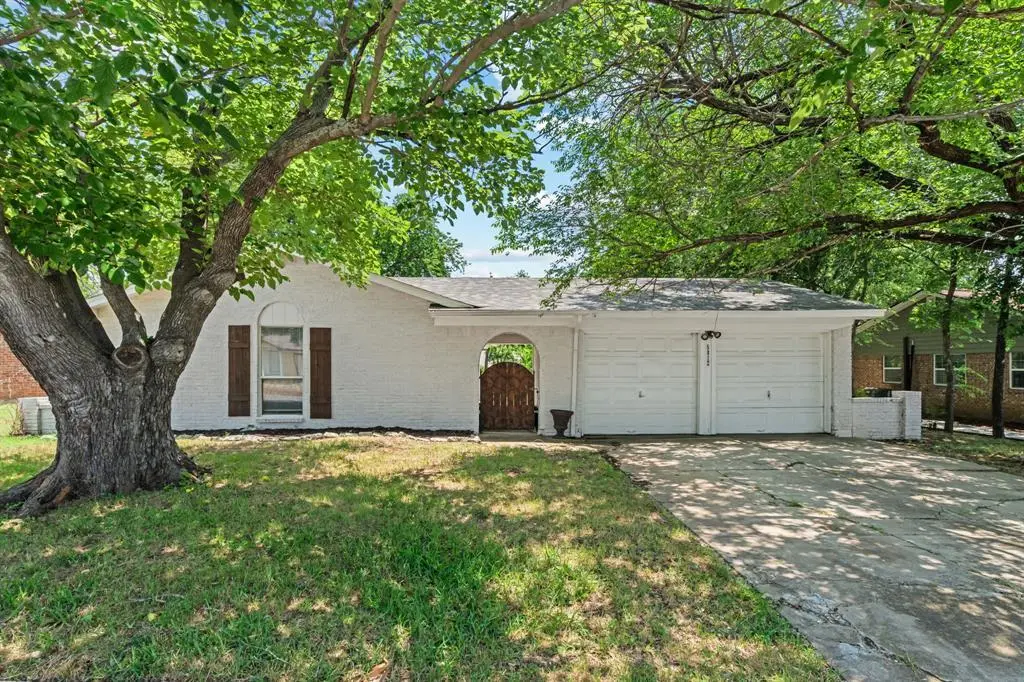
5812 Haney Dr · Watauga, TX
Flood risk 1/10 · Minimal
- FEMA flood zone
- X (unshaded)
- Chance of flooding over 30 yrs
- 0.0%
- Est. flood insurance / yr
- $507 – $1,088
Fire risk 3/10 · Minor
- Est. fire insurance / yr
- $1,222 – $2,270
Heat risk 7/10 · Major
- Hot days now (above 109°F)
- 7 days/yr
- Hot days in 30 yrs
- 23 days/yr
Wind risk 4/10 · Minor
- Chance of severe wind over 30 yrs
- 24.0%
Air-quality risk 4/10 · Minor
- Unhealthy air days now
- 4 days/yr
- Unhealthy air days in 30 yrs
- 5 days/yr
Risk factors via First Street. Map © Google.
Why this score? — see what drove the D+ grade
The composite is a weighted blend of 9 inputs, each scored 0–100. Each bar is that input's sub-score; the figure is the points it added to the 100-point composite (weight × sub-score).
- Cash flow +15.1/30.0
- ARV discount +8.2/15.0
- DSCR +4.6/10.0
- Livability +3.8/5.0
- 1% rule +3.7/10.0
- Schools +3.7/10.0
- Rent growth +3.6/5.0
- Condition / age +2.5/5.0
- Appreciation +0.0/10.0
$239,000
🖨 Deal sheet (PDF) 📄 Offer letter ✓ Due diligence
Listing remarks
Welcome to this charming 3-bedroom, 2-bath home nestled in the established Browning Heights neighborhood with mature trees and located in sought-after Birdville Independent School District! Built in 1969, this home is full of character and timeless charm while offering comfort and convenience in a fantastic location close to shopping, dining, parks, and everyday amenities. The kitchen features stainless steel appliances and functional workspace with a welcoming feel. One of the standout features of the home is the adorable private entrance and breezeway that adds a unique touch of privacy. Additional highlights include a spacious 2-car garage, large backyard and natural gas utilities. Wheth
Key facts
- Breezeway
- Large backyard
- Private entrance
Tags
Property features AI
Finance
- HOA & community: No HOA / association
Exterior
- Parking: Covered parking; Driveway; 2 covered spaces; 2-car garage with double doors and garage facing front; Garage dimensions approximately 20' wide x 20' long x 8' high
- Utilities: City water; City sewer; No municipal utility district
- Home design: Single family residence; Residential property; One story
- Construction: Built in 1969; Brick and siding construction; Composition roof; Slab foundation
- Exterior features: Interior lot; Less than 0.5 acre lot
Interior
- Kitchen: Kitchen with gas cooktop; Electric oven; Dishwasher; Kitchen measures approximately 8 x 11
- Bedrooms: Three bedrooms total; Primary bedroom with walk-in closet (1st level)
- Bathrooms: Two full bathrooms
- Heating & cooling: Central heating (natural gas); Central air conditioning (electric)
- Interior features: Cable TV available; One living area; One dining area; Total of 9 rooms; Single-level (One story)
- Laundry & utility: Laundry located in kitchen / utility in kitchen; Dedicated laundry room area (4 x 7)
Neighborhood map
What this means for you Summary
Snapshot
- This is a 3-bed/2.0-bath single-family listed at $239k.
Deal economics
- At list price, monthly cash flow is $78 ($933/yr) — positive.
- The deal already cash-flows at list — no discount required.
- To meet the 1% rule (rent ≥ 1% of price), the offer needs to be $208k (13.0% below list).
- Recommended offer: $208k (13.0% below list) — sets the bar for 1% rule.
- Cap rate 6.7% vs local median 4.6% in Watauga — top-decile yield for the area; either an underpriced asset or a hidden risk that comps aren't pricing in. Stress-test before assuming the spread holds.
Location & tenants
- Location reads 76/100 on livability (#105 in TX, #3,500 nationally) — a middle-class / working-renter tenant base. Strengths: crime A+, cost of living A+, housing A+; Watch: amenities F, commute F.
- Birdville ISD (suburban): math 42% / reading 43% proficiency, ranked #299 of 826 in TX (top 36%) — families likely to look elsewhere, expect single-tenant / working-renter base with shorter leases.
- Zoned schools: Watauga El (math 21% / reading 27%, grade F, #3,221 of 4,322 statewide, top 75%, 715 students, 80% FRL); Watauga Middle (math 32% / reading 36%, grade F, #892 of 1,662 statewide, top 55%, 608 students, 71% FRL); Haltom H S (math 37% / reading 48%, grade F, #721 of 1,632 statewide, top 45%, 2,785 students, 72% FRL) — zoned schools average 74% FRL vs 48% district-wide (26 pts higher); higher-poverty schools than district average — tighter screening recommended.
- Market conditions: Rents rising fast (+4.3%/yr); 132 active listings in the ZIP; 40 comparable units currently listed for rent nearby; rentals at typical pace (median 20d on market — plan ~3-4 weeks tenant-placement turnaround); solid renter incomes; 18,938 units permitted in Tarrant County in 2024 (8,336 in 5+ unit buildings).
Forward outlook
- Local home prices are declining (-3.0%/yr); year-one equity from $2k of loan paydown is wiped out by about $7k of value loss. Plan a longer hold.
- Tarrant County population projected at +41% by 2050 — long-run rental-demand tailwind backs the buy-and-hold thesis.
Negotiation context
- It's been on market 26 days — a 2% lower offer ($235k) is reasonable based on typical stale-listing flexibility.
Risks & watch-outs
- Climate carrying-cost: extreme-heat days projected 7→23/yr by 2055 (HVAC capex compounding) — expect insurance premiums to compound above CPI over the hold.
Questions for the listing agent
- Built in 1969 — when were the roof, HVAC, electrical panel, plumbing, and water heater last replaced?
- Is there a deadline driving the sale (1031 exchange, divorce, estate, relocation)? That informs how much negotiation room exists.
- The area grade is low — what's the realistic commute time and amenity access for the typical tenant pool here? Any planned neighborhood developments (good or bad) we should know about?
- What's the average days-on-market for RENTAL listings here right now (not sales)? A rising rental-DOM trend means longer vacancies and softer asking-rent achievability than the comps imply.
- What's the recent tenant-quality profile in this submarket — average credit score on applications, eviction rate, late-payment / NSF rate, and stable-employment percentage? A property-management company in the area should have these aggregated.
- How much new for-sale + rental construction is in the pipeline within 1–3 miles? Heavy new supply typically softens prices + rents 12–24 months out; constrained supply supports both.
Investment metrics
- 1% rule
- 0.87% ✗
- Cap rate
- 6.68%
- Cash-on-cash
- 1.39%
- DSCR
- 1.06
- GRM
- 9.6
CMA / ARV
- ARV (on-the-fly)
- $242,880
- Comps found
- 12
Show comp detail 12 sales within ~0.75 mi
| Address | Dist | Beds/Ba | Sqft | Sold | Price | $/sf | Match |
|---|---|---|---|---|---|---|---|
| 6104 Saramac Dr | 0.27mi | 3/2.0 | 1,134 (+3%) | 3mo | $249,900 | $220 | 81 |
| 6009 Deborah Ln | 0.38mi | 3/2.0 | 1,150 (+4%) | 2mo | $234,900 | $204 | 74 |
| 6204 Brookside Dr | 0.53mi | 3/2.0 | 1,099 (-0%) | 2mo | $245,000 | $223 | 73 |
| 5713 Emerson Dr | 0.36mi | 3/1.5 | 1,047 (-5%) | 4mo | $229,000 | $219 | 70 |
| 6621 Hughes Dr | 0.55mi | 3/2.0 | 1,118 (+1%) | 4mo | $264,500 | $237 | 69 |
| 5917 Whispering Ln | 0.42mi | 3/2.0 | 1,194 (+8%) | 2mo | $269,000 | $225 | 65 |
| 6417 Kennedy Ct | 0.41mi | 3/2.0 | 1,193 (+8%) | 4mo | $279,999 | $235 | 64 |
| 6021 Marigold Dr | 0.74mi | 3/2.0 | 1,124 (+2%) | 4mo | $195,000 | $173 | 59 |
| 6408 Greenfield Ct | 0.41mi | 3/2.0 | 1,264 (+14%) | 2mo | $277,000 | $219 | 55 |
| 5608 Twin Oaks Dr | 0.58mi | 3/2.0 | 1,204 (+9%) | 5mo | $239,000 | $199 | 54 |
| 6116 Mackneal Trl | 0.54mi | 3/2.0 | 1,260 (+14%) | 1mo | $250,000 | $198 | 50 |
| 6601 Jerri Lynn Dr | 0.54mi | 2/2.0 (-1) | 975 (-12%) | 2mo | $244,900 | $251 | 48 |
Match score weights: distance 35% · size 25% · config 20% · recency 20%. Top-matched comps best support the ARV.
Projected returns pro-forma
-3.0% appreciation · 4.34% rent growth · sell at horizon
- IRR
- -12.7%
- Equity multiple
- 0.54×
- Total profit
- $-30,954
- Equity at exit
- $35,636
- IRR
- -1.8%
- Equity multiple
- 0.87×
- Total profit
- $-8,676
- Equity at exit
- $20,664
Cash invested: $66,920 (down + closing). Projections, not guarantees.
Landlord ↔ Tenant lean methodology
- Overall (STATE)
- 87 Strongly Landlord-Friendly
- State Texas
- 87 Strongly Landlord-Friendly · R+5
- County
- — inherits STATE
- City
- — inherits STATE
ZIP-level market 76148
- Home prices YoY
- -17.1%
- Rents YoY
- 4.3%
- Active inventory
- 132
- Price-to-rent
- 9.6×
Monthly cashflow live
- Estimated rent
- $2,080 high interval (Pro) →
- Mortgage (P&I)
- −$1,253
- Tax from tax record
- −$213 /mo · $2,554/yr
- Insurance
- −$100
- HOA
- −$0
- Vacancy / Maint / Mgmt
- −$437
- Net cashflow
- $78
Break-even live
Sensitivity live
| Price | -10% $213 | -5% $145 | +0% $78 | +5% $10 | +10% $-58 |
|---|---|---|---|---|---|
| Rent | -10% $-87 | -5% $-4 | +0% $78 | +5% $160 | +10% $242 |
| Rate | -1.0pp $198 | -0.5pp $139 | base $78 | +0.5pp $16 | +1.0pp $-47 |
UW: 25.0% down · 7.5% · 30yr · 1.5% tax · 5.0% vac · 8.0% maint · 8.0% mgmt
Financing live
Cash to close
- Down payment
- $59,750
- Closing costs
- $7,170
- Reserves months
- —
- Total cash needed
- —
Loan-product check · same deal, 3 products live
Conventional
25% down · 7.5% · 30yr
- Down + closing
- —
- Monthly P&I
- —
- Monthly cashflow
- —
- DSCR
- —
- Eligible?
- —
Personal DTI + credit; lowest rate.
DSCR
20% down · 8.5% · 30yr
- Down + closing
- —
- Monthly P&I
- —
- Monthly cashflow
- —
- DSCR
- —
- Eligible?
- —
No personal income docs; deal must DSCR.
Hard money
10% down · 12.0% · 12mo
- Down + closing
- —
- Monthly P&I
- —
- Monthly cashflow
- —
- DSCR
- —
- Eligible?
- —
Short-term bridge; refi at stabilization.
Rent comps 40 comps
| Address | Beds | Baths | Sqft | Rent | $/sqft | DOM | Units | Dist |
|---|---|---|---|---|---|---|---|---|
| 5809 Haney Dr Watauga, TX | 3.0 | 2.0 | 1421 | $1,875 | $1.32 | 26d | 1 | 0.05mi |
| 5705 Saramac Dr Watauga, TX | 3.0 | 2.0 | 1224 | $2,195 | $1.79 | 45d | 1 | 0.19mi |
| 6075 Lalagray Ln Watauga, TX | 3.0 | 2.0 | 1202 | $1,895 | $1.58 | 5d | 1 | 0.25mi |
| 5929 Gayle Dr Watauga, TX | 3.0 | 2.0 | 1466 | $1,995 | $1.36 | 19d | 1 | 0.26mi |
| 5824 Storm Dr Watauga, TX | 3.0 | 2.0 | 1148 | $1,850 | $1.61 | 20d | 1 | 0.30mi |
| 5752 Shipp Dr Watauga, TX | 4.0 | 2.0 | 1444 | $2,300 | $1.59 | 1d | 1 | 0.38mi |
| 5809 Lance Ct Haltom City, TX | 4.0 | 2.0 | 1359 | $1,950 | $1.43 | 1d | 1 | 0.49mi |
| 6225 Stardust Dr S Watauga, TX | 3.0 | 2.0 | 1120 | $1,950 | $1.74 | 45d | 1 | 0.49mi |
| 6269 Stardust Dr S Watauga, TX | 3.0 | 2.0 | 1334 | $1,975 | $1.48 | 45d | 1 | 0.60mi |
| 5620 Oregon Trail Ct Haltom City, TX | 3.0 | 2.0 | 1190 | $1,839 | $1.55 | 18d | 1 | 0.62mi |
| 5621 Macdougall Dr Haltom City, TX | 3.0 | 2.0 | 1359 | $1,965 | $1.45 | 26d | 1 | 0.68mi |
| 6301 Sunnybrook Dr Fort Worth, TX | 3.0 | 2.0 | 1278 | $1,795 | $1.40 | 26d | 1 | 0.71mi |
| 6009 Marigold Dr Watauga, TX | 3.0 | 2.0 | 1180 | $2,091 | $1.77 | 14d | 1 | 0.74mi |
| 5544 Dunson Dr Haltom City, TX | 3.0 | 2.0 | 1187 | $1,950 | $1.64 | 45d | 1 | 0.74mi |
| 6401 Melinda Ct Watauga, TX | 3.0 | 2.0 | 1236 | $1,875 | $1.52 | 45d | 1 | 0.74mi |
| 6528 Bernadine Dr Watauga, TX | 3.0 | 2.0 | 1153 | $2,061 | $1.79 | 1d | 1 | 0.78mi |
| 6413 Melinda Ct Watauga, TX | 3.0 | 2.0 | 1182 | $1,995 | $1.69 | 26d | 1 | 0.78mi |
| 5604 Macgregor Dr Haltom City, TX | 3.0 | 2.0 | 1348 | $1,900 | $1.41 | 45d | 1 | 0.79mi |
| 6017 Hillcrest Dr Watauga, TX | 3.0 | 2.0 | 1314 | $1,950 | $1.48 | 9d | 1 | 0.92mi |
| 6029 Dustin Dr Watauga, TX | 3.0 | 2.0 | 1322 | $1,865 | $1.41 | 45d | 1 | 0.94mi |
| 6589 Old Mill Cir Watauga, TX | 3.0 | 2.0 | 1234 | $2,061 | $1.67 | 9d | 1 | 0.98mi |
| 6100 Browning Dr North Richland Hills, TX | 1.0–2.0 | 1.0–2.0 | 957 | $1,759 | $1.84 | 0d | 26 | 0.99mi |
| 6024 Herschel Dr Watauga, TX | 3.0 | 2.0 | 1418 | $1,950 | $1.38 | 23d | 1 | 1.00mi |
| 6024 Herschel Dr Watauga, TX | 3.0 | 2.0 | 1418 | $1,950 | $1.38 | 16d | 1 | 1.00mi |
| 6617 Nola Dr Watauga, TX | 3.0 | 2.0 | 1395 | $2,095 | $1.50 | 26d | 1 | 1.00mi |
| 4704 Aspen Way Haltom City, TX | 3.0 | 2.0 | 1379 | $2,025 | $1.47 | 9d | 1 | 1.02mi |
| 4617 Aspen Way Haltom City, TX | 3.0 | 2.0 | 1208 | $1,850 | $1.53 | 7d | 1 | 1.06mi |
| 4617 Aspen Way Haltom City, TX | 3.0 | 2.0 | 1208 | $1,850 | $1.53 | 9d | 1 | 1.06mi |
| 6309 Iron Horse Blvd North Richland Hills, TX | 2.0 | 1.0–2.0 | 912 | $2,179 | $2.39 | 3d | 29 | 1.11mi |
| 6490 Iron Horse Blvd Unit 6523 North Richland Hills, TX | 3.0 | 2.0 | 1298 | $2,354 | $1.81 | 0d | 1 | 1.14mi |
| 6490 Iron Horse Blvd Unit 6527 North Richland Hills, TX | 2.0 | 2.0 | 1033 | $1,854 | $1.79 | 0d | 1 | 1.14mi |
| 6424 Iron Horse Blvd Unit 6481 North Richland Hills, TX | 2.0 | 2.0 | 884 | $1,332 | $1.51 | 0d | 1 | 1.20mi |
| 6424 Iron Horse Blvd North Richland Hills, TX | 2.0 | 2.0 | 884 | $1,567 | $1.77 | 14d | 1 | 1.20mi |
| 6250 Rosewood Dr North Richland Hills, TX | 1.0–4.0 | 1.0–3.0 | 1338 | $2,203 | $1.65 | 0d | 17 | 1.24mi |
| 6701 Windwillow Dr Fort Worth, TX | 3.0 | 2.0 | 1007 | $1,695 | $1.68 | 20d | 1 | 1.26mi |
| 6701 Windwillow Dr Fort Worth, TX | 3.0 | 2.0 | 1007 | $1,695 | $1.68 | 26d | 1 | 1.26mi |
| 6713 Windwillow Dr Fort Worth, TX | 2.0 | 1.0 | 1009 | $1,850 | $1.83 | 13d | 1 | 1.26mi |
| 6405 Kary Lynn Dr S Watauga, TX | 3.0 | 2.0 | 1072 | $1,950 | $1.82 | 26d | 1 | 1.30mi |
| 5722 Westchase Dr North Richland Hills, TX | 2.0 | 2.0 | 1150 | $1,800 | $1.57 | 26d | 1 | 1.35mi |
| 7320 Echo Hill Dr Watauga, TX | 3.0 | 2.0 | 1287 | $1,890 | $1.47 | 45d | 1 | 1.38mi |
Listing history 18 events
-
2026-06-18status $239,000 Pending 26 DOM
-
2026-06-18days on market $239,000 Active Option Contract 26 DOM
-
2026-06-17days on market $239,000 Active Option Contract 25 DOM
-
2026-06-16days on market $239,000 Active Option Contract 24 DOM
-
2026-06-15days on market $239,000 Active Option Contract 23 DOM
-
2026-06-13days on market $239,000 Active Option Contract 21 DOM
-
2026-06-10status $239,000 Active Option Contract 17 DOM
-
2026-06-09days on market $239,000 Active 17 DOM
-
2026-06-08days on market $239,000 Active 16 DOM
-
2026-06-07days on market $239,000 Active 15 DOM
-
2026-06-04days on market $239,000 Active 12 DOM
-
2026-06-03days on market $239,000 Active 11 DOM
-
2026-06-02days on market $239,000 Active 10 DOM
-
2026-06-01days on market $239,000 Active 9 DOM
-
2026-05-31days on market $239,000 Active 8 DOM
-
2026-05-23$239,000 Active
-
2014-09-11soldstatus
-
2014-09-08soldstatus
ⓘ Source: listings_history table (triggers on properties + properties_extension) + one-shot
backfill from property_details.listing_events for pre-trigger history.
Tax reassessment forecast TX · Resets to sale price
- Current annual tax
- $2,554 · $213/mo
- Projected year-2 tax
- $4,374 · $364/mo
- Expected delta
- +$1,819/yr (+$152/mo · 71.2%)
ⓘ Screening estimate from a state-policy table — verify with the county assessor before closing.
Climate risk First Street
- Flood 1/10 Low FEMA zone X (unshaded) · 0% chance over 30 yrs
- Wildfire 3/10 Moderate
- Heat 7/10 Severe 7 d/yr ≥109°F today · 23 d/yr by 30 yrs out
- Wind 4/10 Moderate 24% chance of damaging wind over 30 yrs
- Air quality 4/10 Moderate 4 unhealthy d/yr today · 5 by 30 yrs out
Nearby sold comps map
Loading sold comps map…
Walkable amenities ~0.75 mi
Loading nearby amenities…
Taxation est. · year 1
- Rental income
- $24,966
- − Mortgage interest
- −$13,388
- − Property taxes
- −$2,554
- − Insurance
- −$1,195
- − Repairs & maintenance
- −$1,997
- − Management
- −$1,997
- − Depreciation
- −$6,953
- Taxable loss
- −$3,119
- Est. tax savings @ 24.0%
- +$749
- After-tax cash flow
- $1,682/yr
For passive investors: Depreciation is non-cash, so a rental often shows a tax loss while cash-flowing — sheltering income. Rental losses are passive: they offset passive income freely, and up to $25,000/yr can offset ordinary (W-2) income if you actively participate and your MAGI is under $100k (phasing out to $0 by $150k); unused losses carry forward. On sale, claimed depreciation is recaptured at up to 25%, and gains may owe capital-gains tax (a 1031 exchange can defer both). Figures are a year-1 estimate at your 24.0% rate — not tax advice; consult a CPA.
Schools (NCES district)
- District
- Birdville ISD
- NCES district ID
- 4810230
- Math proficiency
- 42% ▼ -12.00%
- Reading proficiency
- 43% ▼ -6.00%
- Median HH income
- $55,930
- Composite
- 37.13/100
- National rank
- #4491
- State rank
- #299 of 826 in TX
Livability — Watauga
- Score
- 76/100
- State rank
- #105
- US rank
- #3500
Category grades
Schools grade is shown separately in the Schools card above.
Census & demographics
- Census place
- Watauga, TX
- County
- Tarrant County · 2,033,669 people
- City population
- 23,367
- Metro
- Dallas-Fort Worth-Arlington, TX
- Population (ZIP)
- 23,367
- Household income
- $89,840
- Rent vs Own
- Severe rent burden
- 373.0
Population outlook (Tarrant County) Hauer SSP2
- Today (2025)
- 2,380,417 people
- By 2030
- 2,578,900 · +8.3%
- By 2040
- 2,974,995 · +25.0%
- By 2050
- 3,350,489 · +40.8%
- By 2075
- 4,216,909 · +77.2%
- By 2100
- 4,741,527 · +99.2%
Race, ethnicity, and origin ACS 2023
- Neighborhood character
- Diverse neighborhood (Simpson 0.59)
- Race & ethnicity
- White 57% Hispanic / Latino 29% Two or more races 16% Black 6% Asian 5% Native American 1%
- Hispanic origin (detail)
- Mexican 22% Puerto Rican 2%
- Common ancestry
- Lithuanian 2% Slovak 2% Italian 1%
- Foreign-born
- 12% · Canada, Vietnam
- Languages at home
- 79% English-only · Spanish 16% Tagalog/Filipino 2% Other Asian/Pacific 2%
Political lean MEDSL · Tarrant
- 2024 margin
- Lean R (+5.1) · D 46.7% · R 51.9% · Other 1.4%
- 2008→2024 swing
- +6.6pp toward D · 2008: -11.7pp · 2024: -5.1pp
- All cycles
- 2024: R+5.1 2020: D+0.2 2016: R+8.7 2012: R+15.7 2008: R+11.7
Not yet ingested
- Civics
- —
Market trends
- HPI YoY
- ▼ -64.11%
- Current HPI
- 310.2504
- Rent YoY
- ▲ 4.34%
- Metro
- Dallas-Fort Worth-Arlington, TX
- State GDP YoY
- ▲ 3.95%
- F500 in state
- 110
Industry mix (Fortune 500 HQ in TX)
| Industry | F500 HQs | Revenue |
|---|---|---|
| Energy | 16 | $1,198B |
|
||
| Technology | 5 | $198B |
|
||
| Engineering / Construction | 4 | $72B |
|
||
| Energy Services | 3 | $60B |
|
||
| Utilities | 3 | $41B |
|
||
| Healthcare | 2 | $330B |
|
||
Price history
3 events — show timeline
- 2026-05-23 Listed $239,000 NTREIS
- 2014-09-11 Sold (Public Records) — Public Records
- 2014-09-08 Sold (Public Records) — Public Records
Property tax history
+2.3%/yrLatest (2025): $2,554 · -19.2% YoY. Source: county tax records.
Cash-flow waterfall
monthlySold comps — $/sqft
last 12 mo · ≤1 miLoading sold comps…