12115 Talmadge Reach Dr · Atascocita, TX
Flood risk 7/10 · Major
- FEMA flood zone
- X (unshaded)
- Chance of flooding over 30 yrs
- 0.99%
- Est. flood insurance / yr
- $507 – $1,088
Fire risk 1/10 · Minimal
- Est. fire insurance / yr
- $1,222 – $2,270
Heat risk 9/10 · Severe
- Hot days now (above 110°F)
- 7 days/yr
- Hot days in 30 yrs
- 22 days/yr
Wind risk 9/10 · Severe
- Chance of severe wind over 30 yrs
- 99.0%
Air-quality risk 3/10 · Minor
- Unhealthy air days now
- 2 days/yr
- Unhealthy air days in 30 yrs
- 3 days/yr
Risk factors via First Street. Map © Google.
Why this score? — see what drove the C+ grade
The composite is a weighted blend of 9 inputs, each scored 0–100. Each bar is that input's sub-score; the figure is the points it added to the 100-point composite (weight × sub-score).
- Cash flow +17.5/30.0
- ARV discount +15.0/15.0
- 1% rule +6.5/10.0
- DSCR +5.5/10.0
- Appreciation +4.5/10.0
- Schools +3.9/10.0
- Livability +3.5/5.0
- Rent growth +2.5/5.0
- Condition / age +2.5/5.0
$449,000
🖨 Deal sheet 📄 Offer letter ✓ Due diligence
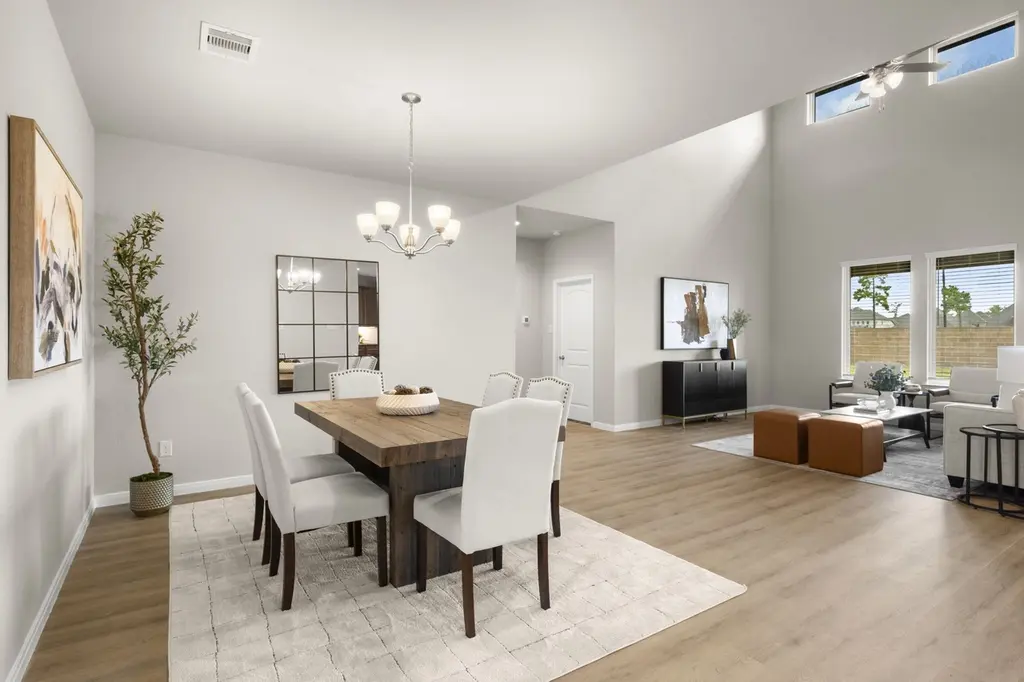
Listing remarks
Welcome to this beautiful home located in the desirable gated community of Balmoral. Step inside to an inviting open floor plan featuring brand new luxury vinyl plank flooring and fresh interior paint throughout. The kitchen boasts stainless steel appliances and granite countertops. The thoughtfully designed layout includes two bedrooms conveniently located downstairs. The dedicated office with double doors provides a great space for work or study. It could also be a 5th bedroom if needed instead of an office, there is a closet space! Upstairs you'll find a spacious game room. Enjoy the expansive backyard with no back neighbors, ideal for entertaining, relaxing or enjoying the wide open vie
Key facts
- Gated community
- Dedicated office
- Granite countertops
Tags
Property features AI
Finance
- Other: Municipal Utility District disclosure; Seller disclosure
- HOA & community: Balmoral HOA (annual fee); Association amenities include clubhouse, fitness center, pool, playground, basketball court, party/meeting room, trails, park, controlled access/gated community; Association fee billed annually and includes clubhouse, common areas, and recreation facilities
Exterior
- Parking: Attached garage; 2-car garage
- Security: Owned security system; Controlled access
- Utilities: Public water; Public sewer
- Home design: Residential property; Full ownership; Slab foundation; Composition roof; Built in 2019; Subdivision lot
- Construction: Brick and stone construction
- Exterior features: Covered patio; Deck; Patio; Fence (back yard); Sprinkler/irrigation; Association pool
Interior
- Kitchen: Dishwasher; Electric oven; Gas range; Microwave; Disposal; Granite counters; Kitchen island; Breakfast bar; Pantry; Walk-in pantry
- Bedrooms: Primary bedroom on first floor (18x17); Bedroom on second floor (18x11); Bedroom on first floor (12x12); Bedroom on second floor (12x11); Game room on second floor (18x11)
- Flooring: Carpet; Plank; Vinyl
- Bathrooms: 3 full bathrooms; Double vanity; Soaking tub; Separate shower; Tub/shower
- Heating & cooling: Central heating (gas); Central air conditioning (electric)
- Interior features: Breakfast bar; Double vanity; Granite counters; Kitchen island; Kitchen/family room combo; Pantry; Walk-in pantry; Soaking tub; Separate shower; Tub/shower; Vanity; Ceiling fan(s); Kitchen/dining combo; Living/dining room
- Laundry & utility: Washer hookup; Electric dryer hookup; Tankless water heater
Neighborhood map
What this means for you Summary
Snapshot
- This is a 5-bed/4.0-bath single-family listed at $449k.
Deal economics
- At list price, monthly cash flow is $279 ($3k/yr) — positive.
- The deal already cash-flows at list — no discount required.
- Meets the 1% rule at list price ($5k rent vs $449k).
- Cap rate 7.2% vs local median 4.1% in Atascocita — top-decile yield for the area; either an underpriced asset or a hidden risk that comps aren't pricing in. Stress-test before assuming the spread holds.
Location & tenants
- Location reads 70/100 on livability (#346 in TX) — a middle-class / working-renter tenant base. Strengths: employment A+, cost of living A+, housing A+; Watch: amenities F, commute F, health & safety F.
- Humble ISD (urban): math 38% / reading 44% proficiency, ranked #262 of 826 in TX (top 32%) — families likely to look elsewhere, expect single-tenant / working-renter base with shorter leases.
- Zoned schools: Ridge Creek El (math 26% / reading 33%, grade F, #2,525 of 4,322 statewide, top 62%, 1,125 students, 74% FRL); Autumn Ridge Middle (1,039 students, 71% FRL); Summer Creek H S (math 33% / reading 48%, grade F, #798 of 1,632 statewide, top 49%, 3,600 students, 45% FRL) — zoned schools average 63% FRL vs 32% district-wide (31 pts higher); higher-poverty schools than district average — tighter screening recommended.
- Market conditions: Rents flat; 669 active listings in the ZIP; 2 comparable units currently listed for rent nearby; high-income renter base; 29,883 units permitted in Harris County in 2024 (8,621 in 5+ unit buildings).
- At $5,152/mo this rent would consume 51% of the median local household income ($122k/yr) (locally 1072% of renters already pay >50% of income on rent) — very limited rent-growth headroom before tenants either downsize or default.
Forward outlook
- Local home prices are declining (-0.9%/yr); year-one equity from $3k of loan paydown is wiped out by about $4k of value loss. Plan a longer hold.
- Harris County population projected at +47% by 2050 — long-run rental-demand tailwind backs the buy-and-hold thesis.
Negotiation context
- Only 12 days on market — expect competitive offers; lowballing is unlikely to land.
- 4 sale attempts with the ask held roughly flat each time — persistent listings suggest the price (not the market) is what's stuck; bring a comps-based counter.
Risks & watch-outs
- Watch-outs: property tax is 2.7% of price; flood insurance adds $66/mo.
- Climate carrying-cost: major flood risk; severe wind risk, 99% chance of damaging wind over 30y; extreme-heat days projected 7→22/yr by 2055 (HVAC capex compounding) — expect insurance premiums to compound above CPI over the hold.
Questions for the listing agent
- Property tax is high relative to price — has the assessment been appealed recently, and will the sale trigger a re-assessment?
- What's the actual annual flood-insurance premium (NFIP or private), and is the property in a SFHA with mandatory coverage?
- What does the HOA fee cover, when was the last increase, and are there any pending special assessments or reserve-fund shortfalls?
- Is there a deadline driving the sale (1031 exchange, divorce, estate, relocation)? That informs how much negotiation room exists.
- What's the average days-on-market for RENTAL listings here right now (not sales)? A rising rental-DOM trend means longer vacancies and softer asking-rent achievability than the comps imply.
- What's the recent tenant-quality profile in this submarket — average credit score on applications, eviction rate, late-payment / NSF rate, and stable-employment percentage? A property-management company in the area should have these aggregated.
- How much new for-sale + rental construction is in the pipeline within 1–3 miles? Heavy new supply typically softens prices + rents 12–24 months out; constrained supply supports both.
Investment metrics
- 1% rule
- 1.15% ✓
- Cap rate
- 7.22%
- Cash-on-cash
- 3.29%
- DSCR
- 1.15
- GRM
- 7.3
CMA / ARV
- ARV (median comp)
- $540,024
- List price
- $449,000
- Delta
- -16.86%
- Verdict
- UNDERPRICED
- Comps
- 20 within 1.0 mi
Show comp detail 12 sales within ~0.75 mi
| Address | Dist | Beds/Ba | Sqft | Sold | Price | $/sf | Match |
|---|---|---|---|---|---|---|---|
| 12115 Talmadge Reach Dr | 0.00mi | 4/3.0 (-1) | 3,964 (0%) | 0mo | $449,000 | $113 | 91 |
| 15438 Hopkins Cedar Dr | 0.08mi | 4/3.5 (-1) | 3,972 (+0%) | 8mo | $500,000 | $126 | 83 |
| 11919 Alsey Rose Dr | 0.23mi | 5/4.5 | 4,066 (+3%) | 2mo | $540,900 | $133 | 81 |
| 12107 Allington Cove Ln | 0.07mi | 4/3.5 (-1) | 4,149 (+5%) | 10mo | $599,000 | $144 | 74 |
| 15771 Deeside Spring Dr | 0.23mi | 5/4.5 | 3,781 (-5%) | 7mo | $650,000 | $172 | 74 |
| 12007 Delwood Terrace Dr | 0.14mi | 5/4.5 | 3,863 (-2%) | 23mo | $610,999 | $158 | 68 |
| 12106 River Dee Dr | 0.17mi | 5/4.5 | 3,781 (-5%) | 21mo | $645,000 | $171 | 65 |
| 12023 Allington Cove Ln | 0.11mi | 4/3.5 (-1) | 3,471 (-12%) | 3mo | $474,900 | $137 | 65 |
| 15718 Ballater Ridge Ln | 0.28mi | 4/4.5 (-1) | 3,838 (-3%) | 14mo | $723,999 | $189 | 63 |
| 15762 Deeside Spring Dr | 0.25mi | 4/3.5 (-1) | 3,490 (-12%) | 14mo | $599,000 | $172 | 49 |
| 15403 Falkirk Green Dr | 0.32mi | 6/4.0 (+1) | 3,537 (-11%) | 21mo | $457,000 | $129 | 45 |
| 15407 Arrowhead Ridge Dr | 0.71mi | 4/3.5 (-1) | 3,389 (-14%) | 16mo | $399,900 | $118 | 22 |
Match score weights: distance 35% · size 25% · config 20% · recency 20%. Top-matched comps best support the ARV.
Projected returns pro-forma
-0.95% appreciation · 0.09% rent growth · sell at horizon
- IRR
- -5.5%
- Equity multiple
- 0.77×
- Total profit
- $-29,285
- Equity at exit
- $109,372
- IRR
- -1.9%
- Equity multiple
- 0.84×
- Total profit
- $-19,824
- Equity at exit
- $115,693
Cash invested: $125,720 (down + closing). Projections, not guarantees.
Landlord ↔ Tenant lean methodology
- Overall (STATE)
- 87 Strongly Landlord-Friendly
- State Texas
- 87 Strongly Landlord-Friendly · R+5
- County
- — inherits STATE
- City
- — inherits STATE
ZIP-level market 77346
- Home prices YoY
- -0.4%
- Rents YoY
- 0.1%
- Active inventory
- 669
- Price-to-rent
- 7.3×
Monthly cashflow live
- Estimated rent
- $5,152 medium interval (Pro) →
- Mortgage (P&I)
- −$2,355
- Tax from tax record
- −$1,022 /mo · $12,264/yr
- Insurance
- −$187
- Flood insurance flood zone
- −$66 /mo · $798/yr
- HOA
- −$161
- Vacancy / Maint / Mgmt
- −$1,082
- Net cashflow
- $279
Break-even live
UW: 25.0% down · 7.5% · 30yr · 1.5% tax · 5.0% vac · 8.0% maint · 8.0% mgmt
Financing live
Cash to close
- Down payment
- $112,250
- Closing costs
- $13,470
- Reserves months
- —
- Total cash needed
- —
Loan-product check · same deal, 3 products live
Conventional
25% down · 7.5% · 30yr
- Down + closing
- —
- Monthly P&I
- —
- Monthly cashflow
- —
- DSCR
- —
- Eligible?
- —
Personal DTI + credit; lowest rate.
DSCR
20% down · 8.5% · 30yr
- Down + closing
- —
- Monthly P&I
- —
- Monthly cashflow
- —
- DSCR
- —
- Eligible?
- —
No personal income docs; deal must DSCR.
Hard money
10% down · 12.0% · 12mo
- Down + closing
- —
- Monthly P&I
- —
- Monthly cashflow
- —
- DSCR
- —
- Eligible?
- —
Short-term bridge; refi at stabilization.
Rent comps 2 comps
| Address | Beds | Baths | Sqft | Rent | $/sqft | DOM | Units | Dist |
|---|---|---|---|---|---|---|---|---|
| 11347 Needlerock Ct Unit 1310533P Humble, TX | 4.0 | 3.0 | 3239 | $9,388 | $2.90 | 43d | 1 | 0.59mi |
| 16411 Little Pine Creek Dr Humble, TX | 4.0 | 3.0 | 2646 | $2,976 | $1.12 | 5d | 1 | 0.92mi |
HOA detail
- Monthly dues
- $161 · $1,932/yr
- Likely covers
- security
Listing history 9 events
-
2026-05-06status Pending 995-char remark
-
2026-04-24$449,000 Active 995-char remark
-
2026-04-24historical
-
2025-12-04$465,000 Active
-
2025-12-04historical
-
2025-09-12$485,000 Active
-
2025-08-28soldstatus Closed
-
2025-07-20status Pending
-
2025-07-16$399,990 Active
ⓘ Source: listings_history table (triggers on properties + properties_extension) + one-shot
backfill from property_details.listing_events for pre-trigger history.
Tax reassessment forecast TX · Resets to sale price
- Current annual tax
- $12,264 · $1,022/mo
- Projected year-2 tax
- $12,264 · $1,022/mo
- Expected delta
- $0/yr ($0/mo · 0.0%)
ⓘ Screening estimate from a state-policy table — verify with the county assessor before closing.
Climate risk First Street
- Flood 7/10 Severe FEMA zone X (unshaded) · 99% chance over 30 yrs
- Wildfire 1/10 Low
- Heat 9/10 Extreme 7 d/yr ≥110°F today · 22 d/yr by 30 yrs out
- Wind 9/10 Extreme 99% chance of damaging wind over 30 yrs
- Air quality 3/10 Moderate 2 unhealthy d/yr today · 3 by 30 yrs out
Nearby sold comps map
Loading sold comps map…
Walkable amenities ~0.75 mi
Loading nearby amenities…
Taxation est. · year 1
- Rental income
- $61,821
- − Mortgage interest
- −$25,151
- − Property taxes
- −$12,264
- − Insurance
- −$3,042
- − Repairs & maintenance
- −$4,946
- − Management
- −$4,946
- − HOA
- −$1,932
- − Depreciation
- −$13,062
- Taxable loss
- −$3,522
- Est. tax savings @ 24.0%
- +$845
- After-tax cash flow
- $4,190/yr
For passive investors: Depreciation is non-cash, so a rental often shows a tax loss while cash-flowing — sheltering income. Rental losses are passive: they offset passive income freely, and up to $25,000/yr can offset ordinary (W-2) income if you actively participate and your MAGI is under $100k (phasing out to $0 by $150k); unused losses carry forward. On sale, claimed depreciation is recaptured at up to 25%, and gains may owe capital-gains tax (a 1031 exchange can defer both). Figures are a year-1 estimate at your 24.0% rate — not tax advice; consult a CPA.
Schools (NCES district)
- District
- Humble ISD
- NCES district ID
- 4823910
- Math proficiency
- 38% ▼ -11.00%
- Reading proficiency
- 44% ▼ -7.00%
- Median HH income
- $83,946
- Composite
- 38.55/100
- National rank
- #4171
- State rank
- #262 of 826 in TX
Livability — Atascocita
- Score
- 70/100
- State rank
- #346
- US rank
- #7586
Category grades
Schools grade is shown separately in the Schools card above.
Census & demographics
- Census place
- Atascocita, TX
- County
- Harris County · 4,702,590 people
- City population
- 79,538
- Metro
- Houston-The Woodlands-Sugar Land, TX
- Population (ZIP)
- 79,538
- Household income
- $122,241
- Rent vs Own
- Severe rent burden
- 1072.0
Population outlook (Harris County) Hauer SSP2
- Today (2025)
- 5,571,493 people
- By 2030
- 6,089,821 · +9.3%
- By 2040
- 7,142,806 · +28.2%
- By 2050
- 8,185,864 · +46.9%
- By 2075
- 10,574,329 · +89.8%
- By 2100
- 12,109,958 · +117.4%
Race, ethnicity, and origin ACS 2023
- Neighborhood character
- Diverse neighborhood (Simpson 0.70)
- Race & ethnicity
- White 42% Hispanic / Latino 28% Black 21% Two or more races 18% Asian 4%
- Hispanic origin (detail)
- Mexican 20% Puerto Rican 2%
- Common ancestry
- Lithuanian 4% Slovak 1% Italian 1%
- Foreign-born
- 10% · Canada, Vietnam, China
- Languages at home
- 78% English-only · Spanish 17% Other Indo-European 1% German/W. Germanic 1%
Political lean MEDSL · Harris
- 2024 margin
- Lean D (+5.5) · D 52.0% · R 46.4% · Other 1.6%
- 2008→2024 swing
- +3.9pp toward D · 2008: 1.6pp · 2024: 5.5pp
- All cycles
- 2024: D+5.5 2020: D+13.3 2016: D+12.4 2012: D+0.1 2008: D+1.6
Not yet ingested
- Civics
- —
Market trends
- HPI YoY
- ▼ -0.95%
- Current HPI
- 218.0478
- Rent YoY
- ▲ 0.09%
- Metro
- Houston-The Woodlands-Sugar Land, TX
- State GDP YoY
- ▲ 3.95%
- F500 in state
- 110
Industry mix (Fortune 500 HQ in TX)
| Industry | F500 HQs | Revenue |
|---|---|---|
| Energy | 16 | $1,198B |
|
||
| Technology | 5 | $198B |
|
||
| Engineering / Construction | 4 | $72B |
|
||
| Energy Services | 3 | $60B |
|
||
| Utilities | 3 | $41B |
|
||
| Healthcare | 2 | $330B |
|
||
Price history
+12.3% since first listed10 events — show timeline
- 2026-06-16 Sold (MLS) — HARMLS
- 2026-05-06 Pending — HARMLS
- 2026-04-24 Listing Removed — HARMLS
- 2026-04-24 Listed $449,000 HARMLS
- 2025-12-04 Listing Removed — HARMLS
- 2025-12-04 Listed $465,000 HARMLS
- 2025-09-12 Listed $485,000 HARMLS
- 2025-08-28 Sold (MLS) — HARMLS
- 2025-07-20 Pending — HARMLS
- 2025-07-16 Listed $399,990 HARMLS
Property tax history
+37.7%/yrLatest (2025): $12,264 · -4.5% YoY. Source: county tax records.
Cash-flow waterfall
monthlySold comps — $/sqft
last 12 mo · ≤1 miLoading sold comps…