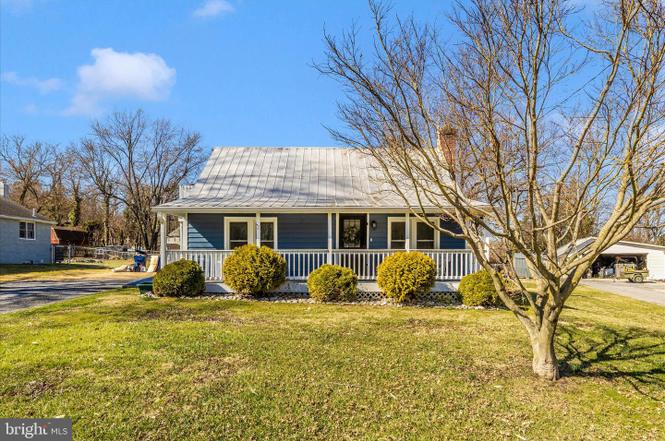
5618 Bartonsville Rd · Bartonsville, MD
Flood risk 1/10 · Minimal
- FEMA flood zone
- X (unshaded)
- Chance of flooding over 30 yrs
- 0.0%
- Est. flood insurance / yr
- $507 – $1,088
Fire risk 2/10 · Minimal
- Est. fire insurance / yr
- $755 – $1,403
Heat risk 6/10 · Moderate
- Hot days now (above 103°F)
- 7 days/yr
- Hot days in 30 yrs
- 16 days/yr
Wind risk 3/10 · Minor
- Chance of severe wind over 30 yrs
- 7.0%
Air-quality risk 2/10 · Minimal
- Unhealthy air days now
- 1 days/yr
- Unhealthy air days in 30 yrs
- 1 days/yr
Risk factors via First Street. Map © Google.
Why this score? — see what drove the C- grade
The composite is a weighted blend of 9 inputs, each scored 0–100. Each bar is that input's sub-score; the figure is the points it added to the 100-point composite (weight × sub-score).
- Cash flow +19.4/30.0
- ARV discount +9.0/15.0
- DSCR +6.1/10.0
- 1% rule +4.5/10.0
- Schools +3.4/10.0
- Rent growth +3.1/5.0
- Livability +3.1/5.0
- Condition / age +2.5/5.0
- Appreciation +0.0/10.0
$289,900
🖨 Deal sheet (PDF) 📄 Offer letter ✓ Due diligence
Listing remarks
🏡 NO HOA + . 60 ACRES in Frederick! USDA 0% DOWN eligible for qualified buyers🌳 Welcome to 5618 Bartonsville Rd — a fantastic single family home in an unbeatable location! Just a stroll to Avery’s Seafood and Spring Ridge Shopping Center, yet tucked away with peaceful outdoor space and room to breathe. ✨ Home Features: 🛏 4 Bedrooms 🛁 1.5 Bathrooms 👑 Owner’s Suite on the Main Level 🍳 Huge Updated Gourmet Kitchen with Breakfast Bar 🧺 Main Level Laundry 🌳 Deck + Fenced Backyard + Shed 🪑 Glorious Front Porch for Relaxing Evenings 🆕 Fresh Paint, New Carpeting & Laminate Flooring 🏠 Metal Roof 🔨 Unfinished Basement Ready for Your Ideas Enjoy tranquility and space while be
Key facts
- 0.6 acre lot
- Garage
- Built 1950
Neighborhood map
What this means for you Summary
Snapshot
- This is a 4-bed/1.0-bath single-family listed at $290k.
Deal economics
- At list price, monthly cash flow is $322 ($4k/yr) — positive.
- The deal already cash-flows at list — no discount required.
- To meet the 1% rule (rent ≥ 1% of price), the offer needs to be $277k (4.5% below list).
- Recommended offer: $277k (4.5% below list) — sets the bar for 1% rule.
Location & tenants
- Location reads 61/100 on livability (#335 in MD) — a middle-class / working-renter tenant base. Strengths: crime A+, employment A+, housing A+; Watch: schools F, amenities F, commute F.
- Frederick County Public Schools (other): math 27% / reading 43% proficiency, ranked #4 of 24 in MD (top 17%) — families likely to look elsewhere, expect single-tenant / working-renter base with shorter leases.
- Market conditions: Rents rising (+2.5%/yr); 85 active listings in the ZIP; high-income renter base; 1,562 units permitted in Frederick County in 2024 (374 in 5+ unit buildings).
Forward outlook
- Local home prices are declining (-3.0%/yr); year-one equity from $2k of loan paydown is wiped out by about $9k of value loss. Plan a longer hold.
- Frederick County population projected at +15% by 2050 — long-run rental-demand tailwind backs the buy-and-hold thesis.
Negotiation context
- Only 5 days on market — expect competitive offers; lowballing is unlikely to land.
- 2 sale attempts; this cycle's ask has dropped $45k (13%) from the opening price — seller is motivated, your offer sets the floor, not the list.
- Current owner paid $68k; list at $290k implies a 326% gain — meaningful room to come down on a strong offer.
Risks & watch-outs
- Watch-outs: built in 1950 — expect roof / HVAC / electrical / plumbing capex.
- Climate carrying-cost: extreme-heat days projected 7→16/yr by 2055 (HVAC capex compounding) — expect insurance premiums to compound above CPI over the hold.
Questions for the listing agent
- Built in 1950 — when were the roof, HVAC, electrical panel, plumbing, and water heater last replaced?
- Is there a deadline driving the sale (1031 exchange, divorce, estate, relocation)? That informs how much negotiation room exists.
- Schools are F-rated, which usually means shorter tenancies and higher turnover. Who's the typical renter profile here, and what's been the actual vacancy rate?
- What's the average days-on-market for RENTAL listings here right now (not sales)? A rising rental-DOM trend means longer vacancies and softer asking-rent achievability than the comps imply.
- What's the recent tenant-quality profile in this submarket — average credit score on applications, eviction rate, late-payment / NSF rate, and stable-employment percentage? A property-management company in the area should have these aggregated.
- How much new for-sale + rental construction is in the pipeline within 1–3 miles? Heavy new supply typically softens prices + rents 12–24 months out; constrained supply supports both.
Investment metrics
- 1% rule
- 0.95% ✗
- Cap rate
- 7.62%
- Cash-on-cash
- 4.75%
- DSCR
- 1.21
- GRM
- 8.7
CMA / ARV
- ARV (on-the-fly)
- $300,150
- Comps found
- 1
Show comp detail 1 sale within ~0.75 mi
| Address | Dist | Beds/Ba | Sqft | Sold | Price | $/sf | Match |
|---|---|---|---|---|---|---|---|
| 5618 Bartonsville Rd | 0.00mi | 4/1.5 | 690 (0%) | 1mo | $300,000 | $435 | 97 |
Match score weights: distance 35% · size 25% · config 20% · recency 20%. Top-matched comps best support the ARV.
Projected returns pro-forma
-3.0% appreciation · 2.48% rent growth · sell at horizon
- IRR
- -9.5%
- Equity multiple
- 0.66×
- Total profit
- $-27,977
- Equity at exit
- $43,225
- IRR
- -0.7%
- Equity multiple
- 0.95×
- Total profit
- $-4,013
- Equity at exit
- $25,065
Cash invested: $81,172 (down + closing). Projections, not guarantees.
Landlord ↔ Tenant lean methodology
- Overall (STATE)
- 27 Tenant-Leaning
- State Maryland
- 27 Tenant-Leaning · D+14
- County
- — inherits STATE
- City
- — inherits STATE
ZIP-level market 21704
- Home prices YoY
- -22.9%
- Rents YoY
- 2.5%
- Active inventory
- 85
- Price-to-rent
- 8.7×
Monthly cashflow live
- Estimated rent
- $2,768 medium interval (Pro) →
- Mortgage (P&I)
- −$1,520
- Tax from tax record
- −$224 /mo · $2,685/yr
- Insurance
- −$121
- HOA
- −$0
- Vacancy / Maint / Mgmt
- −$581
- Net cashflow
- $322
Break-even live
Sensitivity live
| Price | -10% $486 | -5% $404 | +0% $322 | +5% $240 | +10% $157 |
|---|---|---|---|---|---|
| Rent | -10% $103 | -5% $212 | +0% $322 | +5% $431 | +10% $540 |
| Rate | -1.0pp $468 | -0.5pp $395 | base $322 | +0.5pp $246 | +1.0pp $170 |
UW: 25.0% down · 7.5% · 30yr · 1.5% tax · 5.0% vac · 8.0% maint · 8.0% mgmt
Financing live
Cash to close
- Down payment
- $72,475
- Closing costs
- $8,697
- Reserves months
- —
- Total cash needed
- —
Loan-product check · same deal, 3 products live
Conventional
25% down · 7.5% · 30yr
- Down + closing
- —
- Monthly P&I
- —
- Monthly cashflow
- —
- DSCR
- —
- Eligible?
- —
Personal DTI + credit; lowest rate.
DSCR
20% down · 8.5% · 30yr
- Down + closing
- —
- Monthly P&I
- —
- Monthly cashflow
- —
- DSCR
- —
- Eligible?
- —
No personal income docs; deal must DSCR.
Hard money
10% down · 12.0% · 12mo
- Down + closing
- —
- Monthly P&I
- —
- Monthly cashflow
- —
- DSCR
- —
- Eligible?
- —
Short-term bridge; refi at stabilization.
Listing history 7 events
-
2026-03-26status Pending
-
2026-03-24price $289,900
-
2026-03-24status Active
-
2026-03-17status Pending
-
2026-03-16historical
-
2026-03-13$335,000 Active
-
1993-12-16soldstatus $68,000
ⓘ Source: listings_history table (triggers on properties + properties_extension) + one-shot
backfill from property_details.listing_events for pre-trigger history.
Tax reassessment forecast MD · Partial reset (capped growth)
- Current annual tax
- $2,685 · $224/mo
- Projected year-2 tax
- $2,923 · $244/mo
- Expected delta
- +$237/yr (+$20/mo · 8.8%)
ⓘ Screening estimate from a state-policy table — verify with the county assessor before closing.
Climate risk First Street
- Flood 1/10 Low FEMA zone X (unshaded) · 0% chance over 30 yrs
- Wildfire 2/10 Low
- Heat 6/10 Major 7 d/yr ≥103°F today · 16 d/yr by 30 yrs out
- Wind 3/10 Moderate 7% chance of damaging wind over 30 yrs
- Air quality 2/10 Low 1 unhealthy d/yr today · 1 by 30 yrs out
Nearby sold comps map
Loading sold comps map…
Walkable amenities ~0.75 mi
Loading nearby amenities…
Taxation est. · year 1
- Rental income
- $33,212
- − Mortgage interest
- −$16,239
- − Property taxes
- −$2,685
- − Insurance
- −$1,450
- − Repairs & maintenance
- −$2,657
- − Management
- −$2,657
- − Depreciation
- −$8,433
- Taxable loss
- −$909
- Est. tax savings @ 24.0%
- +$218
- After-tax cash flow
- $4,077/yr
For passive investors: Depreciation is non-cash, so a rental often shows a tax loss while cash-flowing — sheltering income. Rental losses are passive: they offset passive income freely, and up to $25,000/yr can offset ordinary (W-2) income if you actively participate and your MAGI is under $100k (phasing out to $0 by $150k); unused losses carry forward. On sale, claimed depreciation is recaptured at up to 25%, and gains may owe capital-gains tax (a 1031 exchange can defer both). Figures are a year-1 estimate at your 24.0% rate — not tax advice; consult a CPA.
Schools (NCES district)
- District
- Frederick County Public Schools
- NCES district ID
- 2400330
- Math proficiency
- 27% ▼ -23.00%
- Reading proficiency
- 43% ▼ -15.00%
- Median HH income
- $84,020
- Composite
- 33.54/100
- National rank
- #5429
- State rank
- #4 of 24 in MD
Livability — Bartonsville
- Score
- 61/100
- State rank
- #335
- US rank
- #17782
Category grades
Schools grade is shown separately in the Schools card above.
Census & demographics
- Census place
- Bartonsville, MD
- County
- Frederick County · 171,753 people
- Metro
- Washington-Arlington-Alexandria, DC-VA-MD-WV
- Population (ZIP)
- 20,006
- Household income
- $161,063
- Rent vs Own
- Severe rent burden
- 81.0
Population outlook (Frederick County) Hauer SSP2
- Today (2025)
- 269,438 people
- By 2030
- 280,160 · +4.0%
- By 2040
- 298,408 · +10.8%
- By 2050
- 311,062 · +15.4%
- By 2075
- 342,819 · +27.2%
- By 2100
- 351,361 · +30.4%
Race, ethnicity, and origin ACS 2023
- Neighborhood character
- Diverse neighborhood (Simpson 0.67)
- Race & ethnicity
- White 52% Asian 17% Two or more races 14% Hispanic / Latino 13% Black 12%
- Hispanic origin (detail)
- Mexican 1%
- Common ancestry
- Lithuanian 2% Romanian 2% Slovak 2%
- Foreign-born
- 21% · Canada, China, South Korea
- Languages at home
- 70% English-only · Spanish 9% Other Indo-European 6% Other Asian/Pacific 4%
Political lean MEDSL · Frederick
- 2024 margin
- Lean D (+8.8) · D 53.2% · R 44.4% · Other 2.5%
- 2008→2024 swing
- +9.9pp toward D · 2008: -1.0pp · 2024: 8.8pp
- All cycles
- 2024: D+8.8 2020: D+9.6 2016: R+4.0 2012: R+3.9 2008: R+1.0
Not yet ingested
- Civics
- —
Market trends
- HPI YoY
- ▼ -78.95%
- Current HPI
- 265.6266
- Rent YoY
- ▲ 2.48%
- Metro
- Washington-Arlington-Alexandria, DC-VA-MD-WV
- State GDP YoY
- ▲ 2.97%
- F500 in state
- 12
Industry mix (Fortune 500 HQ in MD)
| Industry | F500 HQs | Revenue |
|---|---|---|
| Aerospace / Defense | 1 | $71B |
|
||
| Utilities | 1 | $25B |
|
||
| Hotels | 1 | $24B |
|
||
| Consumer Goods | 1 | $7B |
|
||
| Real Estate | 1 | $6B |
|
||
| Chemicals | 1 | $2B |
|
||
Price history
+326.3% since first listed7 events — show timeline
- 2026-03-26 Pending — BRIGHT MLS
- 2026-03-24 Price Changed $289,900 BRIGHT MLS
- 2026-03-24 Relisted — BRIGHT MLS
- 2026-03-17 Pending — BRIGHT MLS
- 2026-03-16 Listing Removed — BRIGHT MLS
- 2026-03-13 Listed $335,000 BRIGHT MLS
- 1993-12-16 Sold (Public Records) $68,000 Public Records
Property tax history
+1.7%/yrLatest (2025): $2,685 · +4.7% YoY. Source: county tax records.
Cash-flow waterfall
monthlySold comps — $/sqft
last 12 mo · ≤1 miLoading sold comps…