1430 Powell Grove Rd · Lebanon, TN
Flood risk 1/10 · Minimal
- FEMA flood zone
- X (unshaded)
- Chance of flooding over 30 yrs
- 0.0%
- Est. flood insurance / yr
- $507 – $1,088
Fire risk 3/10 · Minor
- Est. fire insurance / yr
- $949 – $1,763
Heat risk 6/10 · Moderate
- Hot days now (above 106°F)
- 7 days/yr
- Hot days in 30 yrs
- 20 days/yr
Wind risk 4/10 · Minor
- Chance of severe wind over 30 yrs
- 9.0%
Air-quality risk 3/10 · Minor
- Unhealthy air days now
- 2 days/yr
- Unhealthy air days in 30 yrs
- 5 days/yr
Risk factors via First Street. Map © Google.
Why this score? — see what drove the D grade
The composite is a weighted blend of 9 inputs, each scored 0–100. Each bar is that input's sub-score; the figure is the points it added to the 100-point composite (weight × sub-score).
- Cash flow +15.7/30.0
- ARV discount +7.5/15.0
- DSCR +4.8/10.0
- Schools +3.8/10.0
- Livability +3.5/5.0
- 1% rule +3.0/10.0
- Condition / age +2.5/5.0
- Rent growth +2.4/5.0
- Appreciation +0.0/10.0
$275,000
🖨 Deal sheet (PDF) 📄 Offer letter ✓ Due diligence
Listing remarks MLS
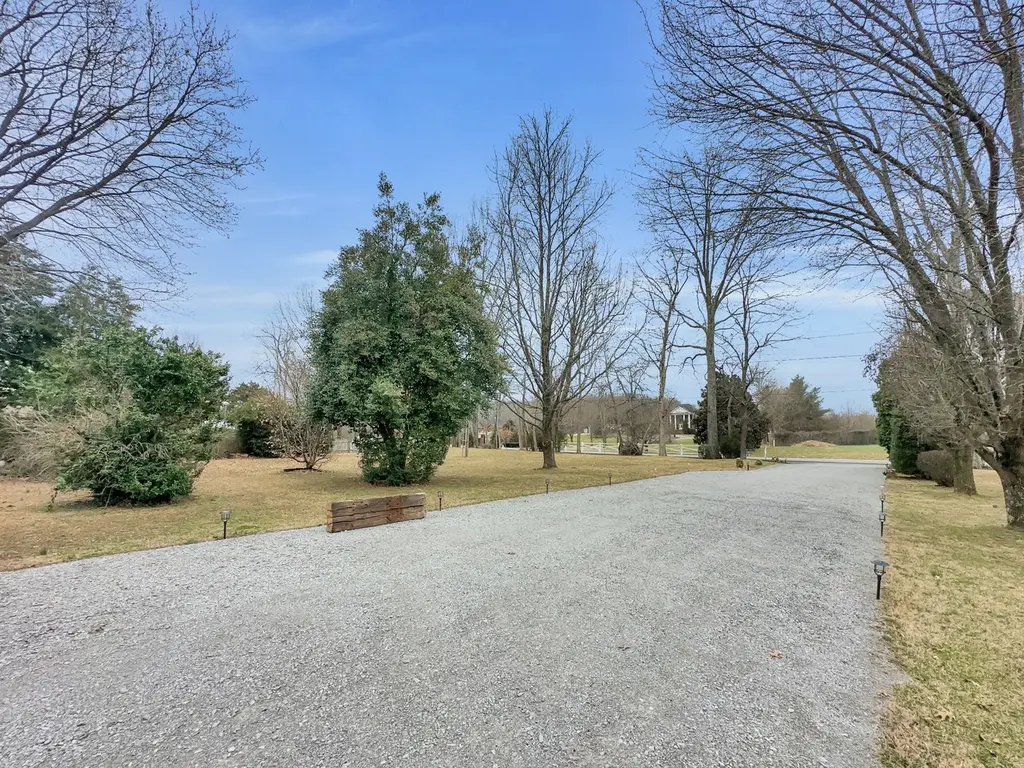
PREMIUM BUILDING LOT JUST OFF THE HWY 109 CORRIDOR - An exceptional opportunity to secure a 1.23± acre private building site in one of Lebanon’s most strategic and rapidly growing corridors. Located along Powell Grove Road just off Highway 109, this property offers a rare balance of quiet surroundings and high-connectivity access, making it ideal for a custom single-family residence or income-producing three-bedroom home. The level lot is partially wooded with mature trees providing natural privacy and an estate-style setting while still benefiting from immediate access to major infrastructure. Utilities are already in place, significantly reducing upfront development costs and allowing for an efficient build timeline. The site configuration supports a three-bedroom home footprint, creating flexibility for owner-occupants, long-term rental strategies, or future resale in a high-demand market. Location is a key driver of value. The property is approximately 3.7 miles from I-40, offering convenient access to Nashville and surrounding employment centers, and just 16 miles to Nashville International Airport (BNA). Continued commercial, industrial, and residential growth along the Highway 109 corridor further enhances long-term appreciation and investment potential. A detached log-style structure on the property provides added versatility and may be utilized as a workshop, storage building, studio, or future accessory improvement without impacting the primary homesite. Existing mobile home conveys no value and will be removed from the property after closing, providing a clear, build-ready homesite for the buyer’s new construction. Cash or conventional only. Schedule your private showing today before someone else does.
Key facts
- Build-ready homesite
- Natural privacy
- Utilities in place
Tags
Neighborhood map
What this means for you Summary
Snapshot
- This is a 3-bed/2.0-bath other listed at $275k.
Deal economics
- At list price, monthly cash flow is $121 ($1k/yr) — positive.
- The deal already cash-flows at list — no discount required.
- To meet the 1% rule (rent ≥ 1% of price), the offer needs to be $221k (19.8% below list).
- Recommended offer: $221k (19.8% below list) — sets the bar for 1% rule.
- Cap rate 6.8% vs local median 2.9% in Lebanon — top-decile yield for the area; either an underpriced asset or a hidden risk that comps aren't pricing in. Stress-test before assuming the spread holds.
Location & tenants
- Location reads 70/100 on livability (#49 in TN) — a middle-class / working-renter tenant base. Strengths: housing A+, health & safety A, cost of living A-; Watch: amenities F, commute F.
- Wilson County (rural): math 42% / reading 43% proficiency, ranked #10 of 139 in TN (top 7%) — families likely to look elsewhere, expect single-tenant / working-renter base with shorter leases.
- Zoned schools: Southside Elementary (math 28% / reading 26%, grade F, #496 of 952 statewide, top 55%, 691 students, 0% FRL); Wilson Central High School (math 14% / reading 53%, grade F, #52 of 332 statewide, top 16%, 1,582 students, 0% FRL) — zoned schools average 0% FRL vs 25% district-wide (25 pts lower); this property's tenant base skews higher-income than the district average.
- Zoned-school proficiency averages 30% at this address vs 42% district-wide (-12 pts) — the specific schools serving this property underperform the Wilson County average; the district grade overstates school quality for this exact location.
- Market conditions: Rents soft (-0.3%/yr); 319 active listings in the ZIP; 2 comparable units currently listed for rent nearby; solid renter incomes; 1,927 units permitted in Wilson County in 2024 (10 in 5+ unit buildings).
- This rent runs 31% of the median local income ($84k/yr) — at the standard rent-burdened threshold; future hikes will face affordability resistance.
Forward outlook
- Local home prices are declining (-3.0%/yr); year-one equity from $2k of loan paydown is wiped out by about $8k of value loss. Plan a longer hold.
- Wilson County population projected at +47% by 2050 — long-run rental-demand tailwind backs the buy-and-hold thesis.
Negotiation context
- It's been on market 139 days — a 12% lower offer ($242k) is reasonable based on typical stale-listing flexibility.
- 5 sale attempts since 15y ago with the ask held roughly flat each time — persistent listings suggest the price (not the market) is what's stuck; bring a comps-based counter.
- Current owner paid $54k; list at $275k implies a 414% gain — meaningful room to come down on a strong offer.
Risks & watch-outs
- Climate carrying-cost: extreme-heat days projected 7→20/yr by 2055 (HVAC capex compounding) — expect insurance premiums to compound above CPI over the hold.
Questions for the listing agent
- It's been on market 139 days. Have you received any prior offers? Is the seller open to a 20% concession, seller financing, or rate buy-down credit?
- Why hasn't it sold? Are there any deal-killer items the seller is aware of (foundation, flood, title, zoning, code violations)?
- Is there a deadline driving the sale (1031 exchange, divorce, estate, relocation)? That informs how much negotiation room exists.
- Schools are D-rated, which usually means shorter tenancies and higher turnover. Who's the typical renter profile here, and what's been the actual vacancy rate?
- The area grade is low — what's the realistic commute time and amenity access for the typical tenant pool here? Any planned neighborhood developments (good or bad) we should know about?
- What's the average days-on-market for RENTAL listings here right now (not sales)? A rising rental-DOM trend means longer vacancies and softer asking-rent achievability than the comps imply.
- What's the recent tenant-quality profile in this submarket — average credit score on applications, eviction rate, late-payment / NSF rate, and stable-employment percentage? A property-management company in the area should have these aggregated.
- How much new for-sale + rental construction is in the pipeline within 1–3 miles? Heavy new supply typically softens prices + rents 12–24 months out; constrained supply supports both.
Investment metrics
- 1% rule
- 0.80% ✗
- Cap rate
- 6.82%
- Cash-on-cash
- 1.89%
- DSCR
- 1.08
- GRM
- 10.4
CMA / ARV
No comps found within radius.
Projected returns pro-forma
-3.0% appreciation · 0.0% rent growth · sell at horizon
- IRR
- -16.3%
- Equity multiple
- 0.44×
- Total profit
- $-43,457
- Equity at exit
- $41,003
- IRR
- -13.5%
- Equity multiple
- 0.31×
- Total profit
- $-53,463
- Equity at exit
- $23,777
Cash invested: $77,000 (down + closing). Projections, not guarantees.
Landlord ↔ Tenant lean methodology
- Overall (STATE)
- 87 Strongly Landlord-Friendly
- State Tennessee
- 87 Strongly Landlord-Friendly · R+13
- County
- — inherits STATE
- City
- — inherits STATE
ZIP-level market 37090
- Home prices YoY
- -19.0%
- Rents YoY
- -0.3%
- Active inventory
- 319
- Price-to-rent
- 10.4×
Monthly cashflow live
- Estimated rent
- $2,206 medium interval (Pro) →
- Mortgage (P&I)
- −$1,442
- Tax from tax record
- −$65 /mo · $783/yr
- Insurance
- −$115
- HOA
- −$0
- Vacancy / Maint / Mgmt
- −$463
- Net cashflow
- $121
Break-even live
Sensitivity live
| Price | -10% $277 | -5% $199 | +0% $121 | +5% $43 | +10% $-35 |
|---|---|---|---|---|---|
| Rent | -10% $-53 | -5% $34 | +0% $121 | +5% $208 | +10% $295 |
| Rate | -1.0pp $260 | -0.5pp $191 | base $121 | +0.5pp $50 | +1.0pp $-23 |
UW: 25.0% down · 7.5% · 30yr · 1.5% tax · 5.0% vac · 8.0% maint · 8.0% mgmt
Financing live
Cash to close
- Down payment
- $68,750
- Closing costs
- $8,250
- Reserves months
- —
- Total cash needed
- —
Loan-product check · same deal, 3 products live
Conventional
25% down · 7.5% · 30yr
- Down + closing
- —
- Monthly P&I
- —
- Monthly cashflow
- —
- DSCR
- —
- Eligible?
- —
Personal DTI + credit; lowest rate.
DSCR
20% down · 8.5% · 30yr
- Down + closing
- —
- Monthly P&I
- —
- Monthly cashflow
- —
- DSCR
- —
- Eligible?
- —
No personal income docs; deal must DSCR.
Hard money
10% down · 12.0% · 12mo
- Down + closing
- —
- Monthly P&I
- —
- Monthly cashflow
- —
- DSCR
- —
- Eligible?
- —
Short-term bridge; refi at stabilization.
Rent comps 2 comps
| Address | Beds | Baths | Sqft | Rent | $/sqft | DOM | Units | Dist |
|---|---|---|---|---|---|---|---|---|
| 2645 Highway 109 N Lebanon, TN | 1.0–3.0 | 1.0–2.0 | 1181 | $2,185 | $1.85 | 4d | 23 | 0.65mi |
| 550 Old Laguardo Rd W Mt. Juliet, TN | 1.0–3.0 | 1.0–2.0 | 1126 | $2,530 | $2.25 | 4d | 19 | 1.00mi |
Listing history 18 events
-
2026-06-07days on market $275,000 Active 139 DOM
-
2026-06-02days on market $275,000 Active 134 DOM
-
2026-06-01days on market $275,000 Active 133 DOM
-
2026-05-31days on market $275,000 Active 132 DOM
-
2026-01-19$275,000 Active 1761-char remark
Show marketing remark (1761 chars)
PREMIUM BUILDING LOT JUST OFF THE HWY 109 CORRIDOR - An exceptional opportunity to secure a 1.23± acre private building site in one of Lebanon’s most strategic and rapidly growing corridors. Located along Powell Grove Road just off Highway 109, this property offers a rare balance of quiet surroundings and high-connectivity access, making it ideal for a custom single-family residence or income-producing three-bedroom home. The level lot is partially wooded with mature trees providing natural privacy and an estate-style setting while still benefiting from immediate access to major infrastructure. Utilities are already in place, significantly reducing upfront development costs and allowing for an efficient build timeline. The site configuration supports a three-bedroom home footprint, creating flexibility for owner-occupants, long-term rental strategies, or future resale in a high-demand market. Location is a key driver of value. The property is approximately 3.7 miles from I-40, offering convenient access to Nashville and surrounding employment centers, and just 16 miles to Nashville International Airport (BNA). Continued commercial, industrial, and residential growth along the Highway 109 corridor further enhances long-term appreciation and investment potential. A detached log-style structure on the property provides added versatility and may be utilized as a workshop, storage building, studio, or future accessory improvement without impacting the primary homesite. Existing mobile home conveys no value and will be removed from the property after closing, providing a clear, build-ready homesite for the buyer’s new construction. Cash or conventional only. Schedule your private showing today before someone else does.
-
2025-04-11historical
-
2025-04-11historical
-
2025-02-22$279,000 Active
-
2025-02-10$279,000 Active
-
2025-02-09historical
-
2023-12-31historical
-
2023-12-30historical
-
2023-11-22$238,000 Active
-
2023-11-17historical
-
2012-09-24soldstatus $53,500
-
2012-09-21historical
-
2012-09-21soldstatus $53,500
-
2011-12-11$66,000
ⓘ Source: listings_history table (triggers on properties + properties_extension) + one-shot
backfill from property_details.listing_events for pre-trigger history.
Tax reassessment forecast TN · Resets to sale price
- Current annual tax
- $783 · $65/mo
- Projected year-2 tax
- $1,952 · $163/mo
- Expected delta
- +$1,170/yr (+$97/mo · 149.4%)
ⓘ Screening estimate from a state-policy table — verify with the county assessor before closing.
Climate risk First Street
- Flood 1/10 Low FEMA zone X (unshaded) · 0% chance over 30 yrs
- Wildfire 3/10 Moderate
- Heat 6/10 Major 7 d/yr ≥106°F today · 20 d/yr by 30 yrs out
- Wind 4/10 Moderate 9% chance of damaging wind over 30 yrs
- Air quality 3/10 Moderate 2 unhealthy d/yr today · 5 by 30 yrs out
Nearby sold comps map
Loading sold comps map…
Walkable amenities ~0.75 mi
Loading nearby amenities…
Taxation est. · year 1
- Rental income
- $26,476
- − Mortgage interest
- −$15,404
- − Property taxes
- −$783
- − Insurance
- −$1,375
- − Repairs & maintenance
- −$2,118
- − Management
- −$2,118
- − Depreciation
- −$8,000
- Taxable loss
- −$3,322
- Est. tax savings @ 24.0%
- +$797
- After-tax cash flow
- $2,250/yr
For passive investors: Depreciation is non-cash, so a rental often shows a tax loss while cash-flowing — sheltering income. Rental losses are passive: they offset passive income freely, and up to $25,000/yr can offset ordinary (W-2) income if you actively participate and your MAGI is under $100k (phasing out to $0 by $150k); unused losses carry forward. On sale, claimed depreciation is recaptured at up to 25%, and gains may owe capital-gains tax (a 1031 exchange can defer both). Figures are a year-1 estimate at your 24.0% rate — not tax advice; consult a CPA.
Schools (NCES district)
- District
- Wilson County
- NCES district ID
- 4704550
- Math proficiency
- 42% ▼ -11.00%
- Reading proficiency
- 43% ▼ -4.00%
- Median HH income
- $68,429
- Composite
- 38.33/100
- National rank
- #4225
- State rank
- #10 of 139 in TN
Livability — Lebanon
- Score
- 70/100
- State rank
- #49
- US rank
- #7389
Category grades
Schools grade is shown separately in the Schools card above.
Census & demographics
- County
- Wilson County · 144,921 people
- City population
- 76,429
- Metro
- Nashville-Davidson--Murfreesboro--Franklin, TN
- Population (ZIP)
- 19,774
- Household income
- $84,299
- Rent vs Own
- Severe rent burden
- 227.0
Population outlook (Wilson County) Hauer SSP2
- Today (2025)
- 160,409 people
- By 2030
- 176,099 · +9.8%
- By 2040
- 206,769 · +28.9%
- By 2050
- 235,383 · +46.7%
- By 2075
- 302,144 · +88.4%
- By 2100
- 343,710 · +114.3%
Race, ethnicity, and origin ACS 2023
- Neighborhood character
- Predominantly White (84%)
- Race & ethnicity
- White 84% Hispanic / Latino 7% Two or more races 6% Black 5%
- Hispanic origin (detail)
- Mexican 4%
- Common ancestry
- Serbian 3% Italian 2% Lithuanian 2%
- Foreign-born
- 5% · Canada
- Languages at home
- 94% English-only · Spanish 5%
Political lean MEDSL · Wilson
- 2024 margin
- Solid R (+40.1) · D 29.4% · R 69.4% · Other 1.2%
- 2008→2024 swing
- -3.5pp toward R · 2008: -36.6pp · 2024: -40.1pp
- All cycles
- 2024: R+40.1 2020: R+37.7 2016: R+44.3 2012: R+41.6 2008: R+36.6
Not yet ingested
- Civics
- —
Market trends
- HPI YoY
- ▼ -79.98%
- Current HPI
- 341.0402
- Rent YoY
- ▼ -0.26%
- Metro
- Nashville-Davidson--Murfreesboro--Franklin, TN
- State GDP YoY
- ▲ 2.78%
- F500 in state
- 22
Industry mix (Fortune 500 HQ in TN)
| Industry | F500 HQs | Revenue |
|---|---|---|
| Healthcare | 3 | $91B |
|
||
| Retail | 3 | $72B |
|
||
| Transportation / Logistics | 1 | $88B |
|
||
| Paper / Packaging | 1 | $19B |
|
||
| Insurance | 1 | $13B |
|
||
| Energy | 1 | $12B |
|
||
Price history
+316.7% since first listed14 events — show timeline
- 2026-01-19 Listed $275,000 REALTRACS as Distributed by MLS Grid
- 2025-04-11 Listing Removed — REALTRACS as Distributed by MLS Grid
- 2025-04-11 Listing Removed — REALTRACS as Distributed by MLS Grid
- 2025-02-22 Listed $279,000 REALTRACS as Distributed by MLS Grid
- 2025-02-10 Listed $279,000 REALTRACS as Distributed by MLS Grid
- 2025-02-09 Coming Soon — REALTRACS as Distributed by MLS Grid
- 2023-12-31 Listing Removed — REALTRACS as Distributed by MLS Grid
- 2023-12-30 Listing Removed — REALTRACS as Distributed by MLS Grid
- 2023-11-22 Listed $238,000 REALTRACS as Distributed by MLS Grid
- 2023-11-17 Coming Soon — REALTRACS as Distributed by MLS Grid
- 2012-09-24 Sold (Public Records) $53,500 Public Records
- 2012-09-21 Listing Removed — REALTRACS as Distributed by MLS Grid
- 2012-09-21 Sold (MLS) $53,500 REALTRACS as Distributed by MLS Grid
- 2011-12-11 Listed $66,000 REALTRACS as Distributed by MLS Grid
Property tax history
+6.5%/yrLatest (2025): $783 · +0.0% YoY. Source: county tax records.
Cash-flow waterfall
monthlySold comps — $/sqft
last 12 mo · ≤1 miLoading sold comps…