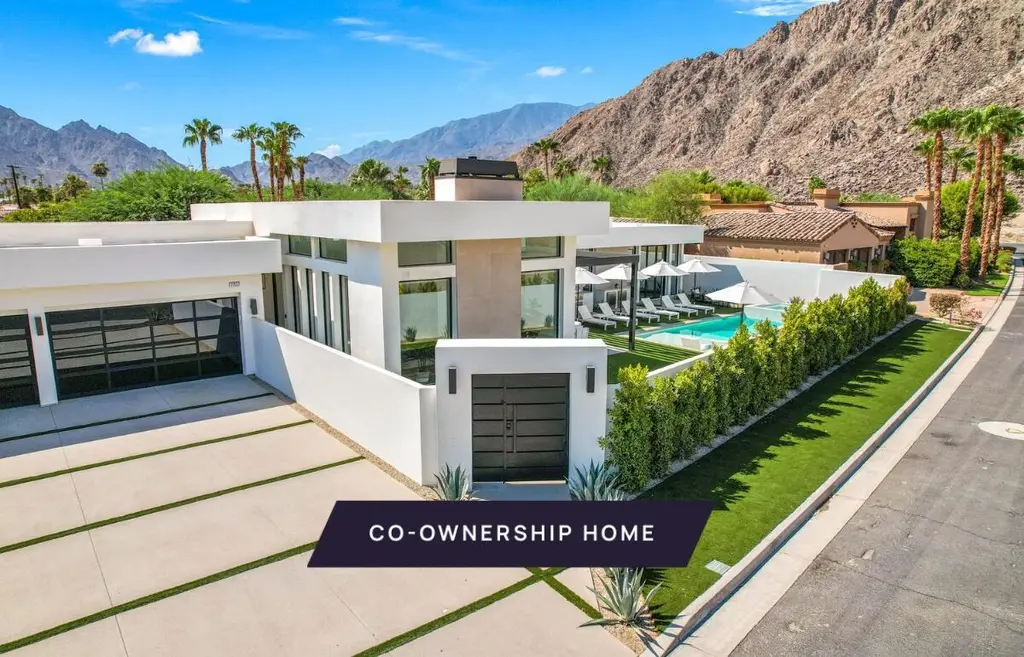
77137 Casa Del Sol Unit B · La Quinta, CA
Flood risk 1/10 · Minimal
- FEMA flood zone
- X
- Chance of flooding over 30 yrs
- 0.0%
- Est. flood insurance / yr
- $507 – $1,088
Fire risk 6/10 · Moderate
- Est. fire insurance / yr
- $659 – $1,223
Heat risk 10/10 · Severe
- Hot days now (above 113°F)
- 8 days/yr
- Hot days in 30 yrs
- 23 days/yr
Wind risk 1/10 · Minimal
- Chance of severe wind over 30 yrs
- —
Air-quality risk 4/10 · Minor
- Unhealthy air days now
- 4 days/yr
- Unhealthy air days in 30 yrs
- 5 days/yr
Risk factors via First Street. Map © Google.
Why this score? — see what drove the C grade
The composite is a weighted blend of 9 inputs, each scored 0–100. Each bar is that input's sub-score; the figure is the points it added to the 100-point composite (weight × sub-score).
- Cash flow +23.7/30.0
- DSCR +7.6/10.0
- 1% rule +6.2/10.0
- Condition / age +4.8/5.0
- Rent growth +4.1/5.0
- Schools +3.8/10.0
- ARV discount +3.6/15.0
- Livability +2.9/5.0
- Appreciation +0.0/10.0
$435,000
🖨 Deal sheet 📄 Offer letter ✓ Due diligence
Listing remarks MLS
New co-ownership opportunity: Own one-eighth of this professionally managed, turnkey home. Nestled in the mountains within the private enclave of Flores Montanas, this modern new-construction residence offers a walled courtyard that enhances privacy. Each of the four bedrooms includes its own en suite bathroom for comfort and convenience. Enter through the gate to find two in-ground fire features set in a low-maintenance turf lawn, surrounded by thoughtfully designed landscaping. The custom glass front door opens to an airy, open-plan living space with 14-foot ceilings, plank tile floors, Cambria quartz counters, gold-toned fixtures, and custom lighting. Multiple La Cantina pocket doors create a seamless indoor/outdoor flow. The zero-edge pool with custom tile work and large Baja shelf provides an inviting space to take in the mountain views. Two BBQ counters and a fire pit are positioned just outside the primary bedroom. The primary suite includes a dressing area and soaking tub. Additional highlights include a flexible workspace/media station in the hall, a butler's pantry/laundry area with barn door, a coffee bar, and floating shelves. The home comes fully furnished and professionally decorated.
Key facts
- Walled courtyard
- 14-foot ceilings
- 0.28 acre lot
Tags
Neighborhood map
What this means for you Summary
Snapshot
- This is a 4-bed/4.5-bath other listed at $435k. Condition is rated excellent.
Deal economics
- At list price, monthly cash flow is $827 ($10k/yr) — positive.
- The deal already cash-flows at list — no discount required.
- Meets the 1% rule at list price ($5k rent vs $435k).
- Recommended offer: $422k (3.0% below list) — sets the bar for market timing.
- Cap rate 8.6% vs local median 3.3% in La Quinta — top-decile yield for the area; either an underpriced asset or a hidden risk that comps aren't pricing in. Stress-test before assuming the spread holds.
Location & tenants
- Location reads 58/100 on livability (#694 in CA) — a working-class tenant base; expect higher turnover. Strengths: commute A-, employment B+, housing B+; Watch: schools D, amenities F, cost of living F.
- Desert Sands Unified (suburban): math 31% / reading 56% proficiency, ranked #199 of 517 in CA (top 38%) — families likely to look elsewhere, expect single-tenant / working-renter base with shorter leases.
- Market conditions: Rents rising fast (+6.5%/yr); 656 active listings in the ZIP; 9 comparable units currently listed for rent nearby; rentals lingering (median 44d on market — plan ~5-8 weeks vacancy on turnover, expect pricing pressure); 67% of comp listings sitting > 30 days — soft ceiling on asking rent; solid renter incomes; 9,195 units permitted in Riverside County in 2024 (1,512 in 5+ unit buildings).
- At $4,852/mo this rent would consume 59% of the median local household income ($99k/yr) (locally 1078% of renters already pay >50% of income on rent) — very limited rent-growth headroom before tenants either downsize or default.
Forward outlook
- Local home prices are declining (-3.0%/yr); year-one equity from $3k of loan paydown is wiped out by about $13k of value loss. Plan a longer hold.
- Riverside County population projected at +22% by 2050 — long-run rental-demand tailwind backs the buy-and-hold thesis.
- At projected returns (-3.0% appreciation + 6.5% rent growth), your $122k cash investment doubles in ~9 years — after that, you're playing with house money.
Negotiation context
- It's been on market 56 days — a 3% lower offer ($422k) is reasonable based on typical stale-listing flexibility.
Risks & watch-outs
- Climate carrying-cost: major wildfire risk; extreme-heat days projected 8→23/yr by 2055 (HVAC capex compounding) — expect insurance premiums to compound above CPI over the hold.
Questions for the listing agent
- It's been on market 56 days. Have you received any prior offers? Is the seller open to a 3% concession, seller financing, or rate buy-down credit?
- Is there a deadline driving the sale (1031 exchange, divorce, estate, relocation)? That informs how much negotiation room exists.
- Schools are D-rated, which usually means shorter tenancies and higher turnover. Who's the typical renter profile here, and what's been the actual vacancy rate?
- What's the average days-on-market for RENTAL listings here right now (not sales)? A rising rental-DOM trend means longer vacancies and softer asking-rent achievability than the comps imply.
- What's the recent tenant-quality profile in this submarket — average credit score on applications, eviction rate, late-payment / NSF rate, and stable-employment percentage? A property-management company in the area should have these aggregated.
- How much new for-sale + rental construction is in the pipeline within 1–3 miles? Heavy new supply typically softens prices + rents 12–24 months out; constrained supply supports both.
Investment metrics
- 1% rule
- 1.12% ✓
- Cap rate
- 8.57%
- Cash-on-cash
- 8.14%
- DSCR
- 1.36
- GRM
- 7.5
CMA / ARV
- ARV (median comp)
- $400,000
- List price
- $435,000
- Delta
- 8.75%
- Verdict
- FAIR
- Comps
- 1 within 2.0 mi
Show comp detail 1 sale within ~0.75 mi
| Address | Dist | Beds/Ba | Sqft | Sold | Price | $/sf | Match |
|---|---|---|---|---|---|---|---|
| 77137 Casa Del Sol | 0.00mi | 4/4.0 | 3,240 (0%) | 4mo | $400,000 | $123 | 94 |
Match score weights: distance 35% · size 25% · config 20% · recency 20%. Top-matched comps best support the ARV.
Projected returns pro-forma
-3.0% appreciation · 6.45% rent growth · sell at horizon
- IRR
- -0.1%
- Equity multiple
- 1.00×
- Total profit
- $-346
- Equity at exit
- $64,860
- IRR
- 12.9%
- Equity multiple
- 2.19×
- Total profit
- $144,545
- Equity at exit
- $37,611
Cash invested: $121,800 (down + closing). Projections, not guarantees.
Landlord ↔ Tenant lean methodology
- Overall (STATE)
- 18 Strongly Tenant-Friendly
- State California
- 18 Strongly Tenant-Friendly · D+13
- County
- — inherits STATE
- City
- — inherits STATE
ZIP-level market 92253
- Rents YoY
- 6.5%
- Active inventory
- 656
- Price-to-rent
- 7.5×
Monthly cashflow live
- Estimated rent
- $4,852 medium interval (Pro) →
- Mortgage (P&I)
- −$2,281
- Tax est. 1.5%
- −$544 /mo · $6,525/yr
- Insurance
- −$181
- HOA
- −$0
- Vacancy / Maint / Mgmt
- −$1,019
- Net cashflow
- $827
Break-even live
UW: 25.0% down · 7.5% · 30yr · 1.5% tax · 5.0% vac · 8.0% maint · 8.0% mgmt
Financing live
Cash to close
- Down payment
- $108,750
- Closing costs
- $13,050
- Reserves months
- —
- Total cash needed
- —
Loan-product check · same deal, 3 products live
Conventional
25% down · 7.5% · 30yr
- Down + closing
- —
- Monthly P&I
- —
- Monthly cashflow
- —
- DSCR
- —
- Eligible?
- —
Personal DTI + credit; lowest rate.
DSCR
20% down · 8.5% · 30yr
- Down + closing
- —
- Monthly P&I
- —
- Monthly cashflow
- —
- DSCR
- —
- Eligible?
- —
No personal income docs; deal must DSCR.
Hard money
10% down · 12.0% · 12mo
- Down + closing
- —
- Monthly P&I
- —
- Monthly cashflow
- —
- DSCR
- —
- Eligible?
- —
Short-term bridge; refi at stabilization.
Rent comps 9 comps
| Address | Beds | Baths | Sqft | Rent | $/sqft | DOM | Units | Dist |
|---|---|---|---|---|---|---|---|---|
| 51116 Avenida Mendoza La Quinta, CA | 4.0 | 4.5 | 2239 | $25,000 | $11.17 | 43d | 1 | 0.80mi |
| 76900 Avenida Fernando La Quinta, CA | 4.0 | 4.5 | 3105 | $25,000 | $8.05 | 24d | 1 | 0.87mi |
| 76895 Avenida Fernando La Quinta, CA | 4.0 | 3.5 | 3508 | $25,000 | $7.13 | 43d | 1 | 0.89mi |
| 51120 Avenida Navarro La Quinta, CA | 4.0 | 4.5 | 2250 | $25,000 | $11.11 | 43d | 1 | 0.90mi |
| 77010 Avenida Fernando La Quinta, CA | 3.0 | 3.0 | 2885 | $7,500 | $2.60 | 43d | 1 | 0.99mi |
| 53725 Avenida Alvarado La Quinta, CA | 4.0 | 4.5 | 2798 | $6,435 | $2.30 | 18d | 1 | 1.05mi |
| 78174 Calle Norte La Quinta, CA | 3.0 | 3.0 | 2613 | $5,300 | $2.03 | 43d | 1 | 1.13mi |
| 49845 Lago Dr La Quinta, CA | 3.0 | 3.0 | 2332 | $10,000 | $4.29 | 24d | 1 | 1.21mi |
| 78328 Calle Las Ramblas La Quinta, CA | 3.0 | 3.0 | 2412 | $4,200 | $1.74 | 43d | 1 | 1.40mi |
Listing history 9 events
-
2026-06-09days on market $435,000 Active 56 DOM
-
2026-06-08days on market $435,000 Active 55 DOM
-
2026-06-07days on market $435,000 Active 54 DOM
-
2026-06-04days on market $435,000 Active 51 DOM
-
2026-06-03days on market $435,000 Active 50 DOM
-
2026-06-02days on market $435,000 Active 49 DOM
-
2026-06-01days on market $435,000 Active 48 DOM
-
2026-05-31days on market $435,000 Active 47 DOM
-
2026-04-14$435,000 Active 1217-char remark
Show marketing remark (1217 chars)
New co-ownership opportunity: Own one-eighth of this professionally managed, turnkey home. Nestled in the mountains within the private enclave of Flores Montanas, this modern new-construction residence offers a walled courtyard that enhances privacy. Each of the four bedrooms includes its own en suite bathroom for comfort and convenience. Enter through the gate to find two in-ground fire features set in a low-maintenance turf lawn, surrounded by thoughtfully designed landscaping. The custom glass front door opens to an airy, open-plan living space with 14-foot ceilings, plank tile floors, Cambria quartz counters, gold-toned fixtures, and custom lighting. Multiple La Cantina pocket doors create a seamless indoor/outdoor flow. The zero-edge pool with custom tile work and large Baja shelf provides an inviting space to take in the mountain views. Two BBQ counters and a fire pit are positioned just outside the primary bedroom. The primary suite includes a dressing area and soaking tub. Additional highlights include a flexible workspace/media station in the hall, a butler's pantry/laundry area with barn door, a coffee bar, and floating shelves. The home comes fully furnished and professionally decorated.
ⓘ Source: listings_history table (triggers on properties + properties_extension) + one-shot
backfill from property_details.listing_events for pre-trigger history.
Climate risk First Street
- Flood 1/10 Low FEMA zone X · 0% chance over 30 yrs
- Wildfire 6/10 Major
- Heat 10/10 Extreme 8 d/yr ≥113°F today · 23 d/yr by 30 yrs out
- Wind 1/10 Low
- Air quality 4/10 Moderate 4 unhealthy d/yr today · 5 by 30 yrs out
Nearby sold comps map
Loading sold comps map…
Walkable amenities ~0.75 mi
Loading nearby amenities…
Taxation est. · year 1
- Rental income
- $58,219
- − Mortgage interest
- −$24,367
- − Property taxes
- −$6,525
- − Insurance
- −$2,175
- − Repairs & maintenance
- −$4,658
- − Management
- −$4,658
- − Depreciation
- −$12,655
- Taxable income
- $3,183
- Est. tax owed @ 24.0%
- −$764
- After-tax cash flow
- $9,155/yr
For passive investors: Depreciation is non-cash, so a rental often shows a tax loss while cash-flowing — sheltering income. Rental losses are passive: they offset passive income freely, and up to $25,000/yr can offset ordinary (W-2) income if you actively participate and your MAGI is under $100k (phasing out to $0 by $150k); unused losses carry forward. On sale, claimed depreciation is recaptured at up to 25%, and gains may owe capital-gains tax (a 1031 exchange can defer both). Figures are a year-1 estimate at your 24.0% rate — not tax advice; consult a CPA.
Condition & rehab AI · 12 photos
This modern, co-ownership home in La Quinta, CA, offers a turnkey living experience with excellent condition and minimal maintenance needs. Potential buyers can focus on enjoying the property's amenities and location.
Value-add opportunities
- Both Landscaping improvements — Enhance curb appeal and increase property value
- Both Add smart home features — Improve convenience and attract tech-savvy buyers
- Both Install smart thermostat — Reduce energy costs and attract eco-conscious buyers
Renovation cost estimate screening
Value-add ROI direction
- Both Landscaping improvements — Enhance curb appeal and increase property value ↑
- Both Add smart home features — Improve convenience and attract tech-savvy buyers ↑
- Both Install smart thermostat — Reduce energy costs and attract eco-conscious buyers ↑
ⓘ Cost ranges are severity-bucket heuristics (US national rule-of-thumb). Get contractor quotes + a written scope before underwriting a rehab budget.
Schools (NCES district)
- District
- Desert Sands Unified
- NCES district ID
- 0611110
- Math proficiency
- 31% ▼ -4.00%
- Reading proficiency
- 56% ▲ 7.00%
- Median HH income
- $54,957
- Composite
- 37.77/100
- National rank
- #4346
- State rank
- #199 of 517 in CA
Livability — La Quinta
- Score
- 58/100
- State rank
- #694
- US rank
- #21080
Category grades
Schools grade is shown separately in the Schools card above.
Census & demographics
- Census place
- La Quinta, CA
- County
- Riverside County · 2,287,001 people
- City population
- 38,666
- Metro
- Riverside-San Bernardino-Ontario, CA
- Population (ZIP)
- 38,666
- Household income
- $99,277
- Rent vs Own
- Severe rent burden
- 1078.0
Population outlook (Riverside County) Hauer SSP2
- Today (2025)
- 2,664,475 people
- By 2030
- 2,802,692 · +5.2%
- By 2040
- 3,050,904 · +14.5%
- By 2050
- 3,256,783 · +22.2%
- By 2075
- 3,655,058 · +37.2%
- By 2100
- 3,766,594 · +41.4%
Race, ethnicity, and origin ACS 2023
- Neighborhood character
- Diverse neighborhood (Simpson 0.57)
- Race & ethnicity
- White 54% Hispanic / Latino 37% Two or more races 19% Asian 4% Native American 1% Black 1%
- Hispanic origin (detail)
- Mexican 34%
- Common ancestry
- Romanian 2% Lithuanian 2% Slovak 1%
- Foreign-born
- 15% · Canada, China, Vietnam
- Languages at home
- 71% English-only · Spanish 24% Tagalog/Filipino 1% Chinese 1%
Political lean MEDSL · Riverside
- 2024 margin
- Toss-up / Even · D 48.0% · R 49.3% · Other 2.6%
- 2008→2024 swing
- -3.6pp toward R · 2008: 2.3pp · 2024: -1.3pp
- All cycles
- 2024: R+1.3 2020: D+8.0 2016: D+4.3 2012: R+0.4 2008: D+2.3
Not yet ingested
- Civics
- —
Market trends
- HPI YoY
- ▼ -263.65%
- Current HPI
- 281.8665
- Rent YoY
- ▲ 6.45%
- Metro
- Riverside-San Bernardino-Ontario, CA
- State GDP YoY
- ▲ 3.21%
- F500 in state
- 116
Industry mix (Fortune 500 HQ in CA)
| Industry | F500 HQs | Revenue |
|---|---|---|
| Technology | 27 | $1,492B |
|
||
| Financial Services | 3 | $174B |
|
||
| Retail | 3 | $44B |
|
||
| Insurance | 3 | $26B |
|
||
| Media / Entertainment | 2 | $115B |
|
||
| Pharmaceuticals / Biotech | 2 | $62B |
|
||
Price history
1 event — show timeline
- 2026-04-14 Listed $435,000 GPSMLS
Cash-flow waterfall
monthlySold comps — $/sqft
last 12 mo · ≤1 miLoading sold comps…