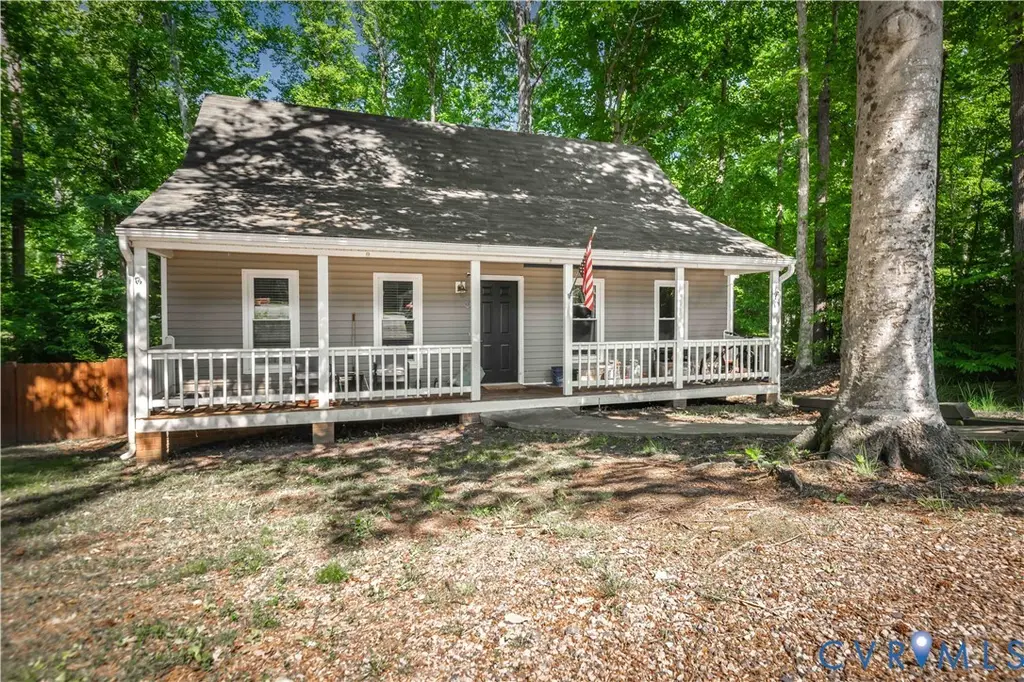
7113 Deer Run Ln · Brandermill, VA
Flood risk 8/10 · Major
- FEMA flood zone
- X (unshaded)
- Chance of flooding over 30 yrs
- 0.99%
- Est. flood insurance / yr
- $507 – $1,088
Fire risk 1/10 · Minimal
- Est. fire insurance / yr
- $666 – $1,236
Heat risk 6/10 · Moderate
- Hot days now (above 105°F)
- 7 days/yr
- Hot days in 30 yrs
- 16 days/yr
Wind risk 5/10 · Moderate
- Chance of severe wind over 30 yrs
- 25.0%
Air-quality risk 1/10 · Minimal
- Unhealthy air days now
- 0 days/yr
- Unhealthy air days in 30 yrs
- 0 days/yr
Risk factors via First Street. Map © Google.
Why this score? — see what drove the D+ grade
The composite is a weighted blend of 9 inputs, each scored 0–100. Each bar is that input's sub-score; the figure is the points it added to the 100-point composite (weight × sub-score).
- ARV discount +14.2/15.0
- Cash flow +13.8/30.0
- Schools +5.2/10.0
- DSCR +4.2/10.0
- Livability +3.9/5.0
- 1% rule +3.2/10.0
- Rent growth +3.1/5.0
- Condition / age +2.5/5.0
- Appreciation +0.0/10.0
$319,000
🖨 Deal sheet (PDF) 📄 Offer letter ✓ Due diligence
Listing remarks MLS
ADORABLE ! This 4 bedroom, 2 Full Baths Cape is ready to go. New Vinyl Siding, New Roof, New Carpet, Freshly Painted, New Fridge, New Countertops, New Kitchen Sink. Located on a peaceful cul de sac.
Key facts
- 0.37 acre lot
- Built 1990
- Listed 31 days
Property features AI
Finance
- Other: Lot zoned R12
Exterior
- Security: Smoke detector(s)
- Utilities: Public water; Public sewer
- Home design: Single-story design; Resale property; Shingle roof; Vinyl siding with frame and drywall construction
- Construction: Built (actual year); Frame construction with vinyl siding; Drywall interior
- Exterior features: Front porch; Deck; Storage shed
Interior
- Kitchen: Dishwasher; Electric cooking; Disposal; Microwave; Refrigerator; Stove
- Bedrooms: Bedroom 3 on second level (approx. 14 x 14); Bedroom 2 on first level (approx. 12 x 10); Additional room on second level (approx. 14 x 10)
- Flooring: Partially carpeted; Wood flooring
- Bathrooms: Two full bathrooms; Full bath on second level with tub and shower; Full bath on first level with tub and shower
- Heating & cooling: Central air conditioning; Forced air heating (natural gas)
- Interior features: Eat-in kitchen; Laminate counters; Main-level primary bedroom; Bedroom on main level
Neighborhood map
What this means for you Summary
Snapshot
- This is a 4-bed/2.0-bath single-family listed at $319k.
Deal economics
- At list price, monthly cash flow is $-38 ($-453/yr) — negative.
- To cash-flow at today's rent, offer at most $312k (2.1% below list).
- To meet the 1% rule (rent ≥ 1% of price), the offer needs to be $261k (18.3% below list).
- Recommended offer: $261k (18.3% below list) — sets the bar for 1% rule.
- Cap rate 6.4% vs local median 3.7% in Brandermill — top-decile yield for the area; either an underpriced asset or a hidden risk that comps aren't pricing in. Stress-test before assuming the spread holds.
Location & tenants
- Location reads 77/100 on livability (#94 in VA, #3,055 nationally) — a middle-class / working-renter tenant base. Strengths: employment A+, housing A+, crime A-; Watch: amenities F, commute F.
- Chesterfield County Public School District (suburban): math 52% / reading 64% proficiency, ranked #57 of 131 in VA (top 44%) — acceptable for families but not a draw, mixed tenant base, ~2y average lease.
- Zoned schools: Alberta Smith Elementary (math 87% / reading 87%, grade A+, #37 of 1,108 statewide, top 4%, 626 students, 34% FRL); Bailey Bridge Middle (math 52% / reading 52%, grade C+, #218 of 342 statewide, top 65%, 1,459 students, 33% FRL); Manchester High (math 61% / reading 67%, grade B-, #220 of 319 statewide, top 70%, 2,188 students, 37% FRL).
- Market conditions: Rents rising (+2.3%/yr); 495 active listings in the ZIP; 4 comparable units currently listed for rent nearby; rentals leasing fast (median 5d on market — plan ~1-2 weeks tenant-placement turnaround); high-income renter base; 2,307 units permitted in Chesterfield County in 2024 (462 in 5+ unit buildings).
Forward outlook
- Local home prices are declining (-3.0%/yr); year-one equity from $2k of loan paydown is wiped out by about $10k of value loss. Plan a longer hold.
- Chesterfield County population projected at +20% by 2050 — long-run rental-demand tailwind backs the buy-and-hold thesis.
Negotiation context
- It's been on market 31 days — a 3% lower offer ($309k) is reasonable based on typical stale-listing flexibility.
- 7 sale attempts since 16y ago with the ask held roughly flat each time — persistent listings suggest the price (not the market) is what's stuck; bring a comps-based counter.
- Current owner paid $148k; list at $319k implies a 116% gain — meaningful room to come down on a strong offer.
Risks & watch-outs
- Watch-outs: flood insurance adds $66/mo.
- Climate carrying-cost: severe flood risk; moderate wind risk, 25% chance of damaging wind over 30y; extreme-heat days projected 7→16/yr by 2055 (HVAC capex compounding) — expect insurance premiums to compound above CPI over the hold.
Questions for the listing agent
- What do current leases actually rent for vs. the listed asking? Can we see a recent rent roll and the last 12 months of T-12 income?
- It's been on market 31 days. Have you received any prior offers? Is the seller open to a 18% concession, seller financing, or rate buy-down credit?
- What's the actual annual flood-insurance premium (NFIP or private), and is the property in a SFHA with mandatory coverage?
- Is there a deadline driving the sale (1031 exchange, divorce, estate, relocation)? That informs how much negotiation room exists.
- Schools are A-rated — typically a magnet for longer-tenancy family renters. What's the average tenant stay here, and is there a school-zone premium baked into asking?
- The area grade is low — what's the realistic commute time and amenity access for the typical tenant pool here? Any planned neighborhood developments (good or bad) we should know about?
- What's the average days-on-market for RENTAL listings here right now (not sales)? A rising rental-DOM trend means longer vacancies and softer asking-rent achievability than the comps imply.
- What's the recent tenant-quality profile in this submarket — average credit score on applications, eviction rate, late-payment / NSF rate, and stable-employment percentage? A property-management company in the area should have these aggregated.
- How much new for-sale + rental construction is in the pipeline within 1–3 miles? Heavy new supply typically softens prices + rents 12–24 months out; constrained supply supports both.
Investment metrics
- 1% rule
- 0.82% ✗
- Cap rate
- 6.40%
- Cash-on-cash
- 0.39%
- DSCR
- 1.02
- GRM
- 10.2
CMA / ARV
- ARV (on-the-fly)
- $375,237
- Comps found
- 12
Show comp detail 12 sales within ~0.75 mi
| Address | Dist | Beds/Ba | Sqft | Sold | Price | $/sf | Match |
|---|---|---|---|---|---|---|---|
| 7104 Deer Run Ln | 0.08mi | 4/2.0 | 1,526 (-2%) | 2mo | $355,000 | $233 | 91 |
| 13925 Buck Rub Dr | 0.26mi | 4/2.0 | 1,600 (+3%) | 3mo | $392,600 | $245 | 81 |
| 14000 Key Deer Dr | 0.36mi | 4/2.0 | 1,554 (-0%) | 3mo | $392,000 | $252 | 80 |
| 13836 Buck Rub Dr | 0.15mi | 4/2.0 | 1,430 (-8%) | 3mo | $360,000 | $252 | 77 |
| 13805 Buck Rub Dr | 0.22mi | 3/2.0 (-1) | 1,660 (+7%) | 1mo | $400,000 | $241 | 73 |
| 6924 Velvet Antler Dr | 0.10mi | 4/2.0 | 1,344 (-14%) | 2mo | $359,950 | $268 | 71 |
| 7018 Whistlers Cove Dr | 0.38mi | 3/2.0 (-1) | 1,512 (-3%) | 4mo | $317,000 | $210 | 69 |
| 13624 Lucky Debonair Ln | 0.54mi | 4/2.0 | 1,601 (+3%) | 3mo | $368,000 | $230 | 68 |
| 13501 Buck Rub Dr | 0.28mi | 4/2.0 | 1,359 (-13%) | 4mo | $348,000 | $256 | 63 |
| 6903 Whistlers Cove Dr | 0.49mi | 4/2.0 | 1,404 (-10%) | 3mo | $337,500 | $240 | 58 |
| 13642 Decidedly Ct | 0.48mi | 3/2.5 (-1) | 1,656 (+6%) | 4mo | $380,000 | $229 | 57 |
| 13631 Decidedly Ct | 0.47mi | 3/2.5 (-1) | 1,768 (+14%) | 1mo | $358,000 | $202 | 48 |
Match score weights: distance 35% · size 25% · config 20% · recency 20%. Top-matched comps best support the ARV.
Projected returns pro-forma
-3.0% appreciation · 2.29% rent growth · sell at horizon
- IRR
- -17.9%
- Equity multiple
- 0.37×
- Total profit
- $-55,972
- Equity at exit
- $47,564
- IRR
- -11.5%
- Equity multiple
- 0.33×
- Total profit
- $-59,424
- Equity at exit
- $27,581
Cash invested: $89,320 (down + closing). Projections, not guarantees.
Landlord ↔ Tenant lean methodology
- Overall (STATE)
- 55 Moderately Landlord-Leaning
- State Virginia
- 55 Moderately Landlord-Leaning · D+2
- County
- — inherits STATE
- City
- — inherits STATE
ZIP-level market 23112
- Rents YoY
- 2.3%
- Active inventory
- 495
- Price-to-rent
- 10.2×
Monthly cashflow live
- Estimated rent
- $2,606 medium interval (Pro) →
- Mortgage (P&I)
- −$1,673
- Tax from tax record
- −$224 /mo · $2,690/yr
- Insurance
- −$133
- Flood insurance flood zone
- −$66 /mo · $798/yr
- HOA
- −$0
- Vacancy / Maint / Mgmt
- −$547
- Net cashflow
- $-38
Break-even live
Sensitivity live
| Price | -10% $143 | -5% $53 | +0% $-38 | +5% $-128 | +10% $-218 |
|---|---|---|---|---|---|
| Rent | -10% $-244 | -5% $-141 | +0% $-38 | +5% $65 | +10% $168 |
| Rate | -1.0pp $123 | -0.5pp $43 | base $-38 | +0.5pp $-120 | +1.0pp $-205 |
UW: 25.0% down · 7.5% · 30yr · 1.5% tax · 5.0% vac · 8.0% maint · 8.0% mgmt
Financing live
Cash to close
- Down payment
- $79,750
- Closing costs
- $9,570
- Reserves months
- —
- Total cash needed
- —
Loan-product check · same deal, 3 products live
Conventional
25% down · 7.5% · 30yr
- Down + closing
- —
- Monthly P&I
- —
- Monthly cashflow
- —
- DSCR
- —
- Eligible?
- —
Personal DTI + credit; lowest rate.
DSCR
20% down · 8.5% · 30yr
- Down + closing
- —
- Monthly P&I
- —
- Monthly cashflow
- —
- DSCR
- —
- Eligible?
- —
No personal income docs; deal must DSCR.
Hard money
10% down · 12.0% · 12mo
- Down + closing
- —
- Monthly P&I
- —
- Monthly cashflow
- —
- DSCR
- —
- Eligible?
- —
Short-term bridge; refi at stabilization.
Rent comps 4 comps
| Address | Beds | Baths | Sqft | Rent | $/sqft | DOM | Units | Dist |
|---|---|---|---|---|---|---|---|---|
| 7516 Flag Tail Dr Midlothian, VA | 3.0 | 2.0 | 1684 | $2,395 | $1.42 | 5d | 1 | 0.55mi |
| 13364 Diamond Ridge Dr Midlothian, VA | 3.0 | 2.5 | 2012 | $2,500 | $1.24 | 5d | 1 | 0.93mi |
| 14655 Hancock Towns Dr Chesterfield, VA | 3.0 | 2.5 | 1525 | $2,500 | $1.64 | 16d | 1 | 1.37mi |
| 5200 Hunt Master Dr Midlothian, VA | 1.0–3.0 | 1.0–2.0 | 875 | $2,199 | $2.51 | 5d | 27 | 1.45mi |
Listing history 34 events
-
2026-06-21days on market $319,000 Active 31 DOM
-
2026-06-18days on market $319,000 Active 28 DOM
-
2026-06-17days on market $319,000 Active 27 DOM
-
2026-06-16days on market $319,000 Active 26 DOM
-
2026-06-15days on market $319,000 Active 25 DOM
-
2026-06-13days on market $319,000 Active 23 DOM
-
2026-06-13days on market $319,000 Active 22 DOM
-
2026-06-09days on market $319,000 Active 19 DOM
-
2026-06-08days on market $319,000 Active 18 DOM
-
2026-06-08price $319,000 Active 17 DOM
-
2026-06-07days on market $325,000 Active 17 DOM
-
2026-06-05days on market $325,000 Active 14 DOM
-
2026-06-03days on market $325,000 Active 13 DOM
-
2026-06-02days on market $325,000 Active 12 DOM
-
2026-06-01days on market $325,000 Active 11 DOM
-
2026-05-31days on market $325,000 Active 10 DOM
-
2026-05-22$325,000 Active
-
2026-05-16historical $325,000
-
2014-03-31soldstatus $148,000
-
2014-03-28soldstatus $148,000 199-char remark
Show marketing remark (199 chars)
ADORABLE ! This 4 bedroom, 2 Full Baths Cape is ready to go. New Vinyl Siding, New Roof, New Carpet, Freshly Painted, New Fridge, New Countertops, New Kitchen Sink. Located on a peaceful cul de sac.
-
2014-02-19historical 199-char remark
Show marketing remark (199 chars)
ADORABLE ! This 4 bedroom, 2 Full Baths Cape is ready to go. New Vinyl Siding, New Roof, New Carpet, Freshly Painted, New Fridge, New Countertops, New Kitchen Sink. Located on a peaceful cul de sac.
-
2014-01-06$144,900 199-char remark
Show marketing remark (199 chars)
ADORABLE ! This 4 bedroom, 2 Full Baths Cape is ready to go. New Vinyl Siding, New Roof, New Carpet, Freshly Painted, New Fridge, New Countertops, New Kitchen Sink. Located on a peaceful cul de sac.
-
2013-12-28historical
-
2013-06-27$151,990
-
2013-04-24soldstatus $95,000
-
2013-03-01historical
-
2013-01-17$115,000
-
2011-10-12historical
-
2011-04-27$99,950
-
2011-04-14historical
-
2010-10-16$135,000
-
2010-10-15historical
-
2010-08-22$174,950
-
1990-09-04soldstatus $75,250
ⓘ Source: listings_history table (triggers on properties + properties_extension) + one-shot
backfill from property_details.listing_events for pre-trigger history.
Tax reassessment forecast VA · Resets to sale price
- Current annual tax
- $2,690 · $224/mo
- Projected year-2 tax
- $2,690 · $224/mo
- Expected delta
- $0/yr ($0/mo · 0.0%)
ⓘ Screening estimate from a state-policy table — verify with the county assessor before closing.
Climate risk First Street
- Flood 8/10 Severe FEMA zone X (unshaded) · 99% chance over 30 yrs
- Wildfire 1/10 Low
- Heat 6/10 Major 7 d/yr ≥105°F today · 16 d/yr by 30 yrs out
- Wind 5/10 Major 25% chance of damaging wind over 30 yrs
- Air quality 1/10 Low 0 unhealthy d/yr today · 0 by 30 yrs out
Nearby sold comps map
Loading sold comps map…
Walkable amenities ~0.75 mi
Loading nearby amenities…
Taxation est. · year 1
- Rental income
- $31,271
- − Mortgage interest
- −$17,869
- − Property taxes
- −$2,690
- − Insurance
- −$2,392
- − Repairs & maintenance
- −$2,502
- − Management
- −$2,502
- − Depreciation
- −$9,280
- Taxable loss
- −$5,964
- Est. tax savings @ 24.0%
- +$1,431
- After-tax cash flow
- $978/yr
For passive investors: Depreciation is non-cash, so a rental often shows a tax loss while cash-flowing — sheltering income. Rental losses are passive: they offset passive income freely, and up to $25,000/yr can offset ordinary (W-2) income if you actively participate and your MAGI is under $100k (phasing out to $0 by $150k); unused losses carry forward. On sale, claimed depreciation is recaptured at up to 25%, and gains may owe capital-gains tax (a 1031 exchange can defer both). Figures are a year-1 estimate at your 24.0% rate — not tax advice; consult a CPA.
Schools (NCES district)
- District
- Chesterfield County Public School District
- NCES district ID
- 5100840
- Math proficiency
- 52% ▼ -30.00%
- Reading proficiency
- 64% ▼ -15.00%
- Median HH income
- $72,821
- Composite
- 51.56/100
- National rank
- #1712
- State rank
- #57 of 131 in VA
Livability — Brandermill
- Score
- 77/100
- State rank
- #94
- US rank
- #3055
Category grades
Schools grade is shown separately in the Schools card above.
Census & demographics
- County
- Chesterfield County · 406,988 people
- City population
- 56,364
- Metro
- Richmond, VA
- Population (ZIP)
- 57,016
- Household income
- $116,465
- Rent vs Own
- Severe rent burden
- 897.0
Population outlook (Chesterfield County) Hauer SSP2
- Today (2025)
- 377,190 people
- By 2030
- 395,710 · +4.9%
- By 2040
- 427,694 · +13.4%
- By 2050
- 452,706 · +20.0%
- By 2075
- 505,533 · +34.0%
- By 2100
- 521,282 · +38.2%
Race, ethnicity, and origin ACS 2023
- Neighborhood character
- Predominantly White (70%)
- Race & ethnicity
- White 70% Black 14% Two or more races 7% Hispanic / Latino 6% Asian 4%
- Hispanic origin (detail)
- Mexican 1% Puerto Rican 2%
- Common ancestry
- Lithuanian 4% Italian 4% Romanian 2%
- Foreign-born
- 7% · Canada, China, Jamaica
- Languages at home
- 91% English-only · Spanish 4% Other Indo-European 1% Arabic 1%
Political lean MEDSL · Chesterfield
- 2024 margin
- Lean D (+9.0) · D 53.8% · R 44.8% · Other 1.4%
- 2008→2024 swing
- +16.4pp toward D · 2008: -7.5pp · 2024: 9.0pp
- All cycles
- 2024: D+9.0 2020: D+6.7 2016: R+2.2 2012: R+7.1 2008: R+7.5
Not yet ingested
- Civics
- —
Market trends
- HPI YoY
- ▼ -224.87%
- Current HPI
- 277.4841
- Rent YoY
- ▲ 2.29%
- Metro
- Richmond, VA
- State GDP YoY
- ▲ 2.40%
- F500 in state
- 50
Industry mix (Fortune 500 HQ in VA)
| Industry | F500 HQs | Revenue |
|---|---|---|
| Aerospace / Defense | 4 | $236B |
|
||
| Technology / Defense | 3 | $32B |
|
||
| Financial Services | 2 | $176B |
|
||
| Utilities | 2 | $27B |
|
||
| Insurance | 2 | $25B |
|
||
| Technology | 2 | $15B |
|
||
Price history
+331.9% since first listed18 events — show timeline
- 2026-05-22 Listed $325,000 CVRMLS
- 2026-05-16 Coming Soon $325,000 CVRMLS
- 2014-03-31 Sold (Public Records) $148,000 Public Records
- 2014-03-28 Sold (MLS) $148,000 CVRMLS
- 2014-02-19 Listing Removed — CVRMLS
- 2014-01-06 Listed $144,900 CVRMLS
- 2013-12-28 Listing Removed — CVRMLS
- 2013-06-27 Listed $151,990 CVRMLS
- 2013-04-24 Sold (MLS) $95,000 CVRMLS
- 2013-03-01 Listing Removed — CVRMLS
- 2013-01-17 Listed $115,000 CVRMLS
- 2011-10-12 Listing Removed — CVRMLS
- 2011-04-27 Listed $99,950 CVRMLS
- 2011-04-14 Listing Removed — CVRMLS
- 2010-10-16 Listed $135,000 CVRMLS
- 2010-10-15 Listing Removed — CVRMLS
- 2010-08-22 Listed $174,950 CVRMLS
- 1990-09-04 Sold (Public Records) $75,250 Public Records
Property tax history
+6.0%/yrLatest (2025): $2,690 · +3.1% YoY. Source: county tax records.
Cash-flow waterfall
monthlySold comps — $/sqft
last 12 mo · ≤1 miLoading sold comps…