 Duplex
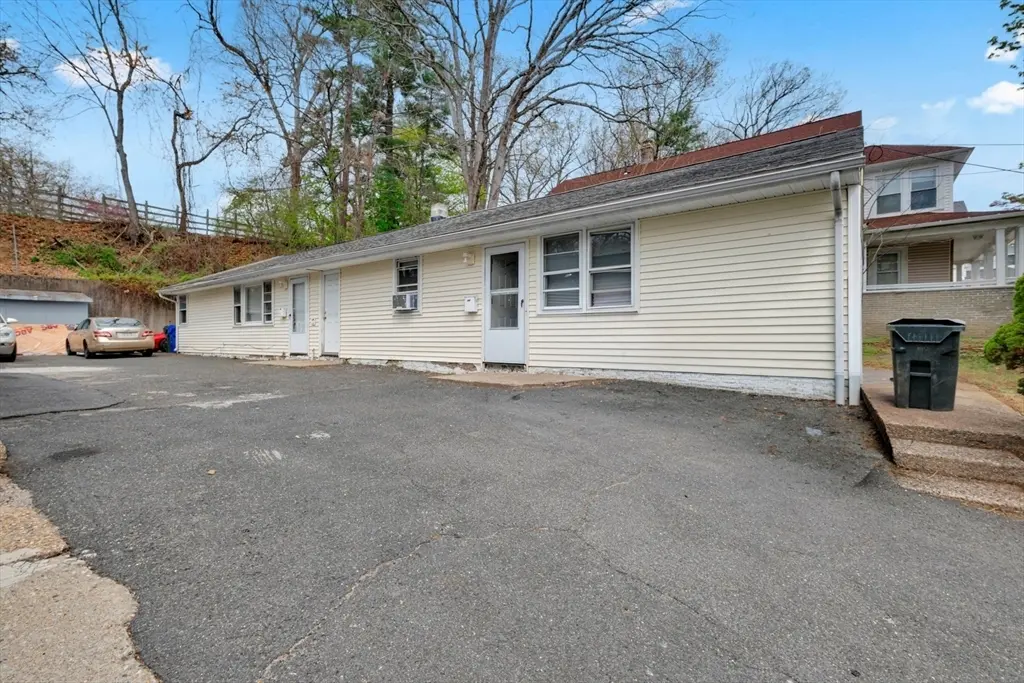
746-748 Alden St · Springfield, MA
Flood risk No data
- FEMA flood zone
- —
- Chance of flooding over 30 yrs
- —
- Est. flood insurance / yr
- —
Fire risk No data
- Est. fire insurance / yr
- —
Heat risk No data
- Hot days now (above threshold)
- —
- Hot days in 30 yrs
- —
Wind risk No data
- Chance of severe wind over 30 yrs
- —
Air-quality risk No data
- Unhealthy air days now
- —
- Unhealthy air days in 30 yrs
- —
Risk factors via First Street. Map © Google.
Why this score? — see what drove the C grade
The composite is a weighted blend of 9 inputs, each scored 0–100. Each bar is that input's sub-score; the figure is the points it added to the 100-point composite (weight × sub-score).
- Cash flow +26.0/30.0
- DSCR +8.8/10.0
- 1% rule +6.9/10.0
- ARV discount +6.1/15.0
- Livability +3.7/5.0
- Rent growth +2.5/5.0
- Condition / age +2.2/5.0
- Schools +1.6/10.0
- Appreciation +0.0/10.0
$329,900
🖨 Deal sheet 📄 Offer letter ✓ Due diligence
Multi-family units
County records classify this as Multi-Family (2-4 Unit). Listing-text estimate: 2 units. confirmed
Listing remarks MLS
Ranch style duplex conveniently located. Currently both sides rented, but can be sold fully or partially vacant.
Key facts
- Water views
- Turnkey 2-family
- Prime location
Tags
Property features AI
Finance
- HOA & community: Community amenities include public transportation, shopping, park, walk/jog trails, medical facility, laundromat, bike path, highway access, house of worship, public school, university
Exterior
- Parking: Paved driveway/open parking; 4 parking spaces
- Utilities: Public water; Public sewer
- Home design: Multi-family property; 2 stories; Yellow exterior
- Construction: Built (per public records); Slab foundation
- Exterior features: Gentle sloping lot; Public road frontage; River waterview
Interior
- Kitchen: Range; Refrigerator
- Bedrooms: Unit 1: 1 level; Unit 2: 1 level
- Bathrooms: 2 full bathrooms
- Heating & cooling: Natural gas heating
- Interior features: Living room; Kitchen; 8 total rooms
- Laundry & utility: Washer; Dryer
Neighborhood map
What this means for you Summary
Snapshot
- This is a 2 × 2-bed/1.0-bath units multifamily listed at $330k. Condition is rated fair.
Deal economics
- At list price, monthly cash flow is $823 ($10k/yr) — positive. Per door: $412/mo.
- The deal already cash-flows at list — no discount required.
- Meets the 1% rule at list price ($4k rent vs $330k).
- Recommended offer: $320k (3.0% below list) — sets the bar for market timing.
- Cap rate 9.3% vs local median 5.1% in Springfield — top-decile yield for the area; either an underpriced asset or a hidden risk that comps aren't pricing in. Stress-test before assuming the spread holds.
Location & tenants
- Location reads 73/100 on livability (#97 in MA) — a middle-class / working-renter tenant base. Strengths: commute A+, health & safety A+, amenities A; Watch: schools D, crime F, employment D-.
- Springfield (urban): math 13% / reading 25% proficiency, ranked #296 of 302 in MA (top 98%) — low school quality limits family demand, transient renter base, plan for 1-2y turnover; 81% free/reduced lunch — lower-income household profile, screen leases tightly.
- Market conditions: 32 active listings in the ZIP; 4 comparable units currently listed for rent nearby; rentals lingering (median 44d on market — plan ~5-8 weeks vacancy on turnover, expect pricing pressure); 75% of comp listings sitting > 30 days — soft ceiling on asking rent; 453 units permitted in Hampden County in 2024 (116 in 5+ unit buildings).
- At $3,928/mo this rent would consume 97% of the median local household income ($48k/yr) (locally 1322% of renters already pay >50% of income on rent) — very limited rent-growth headroom before tenants either downsize or default.
Forward outlook
- Local home prices are declining (-3.0%/yr); year-one equity from $2k of loan paydown is wiped out by about $10k of value loss. Plan a longer hold.
- Hampden County population projected at +5% by 2050 — modest demand growth; plan on rents tracking national, not racing it.
Negotiation context
- It's been on market 44 days — a 3% lower offer ($320k) is reasonable based on typical stale-listing flexibility.
- 2 sale attempts since 16y ago; this cycle's ask has dropped $20k (6%) from the opening price — seller is motivated, your offer sets the floor, not the list.
- Current owner paid $82k; list at $330k implies a 305% gain — meaningful room to come down on a strong offer.
Questions for the listing agent
- It's been on market 44 days. Have you received any prior offers? Is the seller open to a 3% concession, seller financing, or rate buy-down credit?
- Can we see the unit-by-unit rent roll, current vacancy, and any below-market leases? What's the average tenancy length?
- What capital expenditures (roof, boiler, parking lot, exteriors) have been made in the last 5 years, and what's planned in the next 2?
- Have any recent inspections been done? Can we get a copy of the seller's disclosures and any deferred-maintenance estimates?
- Built in 1966 — when were the roof, HVAC, electrical panel, plumbing, and water heater last replaced?
- Is there a deadline driving the sale (1031 exchange, divorce, estate, relocation)? That informs how much negotiation room exists.
- Schools are D-rated, which usually means shorter tenancies and higher turnover. Who's the typical renter profile here, and what's been the actual vacancy rate?
- Crime grade is F in this area — have there been break-ins, vandalism, or insurance claims at this property in the last 3 years? What carrier currently insures it and at what premium?
- What's the average days-on-market for RENTAL listings here right now (not sales)? A rising rental-DOM trend means longer vacancies and softer asking-rent achievability than the comps imply.
- What's the recent tenant-quality profile in this submarket — average credit score on applications, eviction rate, late-payment / NSF rate, and stable-employment percentage? A property-management company in the area should have these aggregated.
- How much new apartment / multifamily construction is in the pipeline within 1–3 miles? Heavy new supply (>2% of stock underway) typically softens rents 12–24 months out; light construction supports rent growth.
Investment metrics
- 1% rule
- 1.19% ✓
- Cap rate
- 9.29%
- Cash-on-cash
- 10.69%
- DSCR
- 1.48
- GRM
- 7.0
CMA / ARV
- ARV (median comp)
- $319,739
- List price
- $329,900
- Delta
- 3.18%
- Verdict
- FAIR
- Comps
- 18 within 1.0 mi
Show comp detail 1 sale within ~0.75 mi
| Address | Dist | Beds/Ba | Sqft | Sold | Price | $/sf | Match |
|---|---|---|---|---|---|---|---|
| 128-130 Wellington St | 0.51mi | 4/2.0 | 1,944 (+7%) | 18mo | $247,000 | $127 | 49 |
Match score weights: distance 35% · size 25% · config 20% · recency 20%. Top-matched comps best support the ARV.
Projected returns pro-forma
-3.0% appreciation · 3.0% rent growth · sell at horizon
- IRR
- -0.3%
- Equity multiple
- 0.99×
- Total profit
- $-965
- Equity at exit
- $49,189
- IRR
- 9.4%
- Equity multiple
- 1.72×
- Total profit
- $66,917
- Equity at exit
- $28,524
Cash invested: $92,372 (down + closing). Projections, not guarantees.
Landlord ↔ Tenant lean methodology
- Overall (STATE)
- 20 Strongly Tenant-Friendly
- State Massachusetts
- 20 Strongly Tenant-Friendly · D+15
- County
- — inherits STATE
- City
- — inherits STATE
ZIP-level market 01109
- Home prices YoY
- -22.8%
- Active inventory
- 32
- Price-to-rent
- 14.0×
Monthly cashflow live
- Estimated rent
- $3,928 high interval (Pro) →
- Mortgage (P&I)
- −$1,730
- Tax est. 1.5%
- −$412 /mo · $4,948/yr
- Insurance
- −$137
- HOA
- −$0
- Vacancy / Maint / Mgmt
- −$825
- Net cashflow
- $823
Break-even live
2-unit breakdown (identical units grouped — click to expand)
| Units | Beds | Baths | Est. rent |
|---|---|---|---|
| 2× units | 2 | 1 | $3,928 |
| #1 | 2 | 1 | $1,964 |
| #2 | 2 | 1 | $1,964 |
| Total (2 units) | $3,928 | ||
UW: 25.0% down · 7.5% · 30yr · 1.5% tax · 5.0% vac · 8.0% maint · 8.0% mgmt
Financing live
Cash to close
- Down payment
- $82,475
- Closing costs
- $9,897
- Reserves months
- —
- Total cash needed
- —
Loan-product check · same deal, 3 products live
Conventional
25% down · 7.5% · 30yr
- Down + closing
- —
- Monthly P&I
- —
- Monthly cashflow
- —
- DSCR
- —
- Eligible?
- —
Personal DTI + credit; lowest rate.
DSCR
20% down · 8.5% · 30yr
- Down + closing
- —
- Monthly P&I
- —
- Monthly cashflow
- —
- DSCR
- —
- Eligible?
- —
No personal income docs; deal must DSCR.
Hard money
10% down · 12.0% · 12mo
- Down + closing
- —
- Monthly P&I
- —
- Monthly cashflow
- —
- DSCR
- —
- Eligible?
- —
Short-term bridge; refi at stabilization.
Rent comps 4 comps
| Address | Beds | Baths | Sqft | Rent | $/sqft | DOM | Units | Dist |
|---|---|---|---|---|---|---|---|---|
| 53 Westford Cir Springfield, MA | 3.0 | 1.0 | 1330 | $1,750 | $1.32 | 43d | 1 | 0.65mi |
| 49 Rittenhouse Ter Unit 1 Springfield, MA | 3.0 | 1.0 | 1300 | $2,000 | $1.54 | 43d | 1 | 1.34mi |
| 41 Clarendon St Unit 2 Springfield, MA | 5.0 | 1.5 | 1600 | $2,350 | $1.47 | 43d | 1 | 1.39mi |
| 93 Orleans St #93 Springfield, MA | 3.0 | 1.5 | 1408 | $2,050 | $1.46 | 13d | 1 | 1.44mi |
Listing history 19 events
-
2026-06-18days on market $329,900 Active 44 DOM
-
2026-06-17days on market $329,900 Active 43 DOM
-
2026-06-16days on market $329,900 Active 42 DOM
-
2026-06-15days on market $329,900 Active 41 DOM
-
2026-06-14days on market $329,900 Active 39 DOM
-
2026-06-13days on market $329,900 Active 38 DOM
-
2026-06-10days on market $329,900 Active 36 DOM
-
2026-06-09days on market $329,900 Active 35 DOM
-
2026-06-08days on market $329,900 Active 34 DOM
-
2026-06-07days on market $329,900 Active 33 DOM
-
2026-06-05days on market $329,900 Active 30 DOM
-
2026-06-03days on market $329,900 Active 29 DOM
-
2026-06-02days on market $329,900 Active 28 DOM
-
2026-06-01statusdays on market $329,900 Active 27 DOM
-
2026-05-31days on market $329,900 Price Changed 26 DOM
-
2026-05-30days on market $329,900 Price Changed 25 DOM
-
2026-05-05$349,900 New 901-char remark
-
2010-11-09soldstatus $81,500 113-char remark
Show marketing remark (113 chars)
Ranch style duplex conveniently located. Currently both sides rented, but can be sold fully or partially vacant.
-
2010-08-30$89,900 113-char remark
Show marketing remark (113 chars)
Ranch style duplex conveniently located. Currently both sides rented, but can be sold fully or partially vacant.
ⓘ Source: listings_history table (triggers on properties + properties_extension) + one-shot
backfill from property_details.listing_events for pre-trigger history.
Nearby sold comps map
Loading sold comps map…
Walkable amenities ~0.75 mi
Loading nearby amenities…
Taxation est. · year 1
- Rental income
- $47,136
- − Mortgage interest
- −$18,480
- − Property taxes
- −$4,948
- − Insurance
- −$1,650
- − Repairs & maintenance
- −$3,771
- − Management
- −$3,771
- − Depreciation
- −$9,597
- Taxable income
- $4,920
- Est. tax owed @ 24.0%
- −$1,181
- After-tax cash flow
- $8,698/yr
For passive investors: Depreciation is non-cash, so a rental often shows a tax loss while cash-flowing — sheltering income. Rental losses are passive: they offset passive income freely, and up to $25,000/yr can offset ordinary (W-2) income if you actively participate and your MAGI is under $100k (phasing out to $0 by $150k); unused losses carry forward. On sale, claimed depreciation is recaptured at up to 25%, and gains may owe capital-gains tax (a 1031 exchange can defer both). Figures are a year-1 estimate at your 24.0% rate — not tax advice; consult a CPA.
Condition & rehab AI · 12 photos
This 2-family property requires moderate renovations to improve its condition and value. Interior updates, such as painting and replacing countertops, would significantly enhance its appeal.
Repairs flagged
- Minor Kitchen countertops — Cluttered and could use cleaning
- Minor Bathroom fixtures — Simple and dated
- Moderate Exterior siding — Weathered and could benefit from repainting
Value-add opportunities
- Both Paint interior walls — Fresh paint enhances curb appeal and interior aesthetics
- Both Replace countertops — Modern countertops improve functionality and resale value
- Both Update bathroom fixtures — Modern fixtures enhance functionality and resale value
Renovation cost estimate screening
| Repair item | Severity | Est. cost |
|---|---|---|
| Kitchen countertops · Cluttered and could use cleaning | Minor | $500–3,000 |
| Bathroom fixtures · Simple and dated | Minor | $500–3,000 |
| Exterior siding · Weathered and could benefit from repainting | Moderate | $3,000–15,000 |
| Total estimated repair cost · 3 items | $4,000–21,000 |
Value-add ROI direction
- Both Paint interior walls — Fresh paint enhances curb appeal and interior aesthetics ↑
- Both Replace countertops — Modern countertops improve functionality and resale value ↑
- Both Update bathroom fixtures — Modern fixtures enhance functionality and resale value ↑
ⓘ Cost ranges are severity-bucket heuristics (US national rule-of-thumb). Get contractor quotes + a written scope before underwriting a rehab budget.
Schools (NCES district)
- District
- Springfield
- NCES district ID
- 2511130
- Math proficiency
- 13% ▼ -12.00%
- Reading proficiency
- 25% ▼ -5.00%
- Median HH income
- $34,938
- Composite
- 15.6/100
- National rank
- #9293
- State rank
- #296 of 302 in MA
Livability — Springfield
- Score
- 73/100
- State rank
- #97
- US rank
- #5195
Category grades
Schools grade is shown separately in the Schools card above.
Census & demographics
- Census place
- Springfield, MA
- County
- Hampden County · 230,965 people
- City population
- 61,006
- Metro
- Springfield, MA
- Population (ZIP)
- 31,124
- Household income
- $48,415
- Rent vs Own
- Severe rent burden
- 1322.0
Population outlook (Hampden County) Hauer SSP2
- Today (2025)
- 485,646 people
- By 2030
- 491,517 · +1.2%
- By 2040
- 500,539 · +3.1%
- By 2050
- 508,827 · +4.8%
- By 2075
- 539,167 · +11.0%
- By 2100
- 545,698 · +12.4%
Race, ethnicity, and origin ACS 2023
- Neighborhood character
- Diverse neighborhood (Simpson 0.67)
- Race & ethnicity
- Hispanic / Latino 45% Black 31% Two or more races 20% White 18% Asian 1% Native American 1%
- Hispanic origin (detail)
- Puerto Rican 39% Dominican 3%
- Common ancestry
- Lithuanian 2% Romanian 1%
- Foreign-born
- 9% · Canada, China
- Languages at home
- 65% English-only · Spanish 32% Other Asian/Pacific 1% Russian/Polish/Slavic 1%
Political lean MEDSL · Hampden
- 2024 margin
- Lean D (+8.9) · D 53.4% · R 44.5% · Other 2.1%
- 2008→2024 swing
- -16.4pp toward R · 2008: 25.3pp · 2024: 8.9pp
- All cycles
- 2024: D+8.9 2020: D+17.7 2016: D+16.0 2012: D+25.4 2008: D+25.3
Not yet ingested
- Civics
- —
Market trends
- HPI YoY
- ▼ -113.11%
- Current HPI
- 382.9038
- Rent YoY
- —
- Metro
- Springfield, MA
- State GDP YoY
- ▲ 2.28%
- F500 in state
- 38
Industry mix (Fortune 500 HQ in MA)
| Industry | F500 HQs | Revenue |
|---|---|---|
| Technology | 3 | $17B |
|
||
| Insurance | 2 | $84B |
|
||
| Retail | 2 | $76B |
|
||
| Life Sciences | 1 | $43B |
|
||
| Energy Technology | 1 | $31B |
|
||
| Aerospace / Defense | 1 | $18B |
|
||
Price history
+267.0% since first listed4 events — show timeline
- 2026-05-28 Price Changed $329,900 MLS PIN
- 2026-05-05 Listed $349,900 MLS PIN
- 2010-11-09 Sold (MLS) $81,500 MLS PIN
- 2010-08-30 Listed $89,900 MLS PIN
Cash-flow waterfall
monthlySold comps — $/sqft
last 12 mo · ≤1 miLoading sold comps…