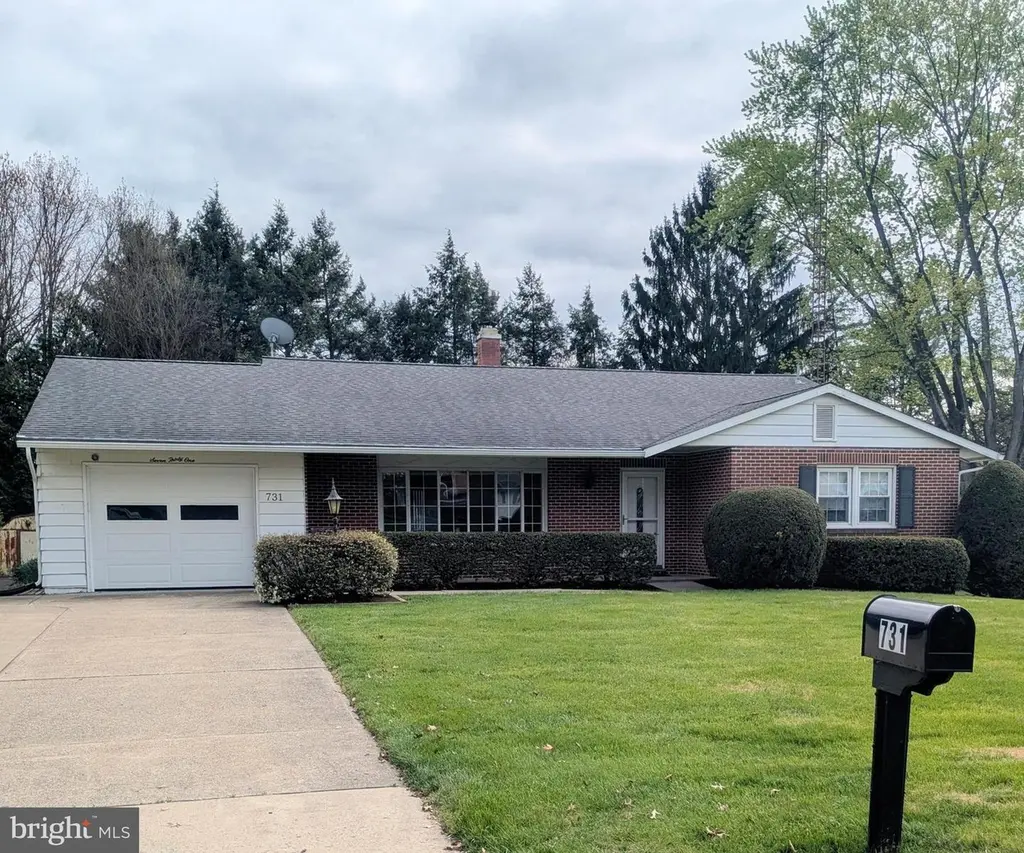
731 St Paul St · Lewisburg, PA
Flood risk 4/10 · Minor
- FEMA flood zone
- X (unshaded)
- Chance of flooding over 30 yrs
- 0.23%
- Est. flood insurance / yr
- $473 – $860
Fire risk 1/10 · Minimal
- Est. fire insurance / yr
- $511 – $949
Heat risk 5/10 · Moderate
- Hot days now (above 101°F)
- 7 days/yr
- Hot days in 30 yrs
- 15 days/yr
Wind risk 2/10 · Minimal
- Chance of severe wind over 30 yrs
- 3.0%
Air-quality risk 2/10 · Minimal
- Unhealthy air days now
- 0 days/yr
- Unhealthy air days in 30 yrs
- 1 days/yr
Risk factors via First Street. Map © Google.
Why this score? — see what drove the D grade
The composite is a weighted blend of 9 inputs, each scored 0–100. Each bar is that input's sub-score; the figure is the points it added to the 100-point composite (weight × sub-score).
- Cash flow +12.9/30.0
- ARV discount +7.5/15.0
- Schools +5.9/10.0
- Livability +3.9/5.0
- 1% rule +3.8/10.0
- DSCR +3.8/10.0
- Rent growth +2.5/5.0
- Condition / age +2.5/5.0
- Appreciation +0.0/10.0
$309,000
🖨 Deal sheet 📄 Offer letter ✓ Due diligence
Listing remarks
Welcome to this well-maintained ranch home offering the ease of one-floor living in a prime location near downtown Lewisburg! This move-in ready home features an open-concept layout, hardwood floors, and recessed lighting, creating a bright and inviting main living space. The primary bedroom with private full bath, main floor laundry, and abundant closet space add everyday convenience and functionality. Enjoy year-round comfort in the three-season sunroom overlooking the spacious yard. The finished basement significantly expands your living space with a wet bar, game room, additional bedroom, and entertainment area, plus plenty of storage including a walk-in cedar closet. You'll find it&rsq
Key facts
- 0.33 acre lot
- Garage
- Built 1964
Property features AI
Exterior
- Parking: Attached front-entry garage with garage door opener; Driveway; One garage/parking space total
- Utilities: Public water; Public sewer; 200+ amp electric service
- Home design: Detached property; Estimated year built
- Construction: Brick and aluminum siding exterior; Block foundation with active radon mitigation; Shingle roof
- Exterior features: Patio(s); Shed; Walkout basement; Partially finished basement; Not in a federal flood zone
Interior
- Kitchen: Kitchen (appliances not specified)
- Bedrooms: Three bedrooms on main level; One bedroom on lower level
- Flooring: Hardwood floors
- Bathrooms: Two full bathrooms on main level; Two full bathrooms total
- Heating & cooling: Heat pump(s) for heating and cooling; Electric heating and cooling; Electric hot water
- Interior features: Cedar closets; Stall shower; Entry-level bedroom; Master bathroom; Recessed lighting; Wet/dry bar; Wood floors; Estimated living area
- Laundry & utility: Main floor laundry
Neighborhood map
What this means for you Summary
Snapshot
- This is a 4-bed/2.0-bath other listed at $309k.
Deal economics
- At list price, monthly cash flow is $-25 ($-298/yr) — negative.
- To cash-flow at today's rent, offer at most $305k (1.4% below list).
- To meet the 1% rule (rent ≥ 1% of price), the offer needs to be $272k (12.1% below list).
- Recommended offer: $272k (12.1% below list) — sets the bar for 1% rule.
- Cap rate 6.2% vs local median 3.9% in Lewisburg — top-decile yield for the area; either an underpriced asset or a hidden risk that comps aren't pricing in. Stress-test before assuming the spread holds.
Location & tenants
- Location reads 78/100 on livability (#279 in PA, #2,468 nationally) — a middle-class / working-renter tenant base. Strengths: cost of living A+, health & safety A+, crime A-; Watch: housing C-, commute F, employment F.
- Lewisburg Area SD (town): math 65% / reading 74% proficiency, ranked #31 of 539 in PA (top 6%) — acceptable for families but not a draw, mixed tenant base, ~2y average lease.
- Market conditions: 52 active listings in the ZIP; solid renter incomes; 49 units permitted in Union County in 2024 (0 in 5+ unit buildings).
- This rent runs 37% of the median local income ($89k/yr) — at the standard rent-burdened threshold; future hikes will face affordability resistance.
Forward outlook
- Local home prices are declining (-3.0%/yr); year-one equity from $2k of loan paydown is wiped out by about $9k of value loss. Plan a longer hold.
- Union County population projected at +5% by 2050 — modest demand growth; plan on rents tracking national, not racing it.
Negotiation context
- Only 4 days on market — expect competitive offers; lowballing is unlikely to land.
- Current owner paid $135k; list at $309k implies a 129% gain — meaningful room to come down on a strong offer.
Risks & watch-outs
- Climate carrying-cost: extreme-heat days projected 7→15/yr by 2055 (HVAC capex compounding) — expect insurance premiums to compound above CPI over the hold.
Questions for the listing agent
- What do current leases actually rent for vs. the listed asking? Can we see a recent rent roll and the last 12 months of T-12 income?
- Built in 1964 — when were the roof, HVAC, electrical panel, plumbing, and water heater last replaced?
- Is there a deadline driving the sale (1031 exchange, divorce, estate, relocation)? That informs how much negotiation room exists.
- Schools are B-rated — typically a magnet for longer-tenancy family renters. What's the average tenant stay here, and is there a school-zone premium baked into asking?
- The area grade is low — what's the realistic commute time and amenity access for the typical tenant pool here? Any planned neighborhood developments (good or bad) we should know about?
- What's the average days-on-market for RENTAL listings here right now (not sales)? A rising rental-DOM trend means longer vacancies and softer asking-rent achievability than the comps imply.
- What's the recent tenant-quality profile in this submarket — average credit score on applications, eviction rate, late-payment / NSF rate, and stable-employment percentage? A property-management company in the area should have these aggregated.
- How much new for-sale + rental construction is in the pipeline within 1–3 miles? Heavy new supply typically softens prices + rents 12–24 months out; constrained supply supports both.
Investment metrics
- 1% rule
- 0.88% ✗
- Cap rate
- 6.20%
- Cash-on-cash
- -0.34%
- DSCR
- 0.98
- GRM
- 9.5
CMA / ARV
No comps found within radius.
Projected returns pro-forma
-3.0% appreciation · 3.0% rent growth · sell at horizon
- IRR
- -16.8%
- Equity multiple
- 0.40×
- Total profit
- $-51,591
- Equity at exit
- $46,073
- IRR
- -8.7%
- Equity multiple
- 0.46×
- Total profit
- $-46,706
- Equity at exit
- $26,717
Cash invested: $86,520 (down + closing). Projections, not guarantees.
Landlord ↔ Tenant lean methodology
- Overall (STATE)
- 62 Landlord-Friendly
- State Pennsylvania
- 62 Landlord-Friendly · EVEN
- County
- — inherits STATE
- City
- — inherits STATE
ZIP-level market 17837
- Active inventory
- 52
- Price-to-rent
- 9.5×
Monthly cashflow live
- Estimated rent
- $2,717 medium interval (Pro) →
- Mortgage (P&I)
- −$1,620
- Tax from tax record
- −$422 /mo · $5,062/yr
- Insurance
- −$129
- HOA
- −$0
- Vacancy / Maint / Mgmt
- −$570
- Net cashflow
- $-25
Break-even live
UW: 25.0% down · 7.5% · 30yr · 1.5% tax · 5.0% vac · 8.0% maint · 8.0% mgmt
Financing live
Cash to close
- Down payment
- $77,250
- Closing costs
- $9,270
- Reserves months
- —
- Total cash needed
- —
Loan-product check · same deal, 3 products live
Conventional
25% down · 7.5% · 30yr
- Down + closing
- —
- Monthly P&I
- —
- Monthly cashflow
- —
- DSCR
- —
- Eligible?
- —
Personal DTI + credit; lowest rate.
DSCR
20% down · 8.5% · 30yr
- Down + closing
- —
- Monthly P&I
- —
- Monthly cashflow
- —
- DSCR
- —
- Eligible?
- —
No personal income docs; deal must DSCR.
Hard money
10% down · 12.0% · 12mo
- Down + closing
- —
- Monthly P&I
- —
- Monthly cashflow
- —
- DSCR
- —
- Eligible?
- —
Short-term bridge; refi at stabilization.
Listing history 3 events
-
2026-05-02status Pending
-
2026-04-27$309,000 Active
-
2002-06-01soldstatus $135,000
ⓘ Source: listings_history table (triggers on properties + properties_extension) + one-shot
backfill from property_details.listing_events for pre-trigger history.
Tax reassessment forecast PA · Partial reset (capped growth)
- Current annual tax
- $5,062 · $422/mo
- Projected year-2 tax
- $5,062 · $422/mo
- Expected delta
- $0/yr ($0/mo · 0.0%)
ⓘ Screening estimate from a state-policy table — verify with the county assessor before closing.
Climate risk First Street
- Flood 4/10 Moderate FEMA zone X (unshaded) · 23% chance over 30 yrs
- Wildfire 1/10 Low
- Heat 5/10 Major 7 d/yr ≥101°F today · 15 d/yr by 30 yrs out
- Wind 2/10 Low 3% chance of damaging wind over 30 yrs
- Air quality 2/10 Low 0 unhealthy d/yr today · 1 by 30 yrs out
Nearby sold comps map
Loading sold comps map…
Walkable amenities ~0.75 mi
Loading nearby amenities…
Taxation est. · year 1
- Rental income
- $32,600
- − Mortgage interest
- −$17,309
- − Property taxes
- −$5,062
- − Insurance
- −$1,545
- − Repairs & maintenance
- −$2,608
- − Management
- −$2,608
- − Depreciation
- −$8,989
- Taxable loss
- −$5,521
- Est. tax savings @ 24.0%
- +$1,325
- After-tax cash flow
- $1,027/yr
For passive investors: Depreciation is non-cash, so a rental often shows a tax loss while cash-flowing — sheltering income. Rental losses are passive: they offset passive income freely, and up to $25,000/yr can offset ordinary (W-2) income if you actively participate and your MAGI is under $100k (phasing out to $0 by $150k); unused losses carry forward. On sale, claimed depreciation is recaptured at up to 25%, and gains may owe capital-gains tax (a 1031 exchange can defer both). Figures are a year-1 estimate at your 24.0% rate — not tax advice; consult a CPA.
Schools (NCES district)
- District
- Lewisburg Area SD
- NCES district ID
- 4213590
- Math proficiency
- 65% ▼ -2.00%
- Reading proficiency
- 74% ▼ -7.00%
- Median HH income
- $50,129
- Composite
- 58.94/100
- National rank
- #968
- State rank
- #31 of 539 in PA
Livability — Lewisburg
- Score
- 78/100
- State rank
- #279
- US rank
- #2468
Category grades
Schools grade is shown separately in the Schools card above.
Census & demographics
- Census place
- Lewisburg, PA
- County
- Union County · 18,403 people
- City population
- 18,403
- Metro
- Lewisburg, PA
- Population (ZIP)
- 18,403
- Household income
- $88,975
- Rent vs Own
- Severe rent burden
- 456.0
Population outlook (Union County) Hauer SSP2
- Today (2025)
- 46,664 people
- By 2030
- 47,704 · +2.2%
- By 2040
- 48,798 · +4.6%
- By 2050
- 49,048 · +5.1%
- By 2075
- 47,491 · +1.8%
- By 2100
- 41,817 · -10.4%
Race, ethnicity, and origin ACS 2023
- Neighborhood character
- Predominantly White (86%)
- Race & ethnicity
- White 86% Hispanic / Latino 5% Black 4% Asian 3% Two or more races 3%
- Hispanic origin (detail)
- Puerto Rican 2%
- Common ancestry
- Romanian 2% Italian 2% Lithuanian 2%
- Foreign-born
- 4% · Canada, China, Jamaica
- Languages at home
- 89% English-only · Spanish 4% German/W. Germanic 2% Other Indo-European 2%
Political lean MEDSL · Union
- 2024 margin
- Strong R (+23.4) · D 37.8% · R 61.2%
- 2008→2024 swing
- -8.9pp toward R · 2008: -14.5pp · 2024: -23.4pp
- All cycles
- 2024: R+23.4 2020: R+24.3 2016: R+25.7 2012: R+23.5 2008: R+14.5
Not yet ingested
- Civics
- —
Market trends
- HPI YoY
- ▼ -122.78%
- Current HPI
- 177.9792
- Rent YoY
- —
- Metro
- Lewisburg, PA
- State GDP YoY
- ▲ 1.68%
- F500 in state
- 34
Industry mix (Fortune 500 HQ in PA)
| Industry | F500 HQs | Revenue |
|---|---|---|
| Healthcare | 2 | $309B |
|
||
| Insurance | 2 | $27B |
|
||
| Telecommunications / Media | 1 | $124B |
|
||
| Industrial Distribution | 1 | $22B |
|
||
| Financial Services | 1 | $20B |
|
||
| Chemicals / Materials | 1 | $18B |
|
||
Price history
+128.9% since first listed3 events — show timeline
- 2026-05-02 Pending — BRIGHT MLS
- 2026-04-27 Listed $309,000 BRIGHT MLS
- 2002-06-01 Sold (Public Records) $135,000 Public Records
Property tax history
+1.9%/yrLatest (2026): $5,062 · +1.2% YoY. Source: county tax records.
Cash-flow waterfall
monthlySold comps — $/sqft
last 12 mo · ≤1 miLoading sold comps…