2307 A N School St Unit A · Urban Honolulu, HI
Flood risk 1/10 · Minimal
- FEMA flood zone
- X (unshaded)
- Chance of flooding over 30 yrs
- 0.0%
- Est. flood insurance / yr
- $473 – $860
Fire risk No data
- Est. fire insurance / yr
- —
Heat risk No data
- Hot days now (above threshold)
- —
- Hot days in 30 yrs
- —
Wind risk No data
- Chance of severe wind over 30 yrs
- —
Air-quality risk 1/10 · Minimal
- Unhealthy air days now
- —
- Unhealthy air days in 30 yrs
- —
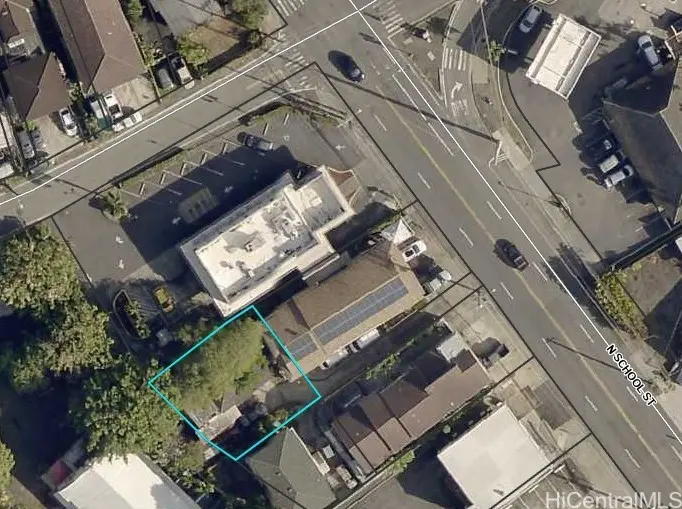
Risk factors via First Street. Map © Google.
Why this score? — see what drove the D grade
The composite is a weighted blend of 9 inputs, each scored 0–100. Each bar is that input's sub-score; the figure is the points it added to the 100-point composite (weight × sub-score).
- ARV discount +15.0/15.0
- Cash flow +11.5/30.0
- Schools +3.7/10.0
- DSCR +3.4/10.0
- Rent growth +2.5/5.0
- Livability +2.5/5.0
- Condition / age +2.5/5.0
- 1% rule +2.2/10.0
- Appreciation +0.0/10.0
$475,000
🖨 Deal sheet (PDF) 📄 Offer letter ✓ Due diligence
Listing remarks MLS
PRICE IMPROVEMENT! Bring your contractor to view this development potential in Kahlihi - Located in town with access to Downtown, Airport & Freeway. Please do not enter the property- Listing is for land value only. To be sold "AS IS". Buyer/Buyer's agent to do due diligence in verifying material facts. The proposed sewer lateral plan was approved in July 2024 by the Wasterwater Branch.
Key facts
- 3,811 sq ft lot
- Parking
- Built 1943
Neighborhood map
What this means for you Summary
Snapshot
- This is a 3-bed/1.0-bath single-family listed at $475k.
Deal economics
- At list price, monthly cash flow is $-157 ($-2k/yr) — negative.
- To cash-flow at today's rent, offer at most $447k (5.9% below list).
- To meet the 1% rule (rent ≥ 1% of price), the offer needs to be $340k (28.3% below list).
- Recommended offer: $340k (28.3% below list) — sets the bar for 1% rule.
- Cap rate 5.9% vs local median 1.5% in Urban Honolulu — top-decile yield for the area; either an underpriced asset or a hidden risk that comps aren't pricing in. Stress-test before assuming the spread holds.
Location & tenants
- Location reads: area grade D — affects rentability + tenant quality, not the cash-flow math above.
- Hawaii Department Of Education (suburban): math 32% / reading 50% proficiency, ranked #1 of 1 in HI (top 100%) — families likely to look elsewhere, expect single-tenant / working-renter base with shorter leases.
- Zoned schools: Kalihi Waena Elementary School (math 14% / reading 28%, grade F, #157 of 183 statewide, top 87%, 465 students, 64% FRL); Governor Sanford B Dole Middle School (math 8% / reading 24%, grade F, #41 of 42 statewide, top 98%, 530 students, 78% FRL); Governor Wallace Rider Farrington High School (math 17% / reading 57%, grade F, #29 of 43 statewide, top 67%, 2,238 students, 54% FRL) — zoned schools average 65% FRL vs 39% district-wide (26 pts higher); higher-poverty schools than district average — tighter screening recommended.
- Zoned-school proficiency averages 25% at this address vs 41% district-wide (-16 pts) — the specific schools serving this property underperform the Hawaii Department Of Education average; the district grade overstates school quality for this exact location.
- Market conditions: 41 active listings in the ZIP; 8 comparable units currently listed for rent nearby; rentals at typical pace (median 23d on market — plan ~3-4 weeks tenant-placement turnaround); solid renter incomes; 1,638 units permitted in Honolulu County in 2024 (793 in 5+ unit buildings).
- This rent runs 41% of the median local income ($100k/yr) — at the standard rent-burdened threshold; future hikes will face affordability resistance.
Forward outlook
- Local home prices are declining (-3.0%/yr); year-one equity from $3k of loan paydown is wiped out by about $14k of value loss. Plan a longer hold.
- Honolulu County population projected at +17% by 2050 — long-run rental-demand tailwind backs the buy-and-hold thesis.
Negotiation context
- It's been on market 103 days — a 9% lower offer ($432k) is reasonable based on typical stale-listing flexibility.
- 7 sale attempts since 4y ago with the ask held roughly flat each time — persistent listings suggest the price (not the market) is what's stuck; bring a comps-based counter.
- Current owner paid $400k; 19% above their basis — modest negotiation headroom, anchor on the comps not their cost.
Risks & watch-outs
- Watch-outs: built in 1943 — expect roof / HVAC / electrical / plumbing capex.
Questions for the listing agent
- What do current leases actually rent for vs. the listed asking? Can we see a recent rent roll and the last 12 months of T-12 income?
- It's been on market 103 days. Have you received any prior offers? Is the seller open to a 28% concession, seller financing, or rate buy-down credit?
- Built in 1943 — when were the roof, HVAC, electrical panel, plumbing, and water heater last replaced?
- Why hasn't it sold? Are there any deal-killer items the seller is aware of (foundation, flood, title, zoning, code violations)?
- Is there a deadline driving the sale (1031 exchange, divorce, estate, relocation)? That informs how much negotiation room exists.
- The area grade is low — what's the realistic commute time and amenity access for the typical tenant pool here? Any planned neighborhood developments (good or bad) we should know about?
- What's the average days-on-market for RENTAL listings here right now (not sales)? A rising rental-DOM trend means longer vacancies and softer asking-rent achievability than the comps imply.
- What's the recent tenant-quality profile in this submarket — average credit score on applications, eviction rate, late-payment / NSF rate, and stable-employment percentage? A property-management company in the area should have these aggregated.
- How much new for-sale + rental construction is in the pipeline within 1–3 miles? Heavy new supply typically softens prices + rents 12–24 months out; constrained supply supports both.
Investment metrics
- 1% rule
- 0.72% ✗
- Cap rate
- 5.90%
- Cash-on-cash
- -1.42%
- DSCR
- 0.94
- GRM
- 11.6
CMA / ARV
- ARV (median comp)
- $867,376
- List price
- $475,000
- Delta
- -45.24%
- Verdict
- UNDERPRICED
- Comps
- 20 within 1.0 mi
Show comp detail 2 sales within ~0.75 mi
| Address | Dist | Beds/Ba | Sqft | Sold | Price | $/sf | Match |
|---|---|---|---|---|---|---|---|
| 1620 Hauiki St | 0.10mi | 3/2.0 | 1,028 (-11%) | 16mo | $800,000 | $778 | 60 |
| 2211 Kalihi St Unit A | 0.72mi | 3/2.0 | 1,008 (-12%) | 9mo | $873,000 | $866 | 34 |
Match score weights: distance 35% · size 25% · config 20% · recency 20%. Top-matched comps best support the ARV.
Projected returns pro-forma
-3.0% appreciation · 3.0% rent growth · sell at horizon
- IRR
- -18.7%
- Equity multiple
- 0.34×
- Total profit
- $-87,216
- Equity at exit
- $70,824
- IRR
- -11.3%
- Equity multiple
- 0.33×
- Total profit
- $-89,740
- Equity at exit
- $41,069
Cash invested: $133,000 (down + closing). Projections, not guarantees.
Landlord ↔ Tenant lean methodology
- Overall (STATE)
- 37 Tenant-Leaning
- State Hawaii
- 37 Tenant-Leaning · D+13
- County
- — inherits STATE
- City
- — inherits STATE
ZIP-level market 96819
- Active inventory
- 41
- Price-to-rent
- 11.6×
Monthly cashflow live
- Estimated rent
- $3,403 high interval (Pro) →
- Mortgage (P&I)
- −$2,491
- Tax from tax record
- −$157 /mo · $1,887/yr
- Insurance
- −$198
- HOA
- −$0
- Vacancy / Maint / Mgmt
- −$715
- Net cashflow
- $-157
Break-even live
Sensitivity live
| Price | -10% $111 | -5% $-23 | +0% $-157 | +5% $-292 | +10% $-426 |
|---|---|---|---|---|---|
| Rent | -10% $-426 | -5% $-292 | +0% $-157 | +5% $-23 | +10% $111 |
| Rate | -1.0pp $82 | -0.5pp $-37 | base $-157 | +0.5pp $-281 | +1.0pp $-406 |
UW: 25.0% down · 7.5% · 30yr · 1.5% tax · 5.0% vac · 8.0% maint · 8.0% mgmt
Financing live
Cash to close
- Down payment
- $118,750
- Closing costs
- $14,250
- Reserves months
- —
- Total cash needed
- —
Loan-product check · same deal, 3 products live
Conventional
25% down · 7.5% · 30yr
- Down + closing
- —
- Monthly P&I
- —
- Monthly cashflow
- —
- DSCR
- —
- Eligible?
- —
Personal DTI + credit; lowest rate.
DSCR
20% down · 8.5% · 30yr
- Down + closing
- —
- Monthly P&I
- —
- Monthly cashflow
- —
- DSCR
- —
- Eligible?
- —
No personal income docs; deal must DSCR.
Hard money
10% down · 12.0% · 12mo
- Down + closing
- —
- Monthly P&I
- —
- Monthly cashflow
- —
- DSCR
- —
- Eligible?
- —
Short-term bridge; refi at stabilization.
Rent comps 8 comps
| Address | Beds | Baths | Sqft | Rent | $/sqft | DOM | Units | Dist |
|---|---|---|---|---|---|---|---|---|
| 2429 N School St Unit Fd Honolulu, HI | 3.0 | 1.0 | 750 | $2,850 | $3.80 | 25d | 1 | 0.07mi |
| 1674 Kino St Unit 3 Bedroom Honolulu, HI | 3.0 | 1.0 | 1000 | $3,600 | $3.60 | 25d | 1 | 0.19mi |
| 2128 Gertz Ln Unit D Honolulu, HI | 3.0 | 1.0 | 1100 | $3,000 | $2.73 | 13d | 1 | 0.25mi |
| 1905 Naio St #1 Honolulu, HI | 3.0 | 2.0 | 1000 | $3,700 | $3.70 | 19d | 1 | 1.02mi |
| 2182 Makanani Dr Honolulu, HI | 3.0 | 2.0 | 1067 | $4,300 | $4.03 | 25d | 1 | 1.16mi |
| 1835 Akone Pl Unit D Honolulu, HI | 3.0 | 1.0 | 805 | $2,950 | $3.66 | 5d | 1 | 1.24mi |
| 1716 Kuikele St Unit Left 2 Bed Honolulu, HI | 2.0 | 1.0 | 750 | $2,685 | $3.58 | 19d | 1 | 1.44mi |
| 654 N Judd St #658 Honolulu, HI | 3.0 | 2.0 | 1166 | $5,800 | $4.97 | 23d | 1 | 1.48mi |
Listing history 43 events
-
2026-06-21days on market $475,000 Active 103 DOM
-
2026-06-18days on market $475,000 Active 100 DOM
-
2026-06-17days on market $475,000 Active 99 DOM
-
2026-06-16days on market $475,000 Active 98 DOM
-
2026-06-15days on market $475,000 Active 97 DOM
-
2026-06-13days on market $475,000 Active 95 DOM
-
2026-06-13days on market $475,000 Active 94 DOM
-
2026-06-10days on market $475,000 Active 92 DOM
-
2026-06-09days on market $475,000 Active 91 DOM
-
2026-06-08days on market $475,000 Active 90 DOM
-
2026-06-07days on market $475,000 Active 89 DOM
-
2026-06-05days on market $475,000 Active 86 DOM
-
2026-06-03days on market $475,000 Active 85 DOM
-
2026-06-02days on market $475,000 Active 84 DOM
-
2026-06-01days on market $475,000 Active 83 DOM
-
2026-05-31days on market $475,000 Active 82 DOM
-
2026-04-20price $475,000 404-char remark
Show marketing remark (404 chars)
PRICE IMPROVEMENT! Bring your contractor to view this development potential in Kahlihi - Located in town with access to Downtown, Airport & Freeway. Please do not enter the property- Listing is for land value only. To be sold "AS IS". Buyer/Buyer's agent to do due diligence in verifying material facts. The proposed sewer lateral plan was approved in July 2024 by the Wasterwater Branch.
-
2026-03-09$499,000 Active 404-char remark
Show marketing remark (404 chars)
PRICE IMPROVEMENT! Bring your contractor to view this development potential in Kahlihi - Located in town with access to Downtown, Airport & Freeway. Please do not enter the property- Listing is for land value only. To be sold "AS IS". Buyer/Buyer's agent to do due diligence in verifying material facts. The proposed sewer lateral plan was approved in July 2024 by the Wasterwater Branch.
-
2025-12-10historical
-
2025-07-15price $550,000
-
2025-06-08price $570,000
-
2025-05-14price $599,000
-
2025-05-01$650,000 Active
-
2023-09-15soldstatus $400,000 Sold
-
2023-09-05status Pending
-
2023-08-11$460,000 Active
-
2023-08-10historical
-
2023-08-09price $460,000
-
2023-08-07price $475,000
-
2023-07-31price $500,000
-
2023-06-23$555,000 Active
-
2023-06-19historical
-
2023-05-16price $555,000
-
2023-05-04$575,000 Active
-
2023-05-01historical
-
2023-04-03price $575,000
-
2022-11-14price $549,000
-
2022-10-31price $595,000
-
2022-10-23price $625,000
-
2022-09-16$655,000 Active
-
2022-08-10soldstatus $478,000 Sold
-
2022-05-07status Pending
-
2022-03-21$500,000 Active
ⓘ Source: listings_history table (triggers on properties + properties_extension) + one-shot
backfill from property_details.listing_events for pre-trigger history.
Tax reassessment forecast HI · Partial reset (capped growth)
- Current annual tax
- $1,887 · $157/mo
- Projected year-2 tax
- $1,887 · $157/mo
- Expected delta
- $0/yr ($0/mo · 0.0%)
ⓘ Screening estimate from a state-policy table — verify with the county assessor before closing.
Climate risk First Street
- Flood 1/10 Low FEMA zone X (unshaded) · 0% chance over 30 yrs
- Air quality 1/10 Low
Nearby sold comps map
Loading sold comps map…
Walkable amenities ~0.75 mi
Loading nearby amenities…
Taxation est. · year 1
- Rental income
- $40,841
- − Mortgage interest
- −$26,607
- − Property taxes
- −$1,887
- − Insurance
- −$2,375
- − Repairs & maintenance
- −$3,267
- − Management
- −$3,267
- − Depreciation
- −$13,818
- Taxable loss
- −$10,382
- Est. tax savings @ 24.0%
- +$2,492
- After-tax cash flow
- $602/yr
For passive investors: Depreciation is non-cash, so a rental often shows a tax loss while cash-flowing — sheltering income. Rental losses are passive: they offset passive income freely, and up to $25,000/yr can offset ordinary (W-2) income if you actively participate and your MAGI is under $100k (phasing out to $0 by $150k); unused losses carry forward. On sale, claimed depreciation is recaptured at up to 25%, and gains may owe capital-gains tax (a 1031 exchange can defer both). Figures are a year-1 estimate at your 24.0% rate — not tax advice; consult a CPA.
Schools (NCES district)
- District
- Hawaii Department Of Education
- NCES district ID
- 1500030
- Math proficiency
- 32% ▼ -10.00%
- Reading proficiency
- 50% ▼ -3.00%
- Median HH income
- $69,005
- Composite
- 37.07/100
- National rank
- #4504
- State rank
- #1 of 1 in HI
Livability — Urban Honolulu
No livability data for this city. (Only ~50 U.S. cities are tracked.)
Census & demographics
- Census place
- Urban Honolulu, HI
- County
- Honolulu County · 963,448 people
- City population
- 309,956
- Metro
- Urban Honolulu, HI
- Population (ZIP)
- 50,345
- Household income
- $99,848
- Rent vs Own
- Severe rent burden
- 1385.0
Population outlook (Honolulu County) Hauer SSP2
- Today (2025)
- 1,072,641 people
- By 2030
- 1,110,460 · +3.5%
- By 2040
- 1,181,593 · +10.2%
- By 2050
- 1,257,584 · +17.2%
- By 2075
- 1,501,120 · +39.9%
- By 2100
- 1,764,430 · +64.5%
Race, ethnicity, and origin ACS 2023
- Neighborhood character
- Diverse neighborhood (Simpson 0.65)
- Race & ethnicity
- Asian 59% Two or more races 16% Pacific Islander 14% White 7% Hispanic / Latino 6% Black 1%
- Hispanic origin (detail)
- Mexican 1% Puerto Rican 2%
- Common ancestry
- Russian 2% Portuguese 1% Romanian 1%
- Foreign-born
- 37% · China, Vietnam, South Korea
- Languages at home
- 54% English-only · Other Asian/Pacific 26% Tagalog/Filipino 13% Chinese 3%
Political lean MEDSL · Honolulu
- 2024 margin
- Strong D (+21.6) · D 59.9% · R 38.3% · Other 1.8%
- 2008→2024 swing
- -19.4pp toward R · 2008: 41.1pp · 2024: 21.6pp
- All cycles
- 2024: D+21.6 2020: D+26.9 2016: D+29.9 2012: D+39.1 2008: D+41.1
Not yet ingested
- Civics
- —
Market trends
- HPI YoY
- ▼ -409.34%
- Current HPI
- 399.7421
- Rent YoY
- —
- Metro
- Urban Honolulu, HI
- State GDP YoY
- —
- F500 in state
- 0
Price history
-5.0% since first listed27 events — show timeline
- 2026-04-20 Price Changed $475,000 HiCentral MLS
- 2026-03-09 Listed $499,000 HiCentral MLS
- 2025-12-10 Listing Removed — HiCentral MLS
- 2025-07-15 Price Changed $550,000 HiCentral MLS
- 2025-06-08 Price Changed $570,000 HiCentral MLS
- 2025-05-14 Price Changed $599,000 HiCentral MLS
- 2025-05-01 Listed $650,000 HiCentral MLS
- 2023-09-15 Sold (MLS) $400,000 HiCentral MLS
- 2023-09-05 Pending — HiCentral MLS
- 2023-08-11 Listed $460,000 HiCentral MLS
- 2023-08-10 Listing Removed — HiCentral MLS
- 2023-08-09 Price Changed $460,000 HiCentral MLS
- 2023-08-07 Price Changed $475,000 HiCentral MLS
- 2023-07-31 Price Changed $500,000 HiCentral MLS
- 2023-06-23 Listed $555,000 HiCentral MLS
- 2023-06-19 Listing Removed — HiCentral MLS
- 2023-05-16 Price Changed $555,000 HiCentral MLS
- 2023-05-04 Listed $575,000 HiCentral MLS
- 2023-05-01 Listing Removed — HiCentral MLS
- 2023-04-03 Price Changed $575,000 HiCentral MLS
- 2022-11-14 Price Changed $549,000 HiCentral MLS
- 2022-10-31 Price Changed $595,000 HiCentral MLS
- 2022-10-23 Price Changed $625,000 HiCentral MLS
- 2022-09-16 Listed $655,000 HiCentral MLS
- 2022-08-10 Sold (MLS) $478,000 HiCentral MLS
- 2022-05-07 Pending — HiCentral MLS
- 2022-03-21 Listed $500,000 HiCentral MLS
Property tax history
+6.4%/yrLatest (2022): $1,887 · +0.7% YoY. Source: county tax records.
Cash-flow waterfall
monthlySold comps — $/sqft
last 12 mo · ≤1 miLoading sold comps…