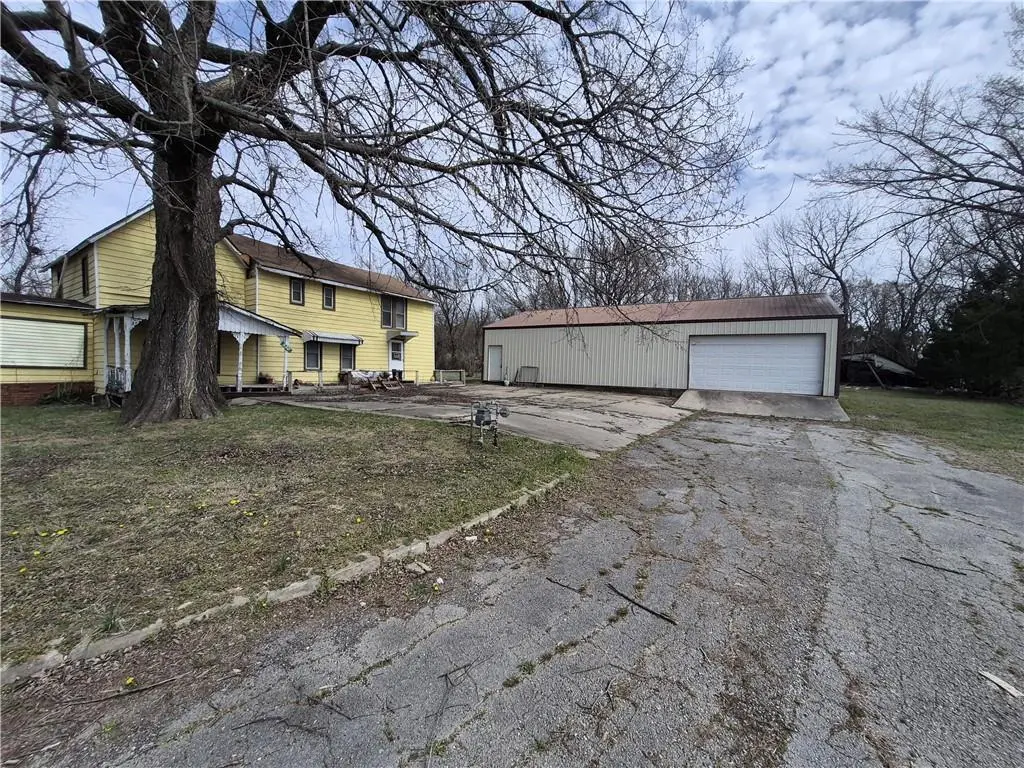
10823 Harper Rd · Fredonia, KS
Flood risk 1/10 · Minimal
- FEMA flood zone
- X (unshaded)
- Chance of flooding over 30 yrs
- 0.0%
- Est. flood insurance / yr
- $507 – $1,088
Fire risk 2/10 · Minimal
- Est. fire insurance / yr
- $1,154 – $2,142
Heat risk 5/10 · Moderate
- Hot days now (above 108°F)
- 7 days/yr
- Hot days in 30 yrs
- 18 days/yr
Wind risk 2/10 · Minimal
- Chance of severe wind over 30 yrs
- 2.0%
Air-quality risk 2/10 · Minimal
- Unhealthy air days now
- 2 days/yr
- Unhealthy air days in 30 yrs
- 2 days/yr
Risk factors via First Street. Map © Google.
Why this score? — see what drove the D+ grade
The composite is a weighted blend of 9 inputs, each scored 0–100. Each bar is that input's sub-score; the figure is the points it added to the 100-point composite (weight × sub-score).
- Cash flow +15.0/30.0
- ARV discount +7.5/15.0
- 1% rule +5.0/10.0
- DSCR +5.0/10.0
- Appreciation +4.4/10.0
- Livability +3.5/5.0
- Rent growth +2.5/5.0
- Condition / age +2.5/5.0
- Schools +2.0/10.0
$30,000
🖨 Deal sheet (PDF) 📄 Offer letter ✓ Due diligence
Key facts
- Concrete floor
- 1.2 acre lot
- 2 garage spots
Tags
Property features AI
Finance
- Financial info: Tax amount listed (not included per instructions)
- HOA & community: No association fees
Exterior
- Parking: Detached 2-car garage
- Utilities: Public water; Lagoon sewer
- Home design: Residential property; Other subtype; 2-story floor plan; Facing/entry level not specified
- Construction: Wood siding exterior; Composition roof; Approximately 101 years or older
- Exterior features: 1.2-acre lot; Flood plain status unknown; Directions: From Fredonia, KS go south on Harper Rd, cross railroad tracks; property is on the east side of the road.; Maintenance provided
Interior
- Bedrooms: 4 bedrooms (three on the second floor, one on the first floor)
- Bathrooms: 2 full bathrooms
- Heating & cooling: Wood heating; No cooling
- Interior features: Crawl space basement; One fireplace
Neighborhood map
What this means for you Summary
Snapshot
- This is a 4-bed/2.0-bath single-family listed at $30k.
Deal economics
- At list price, monthly cash flow is $810 ($10k/yr) — positive.
- The deal already cash-flows at list — no discount required.
- Meets the 1% rule at list price ($1k rent vs $30k).
- Recommended offer: $29k (3.0% below list) — sets the bar for market timing.
Location & tenants
- Location reads 70/100 on livability (#155 in KS) — a middle-class / working-renter tenant base. Strengths: cost of living A+, housing A+, health & safety A+; Watch: crime D+, schools F, amenities F.
- Fredonia (rural): math 19% / reading 30% proficiency, ranked #147 of 169 in KS (top 87%) — low school quality limits family demand, transient renter base, plan for 1-2y turnover.
- Market conditions: 18 active listings in the ZIP; 16 units permitted in Wilson County in 2024 (0 in 5+ unit buildings).
Forward outlook
- Local home prices are declining (-1.1%/yr); year-one equity from $207 of loan paydown is wiped out by about $333 of value loss. Plan a longer hold.
- Wilson County population projected at -25% by 2050 — secular population decline; favor cash flow + early exit over multi-decade hold.
- At projected returns (-1.1% appreciation + 3.0% rent growth), your $8k cash investment doubles in ~1 year — after that, you're playing with house money.
Negotiation context
- It's been on market 37 days — a 3% lower offer ($29k) is reasonable based on typical stale-listing flexibility.
- 2 sale attempts since 10y ago with the ask held roughly flat each time — persistent listings suggest the price (not the market) is what's stuck; bring a comps-based counter.
- Current owner paid $25k; 20% above their basis — modest negotiation headroom, anchor on the comps not their cost.
Risks & watch-outs
- Watch-outs: built in 1920 — expect roof / HVAC / electrical / plumbing capex.
- Climate carrying-cost: extreme-heat days projected 7→18/yr by 2055 (HVAC capex compounding) — expect insurance premiums to compound above CPI over the hold.
Questions for the listing agent
- It's been on market 37 days. Have you received any prior offers? Is the seller open to a 3% concession, seller financing, or rate buy-down credit?
- Built in 1920 — when were the roof, HVAC, electrical panel, plumbing, and water heater last replaced?
- Is there a deadline driving the sale (1031 exchange, divorce, estate, relocation)? That informs how much negotiation room exists.
- Schools are F-rated, which usually means shorter tenancies and higher turnover. Who's the typical renter profile here, and what's been the actual vacancy rate?
- Crime grade is D in this area — have there been break-ins, vandalism, or insurance claims at this property in the last 3 years? What carrier currently insures it and at what premium?
- The area grade is low — what's the realistic commute time and amenity access for the typical tenant pool here? Any planned neighborhood developments (good or bad) we should know about?
- What's the average days-on-market for RENTAL listings here right now (not sales)? A rising rental-DOM trend means longer vacancies and softer asking-rent achievability than the comps imply.
- What's the recent tenant-quality profile in this submarket — average credit score on applications, eviction rate, late-payment / NSF rate, and stable-employment percentage? A property-management company in the area should have these aggregated.
- How much new for-sale + rental construction is in the pipeline within 1–3 miles? Heavy new supply typically softens prices + rents 12–24 months out; constrained supply supports both.
Investment metrics
- 1% rule
- 4.29% ✓
- Cap rate
- 38.70%
- Cash-on-cash
- 115.72%
- DSCR
- 6.15
- GRM
- 1.9
CMA / ARV
- ARV (on-the-fly)
- $157,929
- Comps found
- 5
Show comp detail 5 sales within ~0.75 mi
| Address | Dist | Beds/Ba | Sqft | Sold | Price | $/sf | Match |
|---|---|---|---|---|---|---|---|
| 10823 Harper Rd | 0.00mi | 4/2.0 | 2,589 (0%) | 1mo | $30,000 | $12 | 100 |
| 202 N 6th St | 0.55mi | 3/2.0 (-1) | 2,440 (-6%) | 7mo | $156,000 | $64 | 54 |
| 121 N 6th St | 0.49mi | 4/1.5 | 2,391 (-8%) | 14mo | $129,999 | $54 | 51 |
| 103 S 8th St | 0.53mi | 5/2.0 (+1) | 2,918 (+13%) | 22mo | $179,000 | $61 | 31 |
| 7839 1000 Rd | 0.67mi | 3/2.0 (-1) | 2,306 (-11%) | 18mo | $254,999 | $111 | 30 |
Match score weights: distance 35% · size 25% · config 20% · recency 20%. Top-matched comps best support the ARV.
Projected returns pro-forma
-1.11% appreciation · 3.0% rent growth · sell at horizon
- IRR
- —
- Equity multiple
- 6.86×
- Total profit
- $49,206
- Equity at exit
- $7,085
- IRR
- —
- Equity multiple
- 14.29×
- Total profit
- $111,653
- Equity at exit
- $7,306
Cash invested: $8,400 (down + closing). Projections, not guarantees.
Landlord ↔ Tenant lean methodology
- Overall (STATE)
- 83 Strongly Landlord-Friendly
- State Kansas
- 83 Strongly Landlord-Friendly · R+10
- County
- — inherits STATE
- City
- — inherits STATE
ZIP-level market 66736
- Home prices YoY
- -0.7%
- Active inventory
- 18
- Price-to-rent
- 1.9×
Monthly cashflow live
- Estimated rent
- $1,288 medium interval (Pro) →
- Mortgage (P&I)
- −$157
- Tax est. 1.5%
- −$38 /mo · $450/yr
- Insurance
- −$12
- HOA
- −$0
- Vacancy / Maint / Mgmt
- −$270
- Net cashflow
- $810
Break-even live
Sensitivity live
| Price | -10% $831 | -5% $820 | +0% $810 | +5% $800 | +10% $789 |
|---|---|---|---|---|---|
| Rent | -10% $708 | -5% $759 | +0% $810 | +5% $861 | +10% $912 |
| Rate | -1.0pp $825 | -0.5pp $818 | base $810 | +0.5pp $802 | +1.0pp $794 |
UW: 25.0% down · 7.5% · 30yr · 1.5% tax · 5.0% vac · 8.0% maint · 8.0% mgmt
Financing live
Cash to close
- Down payment
- $7,500
- Closing costs
- $900
- Reserves months
- —
- Total cash needed
- —
Loan-product check · same deal, 3 products live
Conventional
25% down · 7.5% · 30yr
- Down + closing
- —
- Monthly P&I
- —
- Monthly cashflow
- —
- DSCR
- —
- Eligible?
- —
Personal DTI + credit; lowest rate.
DSCR
20% down · 8.5% · 30yr
- Down + closing
- —
- Monthly P&I
- —
- Monthly cashflow
- —
- DSCR
- —
- Eligible?
- —
No personal income docs; deal must DSCR.
Hard money
10% down · 12.0% · 12mo
- Down + closing
- —
- Monthly P&I
- —
- Monthly cashflow
- —
- DSCR
- —
- Eligible?
- —
Short-term bridge; refi at stabilization.
Listing history 6 events
-
2026-04-29status Pending
-
2026-03-23$30,000 Active
-
2020-06-05historical
-
2016-06-06$64,500
-
1996-02-01soldstatus $25,000
-
1994-04-01soldstatus
ⓘ Source: listings_history table (triggers on properties + properties_extension) + one-shot
backfill from property_details.listing_events for pre-trigger history.
Climate risk First Street
- Flood 1/10 Low FEMA zone X (unshaded) · 0% chance over 30 yrs
- Wildfire 2/10 Low
- Heat 5/10 Major 7 d/yr ≥108°F today · 18 d/yr by 30 yrs out
- Wind 2/10 Low 2% chance of damaging wind over 30 yrs
- Air quality 2/10 Low 2 unhealthy d/yr today · 2 by 30 yrs out
Nearby sold comps map
Loading sold comps map…
Walkable amenities ~0.75 mi
Loading nearby amenities…
Taxation est. · year 1
- Rental income
- $15,454
- − Mortgage interest
- −$1,680
- − Property taxes
- −$450
- − Insurance
- −$150
- − Repairs & maintenance
- −$1,236
- − Management
- −$1,236
- − Depreciation
- −$873
- Taxable income
- $9,828
- Est. tax owed @ 24.0%
- −$2,359
- After-tax cash flow
- $7,362/yr
For passive investors: Depreciation is non-cash, so a rental often shows a tax loss while cash-flowing — sheltering income. Rental losses are passive: they offset passive income freely, and up to $25,000/yr can offset ordinary (W-2) income if you actively participate and your MAGI is under $100k (phasing out to $0 by $150k); unused losses carry forward. On sale, claimed depreciation is recaptured at up to 25%, and gains may owe capital-gains tax (a 1031 exchange can defer both). Figures are a year-1 estimate at your 24.0% rate — not tax advice; consult a CPA.
Schools (NCES district)
- District
- Fredonia
- NCES district ID
- 2006270
- Math proficiency
- 19% ▲ 7.00%
- Reading proficiency
- 30% ▲ 11.00%
- Median HH income
- $36,652
- Composite
- 20.33/100
- National rank
- #8609
- State rank
- #147 of 169 in KS
Livability — Fredonia
- Score
- 70/100
- State rank
- #155
- US rank
- #7426
Category grades
Schools grade is shown separately in the Schools card above.
Census & demographics
- Population (ZIP)
- 3,517
Population outlook (Wilson County) Hauer SSP2
- Today (2025)
- 7,872 people
- By 2030
- 7,383 · -6.2%
- By 2040
- 6,533 · -17.0%
- By 2050
- 5,923 · -24.8%
- By 2075
- 5,134 · -34.8%
- By 2100
- 4,788 · -39.2%
Race, ethnicity, and origin ACS 2023
- Neighborhood character
- Predominantly White (90%)
- Race & ethnicity
- White 90% Two or more races 6% Hispanic / Latino 4%
- Common ancestry
- Italian 2% Iranian 2% Slovak 2%
- Foreign-born
- 2% · Canada
- Languages at home
- 97% English-only · Spanish 2%
Political lean MEDSL · Wilson
- 2024 margin
- Solid R (+62.4) · D 18.0% · R 80.3% · Other 1.7%
- 2008→2024 swing
- -21.6pp toward R · 2008: -40.8pp · 2024: -62.4pp
- All cycles
- 2024: R+62.4 2020: R+61.5 2016: R+63.1 2012: R+54.0 2008: R+40.8
Not yet ingested
- Civics
- —
Market trends
- HPI YoY
- ▼ -1.11%
- Current HPI
- 153.1194
- Rent YoY
- —
- Metro
- —
- State GDP YoY
- —
- F500 in state
- 0
Price history
+20.0% since first listed6 events — show timeline
- 2026-04-29 Pending — Heartland MLS as Distributed by MLS Grid
- 2026-03-23 Listed $30,000 Heartland MLS as Distributed by MLS Grid
- 2020-06-05 Listing Removed — Heartland MLS as Distributed by MLS Grid
- 2016-06-06 Listed $64,500 Heartland MLS as Distributed by MLS Grid
- 1996-02-01 Sold (Public Records) $25,000 Public Records
- 1994-04-01 Sold (Public Records) — Public Records
Cash-flow waterfall
monthlySold comps — $/sqft
last 12 mo · ≤1 miLoading sold comps…