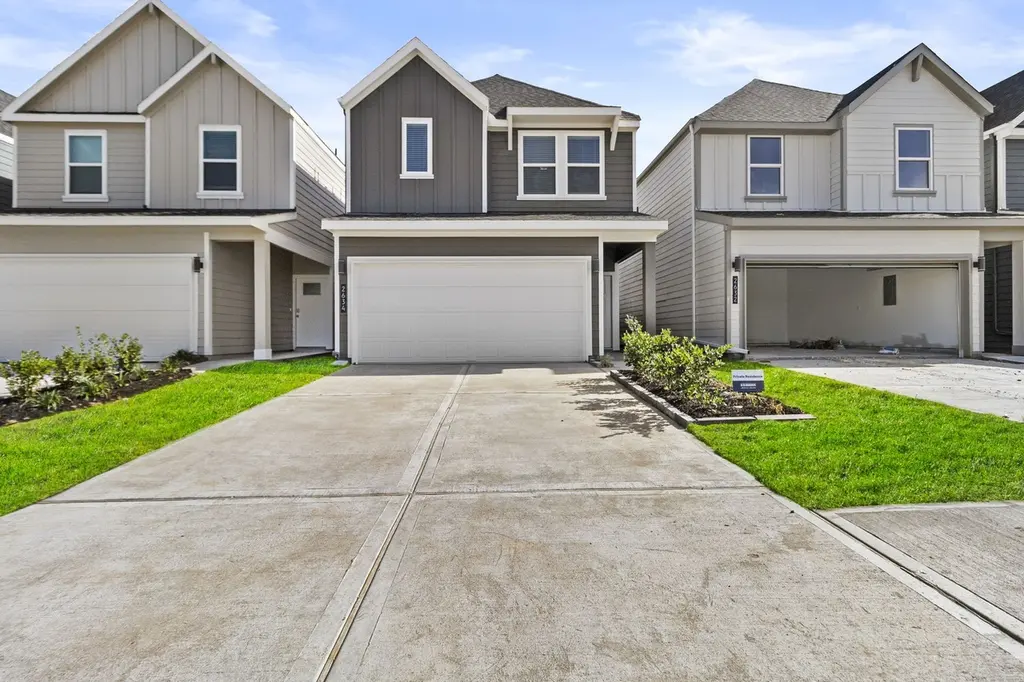
2634 Afton Heights Way · Houston, TX
Flood risk No data
- FEMA flood zone
- —
- Chance of flooding over 30 yrs
- —
- Est. flood insurance / yr
- —
Fire risk No data
- Est. fire insurance / yr
- —
Heat risk No data
- Hot days now (above threshold)
- —
- Hot days in 30 yrs
- —
Wind risk No data
- Chance of severe wind over 30 yrs
- —
Air-quality risk No data
- Unhealthy air days now
- —
- Unhealthy air days in 30 yrs
- —
Risk factors via First Street. Map © Google.
Why this score? — see what drove the D grade
The composite is a weighted blend of 9 inputs, each scored 0–100. Each bar is that input's sub-score; the figure is the points it added to the 100-point composite (weight × sub-score).
- Appreciation +10.0/10.0
- ARV discount +9.1/15.0
- Cash flow +7.1/30.0
- Rent growth +3.7/5.0
- Livability +3.7/5.0
- Schools +2.7/10.0
- Condition / age +2.5/5.0
- 1% rule +2.4/10.0
- DSCR +1.3/10.0
$299,000
🖨 Deal sheet 📄 Offer letter ✓ Due diligence
Listing remarks MLS
This thoughtfully designed two-story home offers 4 bedrooms, 2.5 bathrooms, a loft, and a 2-car garage, combining modern style with everyday functionality. The open-concept layout seamlessly connects the kitchen, dining, and living areas, creating an ideal space for entertaining and daily living. The kitchen features ample counter space, pantry storage, and a central island for prep and gathering. The first-floor primary suite includes a walk-in closet and private bath, offering a comfortable retreat. Upstairs features a versatile loft along with three secondary bedrooms and a full bathroom, providing flexibility for guests, work, or play. Additional highlights include energy-efficient construction, modern finishes, and a functional layout. Conveniently located near major highways, shopping, dining, and city amenities.
Key facts
- 3,105 sq ft lot
- 2 garage spots
- Built 2025
Neighborhood map
What this means for you Summary
Snapshot
- This is a 3-bed/2.5-bath land listed at $299k.
Deal economics
- At list price, monthly cash flow is $-421 ($-5k/yr) — negative.
- To cash-flow at today's rent, offer at most $238k (20.4% below list).
- To meet the 1% rule (rent ≥ 1% of price), the offer needs to be $223k (25.6% below list).
- Recommended offer: $223k (25.6% below list) — sets the bar for 1% rule.
- Cap rate 4.6% vs local median 3.2% in Houston — top-decile yield for the area; either an underpriced asset or a hidden risk that comps aren't pricing in. Stress-test before assuming the spread holds.
Location & tenants
- Location reads 74/100 on livability (#184 in TX, #4,771 nationally) — a middle-class / working-renter tenant base. Strengths: amenities A+, cost of living A+, housing A+; Watch: schools D, crime F.
- Houston ISD (urban): math 27% / reading 35% proficiency, ranked #593 of 826 in TX (top 72%) — families likely to look elsewhere, expect single-tenant / working-renter base with shorter leases; 71% free/reduced lunch — lower-income household profile, screen leases tightly.
- Market conditions: Rents rising fast (+4.8%/yr); 312 active listings in the ZIP; 15 comparable units currently listed for rent nearby; rentals at typical pace (median 21d on market — plan ~3-4 weeks tenant-placement turnaround); 40% of comp listings sitting > 30 days — soft ceiling on asking rent; lower-income renter base — watch delinquency; 29,883 units permitted in Harris County in 2024 (8,621 in 5+ unit buildings).
- At $2,225/mo this rent would consume 71% of the median local household income ($37k/yr) (locally 1446% of renters already pay >50% of income on rent) — very limited rent-growth headroom before tenants either downsize or default.
Forward outlook
- In year one you build about $32k of equity ($2k loan paydown + $30k appreciation (10.0% local appreciation)).
- Harris County population projected at +47% by 2050 — long-run rental-demand tailwind backs the buy-and-hold thesis.
- By year 2, paydown + projected appreciation supports a ~$51k cash-out refi (75% LTV) — recoverable capital for the next deal without selling this one.
Negotiation context
- It's been on market 69 days — a 6% lower offer ($281k) is reasonable based on typical stale-listing flexibility.
Questions for the listing agent
- What do current leases actually rent for vs. the listed asking? Can we see a recent rent roll and the last 12 months of T-12 income?
- It's been on market 69 days. Have you received any prior offers? Is the seller open to a 26% concession, seller financing, or rate buy-down credit?
- What does the HOA fee cover, when was the last increase, and are there any pending special assessments or reserve-fund shortfalls?
- Why hasn't it sold? Are there any deal-killer items the seller is aware of (foundation, flood, title, zoning, code violations)?
- Is there a deadline driving the sale (1031 exchange, divorce, estate, relocation)? That informs how much negotiation room exists.
- Schools are D-rated, which usually means shorter tenancies and higher turnover. Who's the typical renter profile here, and what's been the actual vacancy rate?
- Crime grade is F in this area — have there been break-ins, vandalism, or insurance claims at this property in the last 3 years? What carrier currently insures it and at what premium?
- The area grade is low — what's the realistic commute time and amenity access for the typical tenant pool here? Any planned neighborhood developments (good or bad) we should know about?
- What's the average days-on-market for RENTAL listings here right now (not sales)? A rising rental-DOM trend means longer vacancies and softer asking-rent achievability than the comps imply.
- What's the recent tenant-quality profile in this submarket — average credit score on applications, eviction rate, late-payment / NSF rate, and stable-employment percentage? A property-management company in the area should have these aggregated.
- How much new for-sale + rental construction is in the pipeline within 1–3 miles? Heavy new supply typically softens prices + rents 12–24 months out; constrained supply supports both.
Investment metrics
- 1% rule
- 0.74% ✗
- Cap rate
- 4.60%
- Cash-on-cash
- -6.04%
- DSCR
- 0.73
- GRM
- 11.2
CMA / ARV
- ARV (median comp)
- $310,123
- List price
- $299,000
- Delta
- -3.59%
- Verdict
- FAIR
- Comps
- 20 within 1.0 mi
Projected returns pro-forma
10.0% appreciation · 4.77% rent growth · sell at horizon
- IRR
- 20.5%
- Equity multiple
- 2.67×
- Total profit
- $140,136
- Equity at exit
- $269,363
- IRR
- 19.1%
- Equity multiple
- 6.29×
- Total profit
- $442,785
- Equity at exit
- $580,891
Cash invested: $83,720 (down + closing). Projections, not guarantees.
Landlord ↔ Tenant lean methodology
- Overall (STATE)
- 87 Strongly Landlord-Friendly
- State Texas
- 87 Strongly Landlord-Friendly · R+5
- County
- — inherits STATE
- City
- — inherits STATE
ZIP-level market 77051
- Home prices YoY
- 9.7%
- Rents YoY
- 4.8%
- Active inventory
- 312
- Price-to-rent
- 11.2×
Monthly cashflow live
- Estimated rent
- $2,225 high interval (Pro) →
- Mortgage (P&I)
- −$1,568
- Tax est. 1.5%
- −$374 /mo · $4,485/yr
- Insurance
- −$125
- HOA
- −$113
- Vacancy / Maint / Mgmt
- −$467
- Net cashflow
- $-421
Break-even live
UW: 25.0% down · 7.5% · 30yr · 1.5% tax · 5.0% vac · 8.0% maint · 8.0% mgmt
Financing live
Cash to close
- Down payment
- $74,750
- Closing costs
- $8,970
- Reserves months
- —
- Total cash needed
- —
Loan-product check · same deal, 3 products live
Conventional
25% down · 7.5% · 30yr
- Down + closing
- —
- Monthly P&I
- —
- Monthly cashflow
- —
- DSCR
- —
- Eligible?
- —
Personal DTI + credit; lowest rate.
DSCR
20% down · 8.5% · 30yr
- Down + closing
- —
- Monthly P&I
- —
- Monthly cashflow
- —
- DSCR
- —
- Eligible?
- —
No personal income docs; deal must DSCR.
Hard money
10% down · 12.0% · 12mo
- Down + closing
- —
- Monthly P&I
- —
- Monthly cashflow
- —
- DSCR
- —
- Eligible?
- —
Short-term bridge; refi at stabilization.
Rent comps 15 comps
| Address | Beds | Baths | Sqft | Rent | $/sqft | DOM | Units | Dist |
|---|---|---|---|---|---|---|---|---|
| 10415 Lancaster Ln Houston, TX | 3.0–4.0 | 2.5 | 1937 | $2,525 | $1.30 | 20d | 1 | 0.11mi |
| 10514 Wellesley Terrace Trl Houston, TX | 3.0 | 3.0 | 1843 | $2,300 | $1.25 | 18d | 1 | 0.15mi |
| 2937 Amherst Meadow Ln Unit NA Houston, TX | 3.0 | 2.5 | 1820 | $2,400 | $1.32 | 4d | 1 | 0.26mi |
| 2937 Amherst Meadow Ln Houston, TX | 3.0 | 2.5 | 1820 | $2,450 | $1.35 | 22d | 1 | 0.26mi |
| 9610 Buffum St Houston, TX | 3.0 | 3.0 | 1605 | $1,799 | $1.12 | 43d | 1 | 0.55mi |
| 2910 Reed Rd Houston, TX | 1.0–3.0 | 1.0–2.0 | 967 | $1,280 | $1.32 | 1d | 5 | 0.71mi |
| 9606 Ashville Dr Unit B Houston, TX | 3.0 | 2.0 | 1610 | $1,570 | $0.98 | 43d | 1 | 0.85mi |
| 2725 Reed Rd Houston, TX | 1.0–3.0 | 1.0–2.5 | 911 | $975 | $1.07 | 43d | 1 | 0.91mi |
| 2889 Reed Rd Houston, TX | 1.0–2.0 | 1.0–2.0 | 997 | $1,648 | $1.65 | 2d | 2 | 0.96mi |
| 11900 Oakmoor Pkwy Houston, TX | 1.0–3.0 | 1.0–2.0 | 892 | $1,469 | $1.65 | 2d | 12 | 1.04mi |
| 3710 Rockingham St Houston, TX | 3.0 | 2.0 | 1890 | $1,700 | $0.90 | 43d | 1 | 1.08mi |
| 12320 Chesney Downs Dr Houston, TX | 4.0 | 2.5 | 2000 | $3,500 | $1.75 | 2d | 1 | 1.31mi |
| 3137 W Bellfort Ave Houston, TX | 2.0 | 2.0 | 1164 | $1,802 | $1.55 | 43d | 1 | 1.45mi |
| 11806 City Park Central Ln Houston, TX | 2.0 | 2.0 | 1107 | $1,636 | $1.48 | 16d | 1 | 1.48mi |
| 11806 City Park Central Ln Houston, TX | 2.0 | 2.0 | 1107 | $1,636 | $1.48 | 43d | 1 | 1.48mi |
HOA detail
- Monthly dues
- $113 · $1,356/yr
Listing history 14 events
-
2026-06-18days on market $299,000 Active 69 DOM
-
2026-06-17days on market $299,000 Active 68 DOM
-
2026-06-16days on market $299,000 Active 67 DOM
-
2026-06-15days on market $299,000 Active 66 DOM
-
2026-06-13days on market $299,000 Active 64 DOM
-
2026-06-10days on market $299,000 Active 60 DOM
-
2026-06-08days on market $299,000 Active 59 DOM
-
2026-06-07days on market $299,000 Active 58 DOM
-
2026-06-04days on market $299,000 Active 55 DOM
-
2026-06-01days on market $299,000 Active 52 DOM
-
2026-05-31days on market $299,000 Active 51 DOM
-
2026-05-01price $290,000 830-char remark
Show marketing remark (830 chars)
This thoughtfully designed two-story home offers 4 bedrooms, 2.5 bathrooms, a loft, and a 2-car garage, combining modern style with everyday functionality. The open-concept layout seamlessly connects the kitchen, dining, and living areas, creating an ideal space for entertaining and daily living. The kitchen features ample counter space, pantry storage, and a central island for prep and gathering. The first-floor primary suite includes a walk-in closet and private bath, offering a comfortable retreat. Upstairs features a versatile loft along with three secondary bedrooms and a full bathroom, providing flexibility for guests, work, or play. Additional highlights include energy-efficient construction, modern finishes, and a functional layout. Conveniently located near major highways, shopping, dining, and city amenities.
-
2026-04-10$299,999 Active 830-char remark
Show marketing remark (830 chars)
This thoughtfully designed two-story home offers 4 bedrooms, 2.5 bathrooms, a loft, and a 2-car garage, combining modern style with everyday functionality. The open-concept layout seamlessly connects the kitchen, dining, and living areas, creating an ideal space for entertaining and daily living. The kitchen features ample counter space, pantry storage, and a central island for prep and gathering. The first-floor primary suite includes a walk-in closet and private bath, offering a comfortable retreat. Upstairs features a versatile loft along with three secondary bedrooms and a full bathroom, providing flexibility for guests, work, or play. Additional highlights include energy-efficient construction, modern finishes, and a functional layout. Conveniently located near major highways, shopping, dining, and city amenities.
-
2026-03-31soldstatus
ⓘ Source: listings_history table (triggers on properties + properties_extension) + one-shot
backfill from property_details.listing_events for pre-trigger history.
Nearby sold comps map
Loading sold comps map…
Walkable amenities ~0.75 mi
Loading nearby amenities…
Taxation est. · year 1
- Rental income
- $26,702
- − Mortgage interest
- −$16,749
- − Property taxes
- −$4,485
- − Insurance
- −$1,495
- − Repairs & maintenance
- −$2,136
- − Management
- −$2,136
- − HOA
- −$1,356
- − Depreciation
- −$8,698
- Taxable loss
- −$10,353
- Est. tax savings @ 24.0%
- +$2,485
- After-tax cash flow
- $-2,573/yr
For passive investors: Depreciation is non-cash, so a rental often shows a tax loss while cash-flowing — sheltering income. Rental losses are passive: they offset passive income freely, and up to $25,000/yr can offset ordinary (W-2) income if you actively participate and your MAGI is under $100k (phasing out to $0 by $150k); unused losses carry forward. On sale, claimed depreciation is recaptured at up to 25%, and gains may owe capital-gains tax (a 1031 exchange can defer both). Figures are a year-1 estimate at your 24.0% rate — not tax advice; consult a CPA.
Schools (NCES district)
- District
- Houston ISD
- NCES district ID
- 4823640
- Math proficiency
- 27% ▼ -18.00%
- Reading proficiency
- 35% ▼ -6.00%
- Median HH income
- $46,054
- Composite
- 26.63/100
- National rank
- #7173
- State rank
- #593 of 826 in TX
Livability — Houston
- Score
- 74/100
- State rank
- #184
- US rank
- #4771
Category grades
Schools grade is shown separately in the Schools card above.
Census & demographics
- Census place
- Houston, TX
- County
- Harris County · 4,702,590 people
- City population
- 3,226,434
- Metro
- Houston-The Woodlands-Sugar Land, TX
- Population (ZIP)
- 19,795
- Household income
- $37,415
- Rent vs Own
- Severe rent burden
- 1446.0
Population outlook (Harris County) Hauer SSP2
- Today (2025)
- 5,571,493 people
- By 2030
- 6,089,821 · +9.3%
- By 2040
- 7,142,806 · +28.2%
- By 2050
- 8,185,864 · +46.9%
- By 2075
- 10,574,329 · +89.8%
- By 2100
- 12,109,958 · +117.4%
Race, ethnicity, and origin ACS 2023
- Neighborhood character
- Predominantly Black (77%)
- Race & ethnicity
- Black 77% Hispanic / Latino 16% Two or more races 11% White 3%
- Hispanic origin (detail)
- Mexican 6% Puerto Rican 1%
- Foreign-born
- 8% · Canada, China
- Languages at home
- 88% English-only · Spanish 10%
Political lean MEDSL · Harris
- 2024 margin
- Lean D (+5.5) · D 52.0% · R 46.4% · Other 1.6%
- 2008→2024 swing
- +3.9pp toward D · 2008: 1.6pp · 2024: 5.5pp
- All cycles
- 2024: D+5.5 2020: D+13.3 2016: D+12.4 2012: D+0.1 2008: D+1.6
Not yet ingested
- Civics
- —
Market trends
- HPI YoY
- ▲ 16.02%
- Current HPI
- 180.4283
- Rent YoY
- ▲ 4.77%
- Metro
- Houston-The Woodlands-Sugar Land, TX
- State GDP YoY
- ▲ 3.95%
- F500 in state
- 110
Industry mix (Fortune 500 HQ in TX)
| Industry | F500 HQs | Revenue |
|---|---|---|
| Energy | 16 | $1,198B |
|
||
| Technology | 5 | $198B |
|
||
| Engineering / Construction | 4 | $72B |
|
||
| Energy Services | 3 | $60B |
|
||
| Utilities | 3 | $41B |
|
||
| Healthcare | 2 | $330B |
|
||
Price history
-3.3% since first listed3 events — show timeline
- 2026-05-01 Price Changed $290,000 HARMLS
- 2026-04-10 Listed $299,999 HARMLS
- 2026-03-31 Sold (Public Records) — Public Records
Cash-flow waterfall
monthlySold comps — $/sqft
last 12 mo · ≤1 miLoading sold comps…