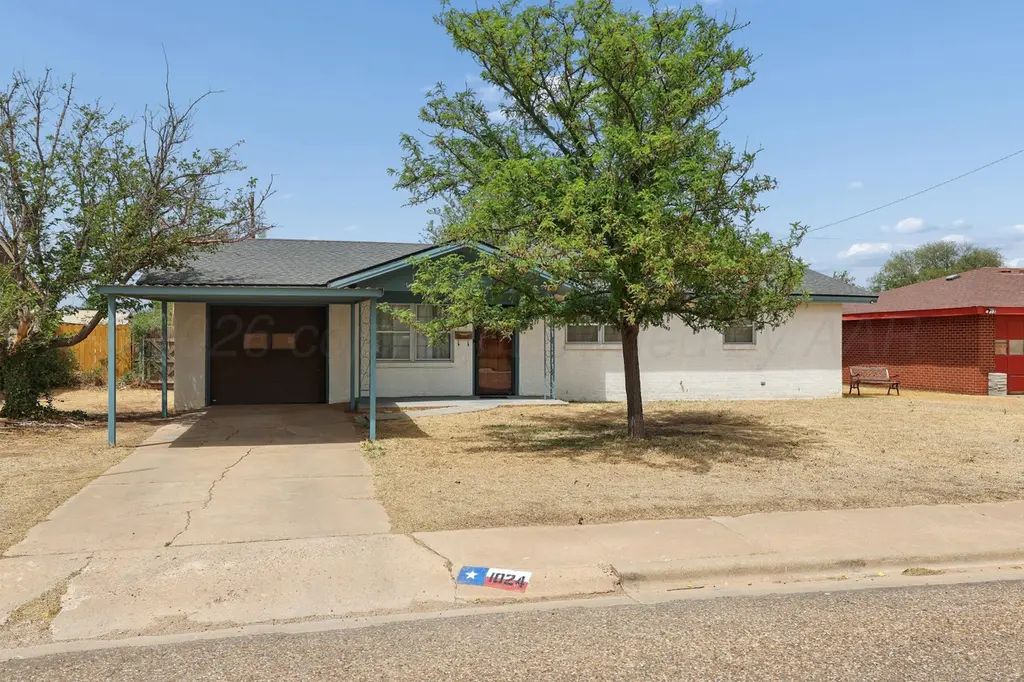
1024 NW 9th St · Tulia, TX
Flood risk 1/10 · Minimal
- FEMA flood zone
- —
- Chance of flooding over 30 yrs
- 0.0%
- Est. flood insurance / yr
- —
Fire risk 8/10 · Major
- Est. fire insurance / yr
- $1,222 – $2,270
Heat risk 5/10 · Moderate
- Hot days now (above 98°F)
- 6 days/yr
- Hot days in 30 yrs
- 17 days/yr
Wind risk 2/10 · Minimal
- Chance of severe wind over 30 yrs
- —
Air-quality risk 2/10 · Minimal
- Unhealthy air days now
- 1 days/yr
- Unhealthy air days in 30 yrs
- 1 days/yr
Risk factors via First Street. Map © Google.
Why this score? — see what drove the D+ grade
The composite is a weighted blend of 9 inputs, each scored 0–100. Each bar is that input's sub-score; the figure is the points it added to the 100-point composite (weight × sub-score).
- ARV discount +15.0/15.0
- Cash flow +12.3/30.0
- Appreciation +5.6/10.0
- 1% rule +3.8/10.0
- DSCR +3.6/10.0
- Livability +2.8/5.0
- Rent growth +2.5/5.0
- Condition / age +2.5/5.0
- Schools +1.8/10.0
$110,000
🖨 Deal sheet (PDF) 📄 Offer letter ✓ Due diligence
Listing remarks MLS
Cute 3 bedroom and 1 bath home with central heat and air. It has a formal living area, large den and a separate utility room. The backyard has 2 storage buildings, covered patio and cellar.
Key facts
- Two storage sheds
- 9,550 sq ft lot
- Garage
Tags
Property features AI
Finance
- Other: Property type: Residential single-family; Lot size approximately 0.22 acres; Zoning: 8000 series
- Financial info: Financial details not provided
- HOA & community: HOA details not provided
Exterior
- Parking: Attached garage; Garage faces front; Carport; 1 garage space
- Security: Security details not provided
- Utilities: Public water; Public sewer
- Home design: Single-family residence; One-story; South-facing
- Construction: Brick and frame construction; Composition roof; Slab foundation; Built year not provided
- Exterior features: Deck; Wood fencing; Outdoor storage structure
Interior
- Kitchen: Range; Dishwasher; Microwave; Refrigerator
- Bedrooms: Bedrooms info not provided
- Flooring: Flooring details not provided
- Bathrooms: 1 full bathroom
- Heating & cooling: Natural gas heating; Central air conditioning
- Interior features: Ceiling fans; No fireplace listed
- Laundry & utility: Washer and dryer included; Gas water heater
Neighborhood map
What this means for you Summary
Snapshot
- This is a 3-bed/1.0-bath single-family listed at $110k.
Deal economics
- At list price, monthly cash flow is $-21 ($-246/yr) — negative.
- To cash-flow at today's rent, offer at most $106k (3.3% below list).
- To meet the 1% rule (rent ≥ 1% of price), the offer needs to be $96k (12.5% below list).
- Recommended offer: $96k (12.5% below list) — sets the bar for 1% rule.
Location & tenants
- Location reads 56/100 on livability (#1,297 in TX) — a working-class tenant base; expect higher turnover. Strengths: cost of living A+, housing A; Watch: crime D-, amenities F, commute F.
- Tulia ISD (town): math 22% / reading 21% proficiency, ranked #768 of 826 in TX (top 93%) — low school quality limits family demand, transient renter base, plan for 1-2y turnover; 68% free/reduced lunch — lower-income household profile, screen leases tightly.
- Zoned schools: Tulia El (math 17% / reading 17%, grade F, #3,836 of 4,322 statewide, top 91%, 408 students, 82% FRL); Tulia J H (math 28% / reading 22%, grade F, #1,258 of 1,662 statewide, top 77%, 206 students, 82% FRL); Tulia H S (math 22% / reading 32%, grade F, #1,204 of 1,632 statewide, top 75%, 282 students, 80% FRL).
- Market conditions: 47 active listings in the ZIP.
Forward outlook
- In year one you build about $2k of equity ($761 loan paydown + $1k appreciation (1.3% local appreciation)).
- Swisher County population projected at -15% by 2050 — secular population decline; favor cash flow + early exit over multi-decade hold.
- At projected returns (1.3% appreciation + 3.0% rent growth), your $31k cash investment doubles in ~10 years — after that, you're playing with house money.
Negotiation context
- It's been on market 29 days — a 2% lower offer ($108k) is reasonable based on typical stale-listing flexibility.
- 2 sale attempts since 7y ago with the ask held roughly flat each time — persistent listings suggest the price (not the market) is what's stuck; bring a comps-based counter.
Risks & watch-outs
- Climate carrying-cost: severe wildfire risk; extreme-heat days projected 6→17/yr by 2055 (HVAC capex compounding) — expect insurance premiums to compound above CPI over the hold.
Questions for the listing agent
- What do current leases actually rent for vs. the listed asking? Can we see a recent rent roll and the last 12 months of T-12 income?
- Built in 1962 — when were the roof, HVAC, electrical panel, plumbing, and water heater last replaced?
- Is there a deadline driving the sale (1031 exchange, divorce, estate, relocation)? That informs how much negotiation room exists.
- Schools are F-rated, which usually means shorter tenancies and higher turnover. Who's the typical renter profile here, and what's been the actual vacancy rate?
- Crime grade is D in this area — have there been break-ins, vandalism, or insurance claims at this property in the last 3 years? What carrier currently insures it and at what premium?
- The area grade is low — what's the realistic commute time and amenity access for the typical tenant pool here? Any planned neighborhood developments (good or bad) we should know about?
- What's the average days-on-market for RENTAL listings here right now (not sales)? A rising rental-DOM trend means longer vacancies and softer asking-rent achievability than the comps imply.
- What's the recent tenant-quality profile in this submarket — average credit score on applications, eviction rate, late-payment / NSF rate, and stable-employment percentage? A property-management company in the area should have these aggregated.
- How much new for-sale + rental construction is in the pipeline within 1–3 miles? Heavy new supply typically softens prices + rents 12–24 months out; constrained supply supports both.
Investment metrics
- 1% rule
- 0.88% ✗
- Cap rate
- 6.07%
- Cash-on-cash
- -0.80%
- DSCR
- 0.96
- GRM
- 9.5
CMA / ARV
- ARV (median comp)
- $206,099
- List price
- $110,000
- Delta
- -46.63%
- Verdict
- UNDERPRICED
- Comps
- 2 within 2.0 mi
Projected returns pro-forma
1.26% appreciation · 3.0% rent growth · sell at horizon
- IRR
- 1.4%
- Equity multiple
- 1.07×
- Total profit
- $2,161
- Equity at exit
- $39,025
- IRR
- 5.9%
- Equity multiple
- 1.74×
- Total profit
- $22,689
- Equity at exit
- $53,019
Cash invested: $30,800 (down + closing). Projections, not guarantees.
Landlord ↔ Tenant lean methodology
- Overall (STATE)
- 87 Strongly Landlord-Friendly
- State Texas
- 87 Strongly Landlord-Friendly · R+5
- County
- — inherits STATE
- City
- — inherits STATE
ZIP-level market 79088
- Home prices YoY
- 0.8%
- Active inventory
- 47
- Price-to-rent
- 9.5×
Monthly cashflow live
- Estimated rent
- $963 medium interval (Pro) →
- Mortgage (P&I)
- −$577
- Tax from tax record
- −$159 /mo · $1,903/yr
- Insurance
- −$46
- HOA
- −$0
- Vacancy / Maint / Mgmt
- −$202
- Net cashflow
- $-21
Break-even live
Sensitivity live
| Price | -10% $42 | -5% $11 | +0% $-21 | +5% $-52 | +10% $-83 |
|---|---|---|---|---|---|
| Rent | -10% $-97 | -5% $-59 | +0% $-21 | +5% $18 | +10% $56 |
| Rate | -1.0pp $35 | -0.5pp $7 | base $-21 | +0.5pp $-49 | +1.0pp $-78 |
UW: 25.0% down · 7.5% · 30yr · 1.5% tax · 5.0% vac · 8.0% maint · 8.0% mgmt
Financing live
Cash to close
- Down payment
- $27,500
- Closing costs
- $3,300
- Reserves months
- —
- Total cash needed
- —
Loan-product check · same deal, 3 products live
Conventional
25% down · 7.5% · 30yr
- Down + closing
- —
- Monthly P&I
- —
- Monthly cashflow
- —
- DSCR
- —
- Eligible?
- —
Personal DTI + credit; lowest rate.
DSCR
20% down · 8.5% · 30yr
- Down + closing
- —
- Monthly P&I
- —
- Monthly cashflow
- —
- DSCR
- —
- Eligible?
- —
No personal income docs; deal must DSCR.
Hard money
10% down · 12.0% · 12mo
- Down + closing
- —
- Monthly P&I
- —
- Monthly cashflow
- —
- DSCR
- —
- Eligible?
- —
Short-term bridge; refi at stabilization.
Listing history 10 events
-
2026-06-04status $110,000 Pending 29 DOM
-
2026-06-03days on market $110,000 Active Under Contract 29 DOM
-
2026-06-02days on market $110,000 Active Under Contract 28 DOM
-
2026-06-01days on market $110,000 Active Under Contract 27 DOM
-
2026-05-31days on market $110,000 Active Under Contract 26 DOM
-
2026-05-05$110,000 Active 753-char remark
-
2020-11-03soldstatus
-
2020-10-26soldstatus 189-char remark
Show marketing remark (189 chars)
Cute 3 bedroom and 1 bath home with central heat and air. It has a formal living area, large den and a separate utility room. The backyard has 2 storage buildings, covered patio and cellar.
-
2019-11-18$50,000 189-char remark
Show marketing remark (189 chars)
Cute 3 bedroom and 1 bath home with central heat and air. It has a formal living area, large den and a separate utility room. The backyard has 2 storage buildings, covered patio and cellar.
-
2006-08-17soldstatus
ⓘ Source: listings_history table (triggers on properties + properties_extension) + one-shot
backfill from property_details.listing_events for pre-trigger history.
Tax reassessment forecast TX · Resets to sale price
- Current annual tax
- $1,903 · $159/mo
- Projected year-2 tax
- $2,013 · $168/mo
- Expected delta
- +$110/yr (+$9/mo · 5.8%)
ⓘ Screening estimate from a state-policy table — verify with the county assessor before closing.
Climate risk First Street
- Flood 1/10 Low 0% chance over 30 yrs
- Wildfire 8/10 Severe
- Heat 5/10 Major 6 d/yr ≥98°F today · 17 d/yr by 30 yrs out
- Wind 2/10 Low
- Air quality 2/10 Low 1 unhealthy d/yr today · 1 by 30 yrs out
Nearby sold comps map
Loading sold comps map…
Walkable amenities ~0.75 mi
Loading nearby amenities…
Taxation est. · year 1
- Rental income
- $11,555
- − Mortgage interest
- −$6,162
- − Property taxes
- −$1,903
- − Insurance
- −$550
- − Repairs & maintenance
- −$924
- − Management
- −$924
- − Depreciation
- −$3,200
- Taxable loss
- −$2,108
- Est. tax savings @ 24.0%
- +$506
- After-tax cash flow
- $260/yr
For passive investors: Depreciation is non-cash, so a rental often shows a tax loss while cash-flowing — sheltering income. Rental losses are passive: they offset passive income freely, and up to $25,000/yr can offset ordinary (W-2) income if you actively participate and your MAGI is under $100k (phasing out to $0 by $150k); unused losses carry forward. On sale, claimed depreciation is recaptured at up to 25%, and gains may owe capital-gains tax (a 1031 exchange can defer both). Figures are a year-1 estimate at your 24.0% rate — not tax advice; consult a CPA.
Schools (NCES district)
- District
- Tulia ISD
- NCES district ID
- 4843320
- Math proficiency
- 22% ▼ -9.00%
- Reading proficiency
- 21% ▼ -6.00%
- Median HH income
- $36,346
- Composite
- 17.86/100
- National rank
- #9004
- State rank
- #768 of 826 in TX
Livability — Tulia
- Score
- 56/100
- State rank
- #1297
- US rank
- #22536
Category grades
Schools grade is shown separately in the Schools card above.
Census & demographics
- Census place
- Tulia, TX
- Population (ZIP)
- 5,315
Population outlook (Swisher County) Hauer SSP2
- Today (2025)
- 7,108 people
- By 2030
- 6,928 · -2.5%
- By 2040
- 6,468 · -9.0%
- By 2050
- 6,017 · -15.3%
- By 2075
- 4,875 · -31.4%
- By 2100
- 3,447 · -51.5%
Race, ethnicity, and origin ACS 2023
- Neighborhood character
- Diverse neighborhood (Simpson 0.64)
- Race & ethnicity
- Hispanic / Latino 45% White 39% Two or more races 16% Black 10%
- Hispanic origin (detail)
- Mexican 39%
- Common ancestry
- Romanian 1% Slovak 1%
- Foreign-born
- 9% · Canada
- Languages at home
- 71% English-only · Spanish 29%
Political lean MEDSL · Swisher
- 2024 margin
- Solid R (+63.5) · D 17.8% · R 81.2%
- 2008→2024 swing
- -29.1pp toward R · 2008: -34.3pp · 2024: -63.5pp
- All cycles
- 2024: R+63.5 2020: R+58.0 2016: R+55.2 2012: R+47.5 2008: R+34.3
Not yet ingested
- Civics
- —
Market trends
- HPI YoY
- ▲ 1.26%
- Current HPI
- 158.3302
- Rent YoY
- —
- Metro
- —
- State GDP YoY
- ▲ 3.95%
- F500 in state
- 110
Industry mix (Fortune 500 HQ in TX)
| Industry | F500 HQs | Revenue |
|---|---|---|
| Energy | 16 | $1,198B |
|
||
| Technology | 5 | $198B |
|
||
| Engineering / Construction | 4 | $72B |
|
||
| Energy Services | 3 | $60B |
|
||
| Utilities | 3 | $41B |
|
||
| Healthcare | 2 | $330B |
|
||
Price history
+120.0% since first listed7 events — show timeline
- 2026-06-03 Pending — AARMLS
- 2026-05-20 Contingent — AARMLS
- 2026-05-05 Listed $110,000 AARMLS
- 2020-11-03 Sold (Public Records) — Public Records
- 2020-10-26 Sold (MLS) — PARMLS
- 2019-11-18 Listed $50,000 PARMLS
- 2006-08-17 Sold (Public Records) — Public Records
Property tax history
+3.8%/yrLatest (2025): $1,903 · +7.6% YoY. Source: county tax records.
Cash-flow waterfall
monthlySold comps — $/sqft
last 12 mo · ≤1 miLoading sold comps…