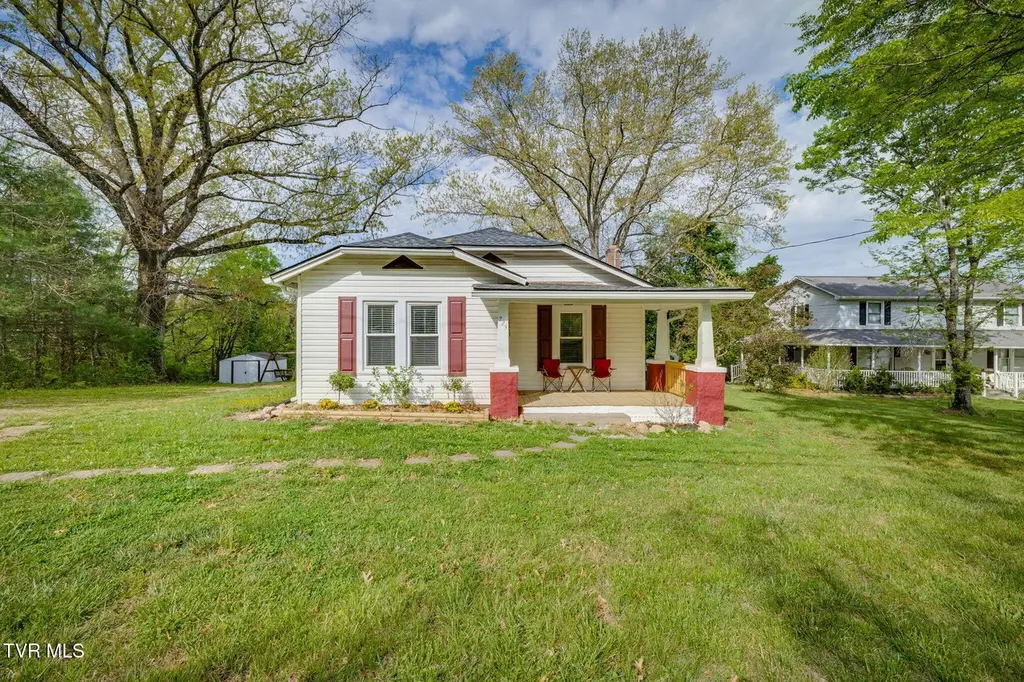
225 Washington College Sta · Telford, TN
Flood risk 1/10 · Minimal
- FEMA flood zone
- X (unshaded)
- Chance of flooding over 30 yrs
- 0.0%
- Est. flood insurance / yr
- $507 – $1,088
Fire risk 3/10 · Minor
- Est. fire insurance / yr
- $949 – $1,763
Heat risk 4/10 · Minor
- Hot days now (above 100°F)
- 7 days/yr
- Hot days in 30 yrs
- 20 days/yr
Wind risk 2/10 · Minimal
- Chance of severe wind over 30 yrs
- —
Air-quality risk 2/10 · Minimal
- Unhealthy air days now
- 1 days/yr
- Unhealthy air days in 30 yrs
- 1 days/yr
Risk factors via First Street. Map © Google.
Why this score? — see what drove the D+ grade
The composite is a weighted blend of 9 inputs, each scored 0–100. Each bar is that input's sub-score; the figure is the points it added to the 100-point composite (weight × sub-score).
- Cash flow +11.6/30.0
- ARV discount +11.0/15.0
- Appreciation +10.0/10.0
- DSCR +3.4/10.0
- Schools +2.6/10.0
- Rent growth +2.5/5.0
- Condition / age +2.5/5.0
- Livability +2.4/5.0
- 1% rule +2.1/10.0
$205,500
🖨 Deal sheet (PDF) 📄 Offer letter ✓ Due diligence
Listing remarks
This charming Limestone cottage offers cozy country living on just over 1.7 acres. Only a short drive from historic Jonesborough and everyday conveniences. Recent updates include a new roof, gutters, and double pane windows. Plus, hardwood floors in the main areas and easy-care vinyl in the kitchen, bath, and laundry, make this home feel move in ready. Inside, you'll appreciate the simple, open layout, cozy bedrooms, and a heated sunroom that's perfect for morning coffee or unwinding with peaceful views. Outside, enjoy a covered front porch, gently rolling yard, and useful outbuilding for storage. You're close to Jonesborough parks, local shops, and seasonal events, with nearby outdoor dest
Key facts
- Covered front porch
- Limestone cottage
- Heated sunroom
Tags
Property features AI
Exterior
- Parking: Gravel parking
- Utilities: Public water; Septic tank; Electricity connected; Water connected
- Home design: Single family residence; House; One level
- Construction: Vinyl siding; Composition roof
- Exterior features: Covered front porch; Porch; Outbuilding; Level to rolling slope terrain
Interior
- Kitchen: Electric range; Refrigerator
- Flooring: Hardwood; Vinyl
- Bathrooms: 1 full bathroom
- Heating & cooling: Heat pump; Propane heating; Fireplace heating; Has cooling
- Interior features: Laminate counters; Double pane windows; Gas log fireplace; Has basement with dirt floor and interior entry; 8 total rooms
- Laundry & utility: Washer hookup; Electric dryer hookup
Neighborhood map
What this means for you Summary
Snapshot
- This is a 2-bed/1.0-bath single-family listed at $206k.
Deal economics
- At list price, monthly cash flow is $-62 ($-744/yr) — negative.
- To cash-flow at today's rent, offer at most $195k (5.3% below list).
- To meet the 1% rule (rent ≥ 1% of price), the offer needs to be $145k (29.4% below list).
- Recommended offer: $145k (29.4% below list) — sets the bar for 1% rule.
- Cap rate 5.9% vs local median 2.8% in Telford — top-decile yield for the area; either an underpriced asset or a hidden risk that comps aren't pricing in. Stress-test before assuming the spread holds.
Location & tenants
- Location reads 47/100 on livability (#422 in TN) — a working-class tenant base; expect higher turnover. Strengths: cost of living A+, crime A; Watch: amenities F, commute F, employment F.
- Washington County (suburban): math 26% / reading 34% proficiency, ranked #54 of 139 in TN (top 39%) — families likely to look elsewhere, expect single-tenant / working-renter base with shorter leases.
- Zoned schools: West View School (math 11% / reading 23%, grade F, #709 of 952 statewide, top 77%, 311 students, 0% FRL); Jonesborough Middle School (math 27% / reading 25%, grade F, #144 of 333 statewide, top 44%, 416 students, 0% FRL); David Crockett High School (math 25% / reading 39%, grade F, #56 of 332 statewide, top 20%, 1,181 students, 0% FRL) — zoned schools average 0% FRL vs 41% district-wide (41 pts lower); this property's tenant base skews higher-income than the district average.
- Market conditions: 59 active listings in the ZIP; 1 comparable units currently listed for rent nearby; 1,155 units permitted in Washington County in 2024 (437 in 5+ unit buildings).
Forward outlook
- In year one you build about $22k of equity ($1k loan paydown + $21k appreciation (10.0% local appreciation)).
- Washington County population projected at +9% by 2050 — modest demand growth; plan on rents tracking national, not racing it.
- At projected returns (10.0% appreciation + 3.0% rent growth), your $58k cash investment doubles in ~3 years — after that, you're playing with house money.
- By year 2, paydown + projected appreciation supports a ~$35k cash-out refi (75% LTV) — recoverable capital for the next deal without selling this one.
Negotiation context
- It's been on market 60 days — a 3% lower offer ($199k) is reasonable based on typical stale-listing flexibility.
- Current owner paid $75k; list at $206k implies a 174% gain — meaningful room to come down on a strong offer.
Risks & watch-outs
- Watch-outs: built in 1955 — expect roof / HVAC / electrical / plumbing capex.
Questions for the listing agent
- What do current leases actually rent for vs. the listed asking? Can we see a recent rent roll and the last 12 months of T-12 income?
- It's been on market 60 days. Have you received any prior offers? Is the seller open to a 29% concession, seller financing, or rate buy-down credit?
- Built in 1955 — when were the roof, HVAC, electrical panel, plumbing, and water heater last replaced?
- Is there a deadline driving the sale (1031 exchange, divorce, estate, relocation)? That informs how much negotiation room exists.
- Schools are F-rated, which usually means shorter tenancies and higher turnover. Who's the typical renter profile here, and what's been the actual vacancy rate?
- The area grade is low — what's the realistic commute time and amenity access for the typical tenant pool here? Any planned neighborhood developments (good or bad) we should know about?
- What's the average days-on-market for RENTAL listings here right now (not sales)? A rising rental-DOM trend means longer vacancies and softer asking-rent achievability than the comps imply.
- What's the recent tenant-quality profile in this submarket — average credit score on applications, eviction rate, late-payment / NSF rate, and stable-employment percentage? A property-management company in the area should have these aggregated.
- How much new for-sale + rental construction is in the pipeline within 1–3 miles? Heavy new supply typically softens prices + rents 12–24 months out; constrained supply supports both.
Investment metrics
- 1% rule
- 0.71% ✗
- Cap rate
- 5.93%
- Cash-on-cash
- -1.29%
- DSCR
- 0.94
- GRM
- 11.8
CMA / ARV
- ARV (on-the-fly)
- $223,020
- Comps found
- 1
Show comp detail 1 sale within ~0.75 mi
| Address | Dist | Beds/Ba | Sqft | Sold | Price | $/sf | Match |
|---|---|---|---|---|---|---|---|
| 238 Washington College Station Rd | 0.06mi | 3/1.0 (+1) | 1,008 (+7%) | 5mo | $238,000 | $236 | 77 |
Match score weights: distance 35% · size 25% · config 20% · recency 20%. Top-matched comps best support the ARV.
Projected returns pro-forma
10.0% appreciation · 3.0% rent growth · sell at horizon
- IRR
- 23.3%
- Equity multiple
- 2.87×
- Total profit
- $107,861
- Equity at exit
- $185,131
- IRR
- 20.8%
- Equity multiple
- 6.57×
- Total profit
- $320,523
- Equity at exit
- $399,241
Cash invested: $57,540 (down + closing). Projections, not guarantees.
Landlord ↔ Tenant lean methodology
- Overall (STATE)
- 87 Strongly Landlord-Friendly
- State Tennessee
- 87 Strongly Landlord-Friendly · R+13
- County
- — inherits STATE
- City
- — inherits STATE
ZIP-level market 37681
- Home prices YoY
- 4.7%
- Active inventory
- 59
- Price-to-rent
- 11.8×
Monthly cashflow live
- Estimated rent
- $1,450 medium interval (Pro) →
- Mortgage (P&I)
- −$1,078
- Tax from tax record
- −$44 /mo · $531/yr
- Insurance
- −$86
- HOA
- −$0
- Vacancy / Maint / Mgmt
- −$304
- Net cashflow
- $-62
Break-even live
Sensitivity live
| Price | -10% $54 | -5% $-4 | +0% $-62 | +5% $-120 | +10% $-178 |
|---|---|---|---|---|---|
| Rent | -10% $-177 | -5% $-119 | +0% $-62 | +5% $-5 | +10% $53 |
| Rate | -1.0pp $41 | -0.5pp $-10 | base $-62 | +0.5pp $-115 | +1.0pp $-169 |
UW: 25.0% down · 7.5% · 30yr · 1.5% tax · 5.0% vac · 8.0% maint · 8.0% mgmt
Financing live
Cash to close
- Down payment
- $51,375
- Closing costs
- $6,165
- Reserves months
- —
- Total cash needed
- —
Loan-product check · same deal, 3 products live
Conventional
25% down · 7.5% · 30yr
- Down + closing
- —
- Monthly P&I
- —
- Monthly cashflow
- —
- DSCR
- —
- Eligible?
- —
Personal DTI + credit; lowest rate.
DSCR
20% down · 8.5% · 30yr
- Down + closing
- —
- Monthly P&I
- —
- Monthly cashflow
- —
- DSCR
- —
- Eligible?
- —
No personal income docs; deal must DSCR.
Hard money
10% down · 12.0% · 12mo
- Down + closing
- —
- Monthly P&I
- —
- Monthly cashflow
- —
- DSCR
- —
- Eligible?
- —
Short-term bridge; refi at stabilization.
Rent comps 1 comps
| Address | Beds | Baths | Sqft | Rent | $/sqft | DOM | Units | Dist |
|---|---|---|---|---|---|---|---|---|
| 127 Adams and Corby Rd Unit 24 Limestone, TN | 2.0 | 1.5 | 1077 | $1,450 | $1.35 | 22d | 1 | 1.27mi |
Listing history 17 events
-
2026-06-15statusdays on market $205,500 Pending 60 DOM
-
2026-06-14days on market $205,500 Active 59 DOM
-
2026-06-13days on market $205,500 Active 58 DOM
-
2026-06-10days on market $205,500 Active 56 DOM
-
2026-06-09days on market $205,500 Active 55 DOM
-
2026-06-08days on market $205,500 Active 54 DOM
-
2026-06-07days on market $205,500 Active 53 DOM
-
2026-06-05days on market $205,500 Active 50 DOM
-
2026-06-02days on market $205,500 Active 48 DOM
-
2026-06-01days on market $205,500 Active 47 DOM
-
2026-05-31days on market $205,500 Active 46 DOM
-
2026-05-30days on market $205,500 Active 45 DOM
-
2026-05-22price $205,500
-
2026-04-15$214,000 Active
-
2013-06-25soldstatus $75,000
-
2000-08-15soldstatus $57,200
-
1995-09-15soldstatus $35,100
ⓘ Source: listings_history table (triggers on properties + properties_extension) + one-shot
backfill from property_details.listing_events for pre-trigger history.
Tax reassessment forecast TN · Resets to sale price
- Current annual tax
- $531 · $44/mo
- Projected year-2 tax
- $1,459 · $122/mo
- Expected delta
- +$928/yr (+$77/mo · 174.8%)
ⓘ Screening estimate from a state-policy table — verify with the county assessor before closing.
Climate risk First Street
- Flood 1/10 Low FEMA zone X (unshaded) · 0% chance over 30 yrs
- Wildfire 3/10 Moderate
- Heat 4/10 Moderate 7 d/yr ≥100°F today · 20 d/yr by 30 yrs out
- Wind 2/10 Low
- Air quality 2/10 Low 1 unhealthy d/yr today · 1 by 30 yrs out
Nearby sold comps map
Loading sold comps map…
Walkable amenities ~0.75 mi
Loading nearby amenities…
Taxation est. · year 1
- Rental income
- $17,400
- − Mortgage interest
- −$11,511
- − Property taxes
- −$531
- − Insurance
- −$1,028
- − Repairs & maintenance
- −$1,392
- − Management
- −$1,392
- − Depreciation
- −$5,978
- Taxable loss
- −$4,432
- Est. tax savings @ 24.0%
- +$1,064
- After-tax cash flow
- $319/yr
For passive investors: Depreciation is non-cash, so a rental often shows a tax loss while cash-flowing — sheltering income. Rental losses are passive: they offset passive income freely, and up to $25,000/yr can offset ordinary (W-2) income if you actively participate and your MAGI is under $100k (phasing out to $0 by $150k); unused losses carry forward. On sale, claimed depreciation is recaptured at up to 25%, and gains may owe capital-gains tax (a 1031 exchange can defer both). Figures are a year-1 estimate at your 24.0% rate — not tax advice; consult a CPA.
Schools (NCES district)
- District
- Washington County
- NCES district ID
- 4704380
- Math proficiency
- 26% ▼ -21.00%
- Reading proficiency
- 34% ▼ -11.00%
- Median HH income
- $46,542
- Composite
- 25.85/100
- National rank
- #7350
- State rank
- #54 of 139 in TN
Livability — Telford
- Score
- 47/100
- State rank
- #422
- US rank
- #26284
Category grades
Schools grade is shown separately in the Schools card above.
Census & demographics
- City population
- 4,720
- Population (ZIP)
- 6,031
Population outlook (Washington County) Hauer SSP2
- Today (2025)
- 132,816 people
- By 2030
- 135,823 · +2.3%
- By 2040
- 140,897 · +6.1%
- By 2050
- 145,073 · +9.2%
- By 2075
- 156,386 · +17.7%
- By 2100
- 159,893 · +20.4%
Race, ethnicity, and origin ACS 2023
- Neighborhood character
- Predominantly White (98%)
- Race & ethnicity
- White 98% Two or more races 2%
- Common ancestry
- Serbian 3% Slovak 2% Italian 2%
- Foreign-born
- 0%
- Languages at home
- 99% English-only · German/W. Germanic 1%
Political lean MEDSL · Washington
- 2024 margin
- Solid R (+39.5) · D 29.6% · R 69.1% · Other 1.3%
- 2008→2024 swing
- -6.0pp toward R · 2008: -33.5pp · 2024: -39.5pp
- All cycles
- 2024: R+39.5 2020: R+36.2 2016: R+42.9 2012: R+38.5 2008: R+33.5
Not yet ingested
- Civics
- —
Market trends
- HPI YoY
- ▲ 13.43%
- Current HPI
- 296.7409
- Rent YoY
- —
- Metro
- —
- State GDP YoY
- ▲ 2.78%
- F500 in state
- 22
Industry mix (Fortune 500 HQ in TN)
| Industry | F500 HQs | Revenue |
|---|---|---|
| Healthcare | 3 | $91B |
|
||
| Retail | 3 | $72B |
|
||
| Transportation / Logistics | 1 | $88B |
|
||
| Paper / Packaging | 1 | $19B |
|
||
| Insurance | 1 | $13B |
|
||
| Energy | 1 | $12B |
|
||
Price history
+485.5% since first listed5 events — show timeline
- 2026-05-22 Price Changed $205,500 TVRMLS
- 2026-04-15 Listed $214,000 TVRMLS
- 2013-06-25 Sold (Public Records) $75,000 Public Records
- 2000-08-15 Sold (Public Records) $57,200 Public Records
- 1995-09-15 Sold (Public Records) $35,100 Public Records
Property tax history
+5.9%/yrLatest (2025): $531 · +0.0% YoY. Source: county tax records.
Cash-flow waterfall
monthlySold comps — $/sqft
last 12 mo · ≤1 miLoading sold comps…