 25-Plex
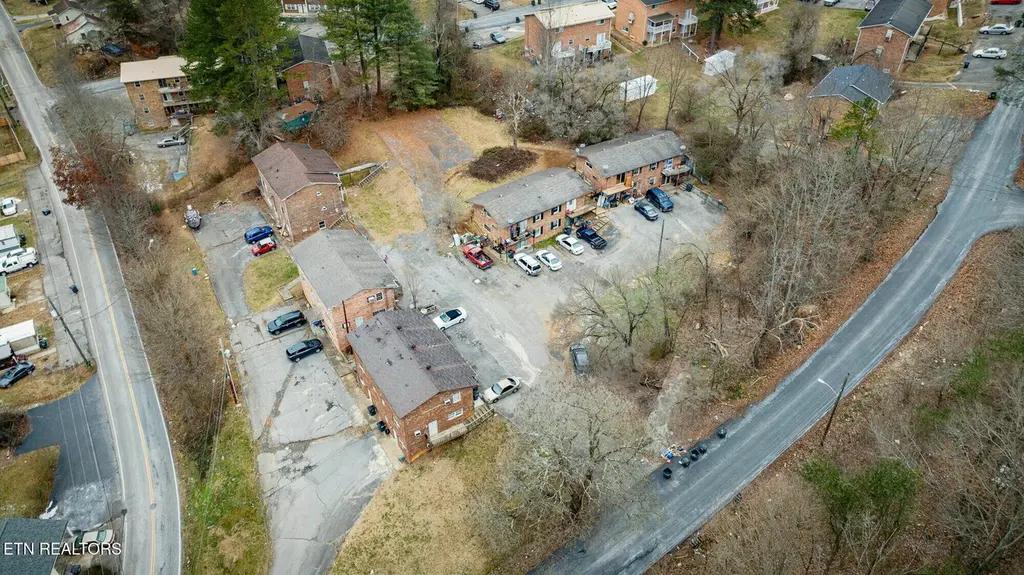
908 Chadwick Dr · Kingsport, TN
Flood risk 1/10 · Minimal
- FEMA flood zone
- X (unshaded)
- Chance of flooding over 30 yrs
- 0.0%
- Est. flood insurance / yr
- $473 – $860
Fire risk 3/10 · Minor
- Est. fire insurance / yr
- $949 – $1,763
Heat risk 4/10 · Minor
- Hot days now (above 100°F)
- 6 days/yr
- Hot days in 30 yrs
- 17 days/yr
Wind risk 2/10 · Minimal
- Chance of severe wind over 30 yrs
- —
Air-quality risk 1/10 · Minimal
- Unhealthy air days now
- 0 days/yr
- Unhealthy air days in 30 yrs
- 0 days/yr
Risk factors via First Street. Map © Google.
Why this score? — see what drove the B grade
The composite is a weighted blend of 9 inputs, each scored 0–100. Each bar is that input's sub-score; the figure is the points it added to the 100-point composite (weight × sub-score).
- Cash flow +30.0/30.0
- 1% rule +10.0/10.0
- DSCR +10.0/10.0
- ARV discount +7.5/15.0
- Rent growth +4.5/5.0
- Livability +3.6/5.0
- Schools +3.0/10.0
- Condition / age +2.5/5.0
- Appreciation +0.0/10.0
$1,545,000
🖨 Deal sheet (PDF) 📄 Offer letter ✓ Due diligence
Multi-family units
County records classify this as Multi-Family (5+ Unit). Listing-text estimate: 25 units. confirmed
5+ unit building — per-unit beds/baths from public records are typically unavailable; the breakdown below (if shown) is an estimate from the listing text.
Listing remarks
Presenting a 25-unit multifamily portfolio in Kingsport, Tennessee. The portfolio is currently 100% occupied and consists of six buildings with a unit mix of twenty 1 bed /1 bath units and five 3 bed / 1.5 bath units. Located approximately five minutes from downtown Kingsport, the property offers stable in-place income with value-add potential through future improvements and rent growth. This portfolio is located in Kingsport, TN which is anchored by major employers including Eastman Chemical Company and Ballad Health, providing a strong and stable employment base. The area offers convenient access to a range of retail, dining, and recreational amenities, along with proximity to the Tri-Cit
Key facts
- Built 1973
- Listed 73 days
Property features AI
Exterior
- Parking: Off-street parking; On-premise parking
- Home design: Brick construction; Multifamily building with 25 total units; Building area reported from tax records
- Construction: Brick exterior
- Exterior features: Balconies
Interior
- Flooring: Carpet; Vinyl
- Heating & cooling: Baseboard heating; Other heating; Window units for cooling; Other cooling
- Interior features: Carpet and vinyl flooring
Neighborhood map
What this means for you Summary
Snapshot
- This is a 20×1.0bd/1.5ba + 5×3.0bd/1.5ba units multifamily listed at $1.54M.
Deal economics
- At list price, monthly cash flow is $10k ($123k/yr) — positive. Per door: $409/mo.
- The deal already cash-flows at list — no discount required.
- Meets the 1% rule at list price ($26k rent vs $1.54M).
- Recommended offer: $1.45M (6.0% below list) — sets the bar for market timing.
- Cap rate 14.2% vs local median 3.8% in Kingsport — top-decile yield for the area; either an underpriced asset or a hidden risk that comps aren't pricing in. Stress-test before assuming the spread holds.
Location & tenants
- Location reads 71/100 on livability (#39 in TN) — a middle-class / working-renter tenant base. Strengths: cost of living A+, health & safety A+, housing A; Watch: amenities C-, crime F, commute F.
- Kingsport (urban): math 35% / reading 38% proficiency, ranked #26 of 139 in TN (top 19%) — families likely to look elsewhere, expect single-tenant / working-renter base with shorter leases.
- Zoned schools: Andrew Jackson Elementary School (math 27% / reading 23%, grade F, #541 of 952 statewide, top 57%, 496 students, 0% FRL); John Sevier Middle School (math 21% / reading 24%, grade F, #172 of 333 statewide, top 52%, 750 students, 0% FRL); Dobyns - Bennett High School (math 23% / reading 56%, grade F, #28 of 332 statewide, top 9%, 2,514 students, 0% FRL) — zoned schools average 0% FRL vs 47% district-wide (47 pts lower); this property's tenant base skews higher-income than the district average.
- Market conditions: Rents rising fast (+8.0%/yr); 242 active listings in the ZIP; 453 units permitted in Sullivan County in 2024 (6 in 5+ unit buildings).
- At $26,453/mo this rent would consume 645% of the median local household income ($49k/yr) (locally 1384% of renters already pay >50% of income on rent) — very limited rent-growth headroom before tenants either downsize or default.
Forward outlook
- Local home prices are declining (-3.0%/yr); year-one equity from $11k of loan paydown is wiped out by about $46k of value loss. Plan a longer hold.
- Sullivan County population projected to shrink 5% by 2050 — rents likely to lag national; underwrite the cash flow, not the appreciation.
- At projected returns (-3.0% appreciation + 8.0% rent growth), your $433k cash investment doubles in ~4 years — after that, you're playing with house money.
Negotiation context
- It's been on market 74 days — a 6% lower offer ($1.45M) is reasonable based on typical stale-listing flexibility.
- Current owner paid $85k; list at $1.54M implies a 1718% gain — meaningful room to come down on a strong offer.
Questions for the listing agent
- It's been on market 74 days. Have you received any prior offers? Is the seller open to a 6% concession, seller financing, or rate buy-down credit?
- Can we see the unit-by-unit rent roll, current vacancy, and any below-market leases? What's the average tenancy length?
- What capital expenditures (roof, boiler, parking lot, exteriors) have been made in the last 5 years, and what's planned in the next 2?
- Built in 1973 — when were the roof, HVAC, electrical panel, plumbing, and water heater last replaced?
- Why hasn't it sold? Are there any deal-killer items the seller is aware of (foundation, flood, title, zoning, code violations)?
- Is there a deadline driving the sale (1031 exchange, divorce, estate, relocation)? That informs how much negotiation room exists.
- Schools are D-rated, which usually means shorter tenancies and higher turnover. Who's the typical renter profile here, and what's been the actual vacancy rate?
- Crime grade is F in this area — have there been break-ins, vandalism, or insurance claims at this property in the last 3 years? What carrier currently insures it and at what premium?
- What's the average days-on-market for RENTAL listings here right now (not sales)? A rising rental-DOM trend means longer vacancies and softer asking-rent achievability than the comps imply.
- What's the recent tenant-quality profile in this submarket — average credit score on applications, eviction rate, late-payment / NSF rate, and stable-employment percentage? A property-management company in the area should have these aggregated.
- How much new apartment / multifamily construction is in the pipeline within 1–3 miles? Heavy new supply (>2% of stock underway) typically softens rents 12–24 months out; light construction supports rent growth.
Investment metrics
- 1% rule
- 1.71% ✓
- Cap rate
- 14.23%
- Cash-on-cash
- 28.35%
- DSCR
- 2.26
- GRM
- 4.9
CMA / ARV
No comps found within radius.
Projected returns pro-forma
-3.0% appreciation · 7.95% rent growth · sell at horizon
- IRR
- 28.1%
- Equity multiple
- 2.25×
- Total profit
- $539,338
- Equity at exit
- $230,365
- IRR
- 38.4%
- Equity multiple
- 5.48×
- Total profit
- $1,938,427
- Equity at exit
- $133,583
Cash invested: $432,600 (down + closing). Projections, not guarantees.
Landlord ↔ Tenant lean methodology
- Overall (STATE)
- 87 Strongly Landlord-Friendly
- State Tennessee
- 87 Strongly Landlord-Friendly · R+13
- County
- — inherits STATE
- City
- — inherits STATE
ZIP-level market 37660
- Home prices YoY
- -24.2%
- Rents YoY
- 8.0%
- Active inventory
- 242
- Price-to-rent
- 127.5×
Monthly cashflow live
- Estimated rent
- $26,453 high interval (Pro) →
- Mortgage (P&I)
- −$8,102
- Tax est. 1.5%
- −$1,931 /mo · $23,175/yr
- Insurance
- −$644
- HOA
- −$0
- Vacancy / Maint / Mgmt
- −$5,555
- Net cashflow
- $10,221
Break-even live
Sensitivity live
| Price | -10% $11,288 | -5% $10,755 | +0% $10,221 | +5% $9,687 | +10% $9,153 |
|---|---|---|---|---|---|
| Rent | -10% $8,131 | -5% $9,176 | +0% $10,221 | +5% $11,266 | +10% $12,311 |
| Rate | -1.0pp $10,999 | -0.5pp $10,614 | base $10,221 | +0.5pp $9,820 | +1.0pp $9,413 |
25-unit breakdown (identical units grouped — click to expand)
| Units | Beds | Baths | Est. rent |
|---|---|---|---|
| 20× units | 1.0 | 1.5 | $20,200 |
| #1 | 1.0 | 1.5 | $1,010 |
| #2 | 1.0 | 1.5 | $1,010 |
| #3 | 1.0 | 1.5 | $1,010 |
| #4 | 1.0 | 1.5 | $1,010 |
| #5 | 1.0 | 1.5 | $1,010 |
| #6 | 1.0 | 1.5 | $1,010 |
| #7 | 1.0 | 1.5 | $1,010 |
| #8 | 1.0 | 1.5 | $1,010 |
| #9 | 1.0 | 1.5 | $1,010 |
| #10 | 1.0 | 1.5 | $1,010 |
| #11 | 1.0 | 1.5 | $1,010 |
| #12 | 1.0 | 1.5 | $1,010 |
| #13 | 1.0 | 1.5 | $1,010 |
| #14 | 1.0 | 1.5 | $1,010 |
| #15 | 1.0 | 1.5 | $1,010 |
| #16 | 1.0 | 1.5 | $1,010 |
| #17 | 1.0 | 1.5 | $1,010 |
| #18 | 1.0 | 1.5 | $1,010 |
| #19 | 1.0 | 1.5 | $1,010 |
| #20 | 1.0 | 1.5 | $1,010 |
| 5× units | 3.0 | 1.5 | $6,255 |
| #21 | 3.0 | 1.5 | $1,251 |
| #22 | 3.0 | 1.5 | $1,251 |
| #23 | 3.0 | 1.5 | $1,251 |
| #24 | 3.0 | 1.5 | $1,251 |
| #25 | 3.0 | 1.5 | $1,251 |
| Total (25 units) | $26,453 | ||
UW: 25.0% down · 7.5% · 30yr · 1.5% tax · 5.0% vac · 8.0% maint · 8.0% mgmt
Financing live
Cash to close
- Down payment
- $386,250
- Closing costs
- $46,350
- Reserves months
- —
- Total cash needed
- —
Loan-product check · same deal, 3 products live
Conventional
25% down · 7.5% · 30yr
- Down + closing
- —
- Monthly P&I
- —
- Monthly cashflow
- —
- DSCR
- —
- Eligible?
- —
Personal DTI + credit; lowest rate.
DSCR
20% down · 8.5% · 30yr
- Down + closing
- —
- Monthly P&I
- —
- Monthly cashflow
- —
- DSCR
- —
- Eligible?
- —
No personal income docs; deal must DSCR.
Hard money
10% down · 12.0% · 12mo
- Down + closing
- —
- Monthly P&I
- —
- Monthly cashflow
- —
- DSCR
- —
- Eligible?
- —
Short-term bridge; refi at stabilization.
Listing history 21 events
-
2026-06-21days on market $1,545,000 Active 74 DOM
-
2026-06-19days on market $1,545,000 Active 72 DOM
-
2026-06-18days on market $1,545,000 Active 71 DOM
-
2026-06-17days on market $1,545,000 Active 70 DOM
-
2026-06-16days on market $1,545,000 Active 69 DOM
-
2026-06-15days on market $1,545,000 Active 68 DOM
-
2026-06-14days on market $1,545,000 Active 66 DOM
-
2026-06-13days on market $1,545,000 Active 65 DOM
-
2026-06-10days on market $1,545,000 Active 63 DOM
-
2026-06-09days on market $1,545,000 Active 62 DOM
-
2026-06-08days on market $1,545,000 Active 61 DOM
-
2026-06-07days on market $1,545,000 Active 60 DOM
-
2026-06-05days on market $1,545,000 Active 57 DOM
-
2026-06-03days on market $1,545,000 Active 56 DOM
-
2026-06-02days on market $1,545,000 Active 55 DOM
-
2026-06-01pricedays on market $1,545,000 Active 54 DOM
-
2026-05-31days on market $1,595,000 Active 53 DOM
-
2026-05-30days on market $1,595,000 Active 52 DOM
-
2026-04-08$1,595,000 Active
-
2004-02-05soldstatus $85,000
-
2002-05-28soldstatus $75,000
ⓘ Source: listings_history table (triggers on properties + properties_extension) + one-shot
backfill from property_details.listing_events for pre-trigger history.
Climate risk First Street
- Flood 1/10 Low FEMA zone X (unshaded) · 0% chance over 30 yrs
- Wildfire 3/10 Moderate
- Heat 4/10 Moderate 6 d/yr ≥100°F today · 17 d/yr by 30 yrs out
- Wind 2/10 Low
- Air quality 1/10 Low 0 unhealthy d/yr today · 0 by 30 yrs out
Nearby sold comps map
Loading sold comps map…
Walkable amenities ~0.75 mi
Loading nearby amenities…
Taxation est. · year 1
- Rental income
- $317,436
- − Mortgage interest
- −$86,544
- − Property taxes
- −$23,175
- − Insurance
- −$7,725
- − Repairs & maintenance
- −$25,395
- − Management
- −$25,395
- − Depreciation
- −$44,945
- Taxable income
- $104,257
- Est. tax owed @ 24.0%
- −$25,022
- After-tax cash flow
- $97,627/yr
For passive investors: Depreciation is non-cash, so a rental often shows a tax loss while cash-flowing — sheltering income. Rental losses are passive: they offset passive income freely, and up to $25,000/yr can offset ordinary (W-2) income if you actively participate and your MAGI is under $100k (phasing out to $0 by $150k); unused losses carry forward. On sale, claimed depreciation is recaptured at up to 25%, and gains may owe capital-gains tax (a 1031 exchange can defer both). Figures are a year-1 estimate at your 24.0% rate — not tax advice; consult a CPA.
Schools (NCES district)
- District
- Kingsport
- NCES district ID
- 4702190
- Math proficiency
- 35% ▼ -12.00%
- Reading proficiency
- 38% ▼ -5.00%
- Median HH income
- $38,017
- Composite
- 30.44/100
- National rank
- #6233
- State rank
- #26 of 139 in TN
Livability — Kingsport
- Score
- 71/100
- State rank
- #39
- US rank
- #6587
Category grades
Schools grade is shown separately in the Schools card above.
Census & demographics
- Census place
- Kingsport, TN
- County
- Sullivan County · 121,987 people
- City population
- 83,493
- Metro
- Kingsport-Bristol, TN-VA
- Population (ZIP)
- 40,996
- Household income
- $49,191
- Rent vs Own
- Severe rent burden
- 1384.0
Population outlook (Sullivan County) Hauer SSP2
- Today (2025)
- 157,030 people
- By 2030
- 156,415 · -0.4%
- By 2040
- 153,778 · -2.1%
- By 2050
- 149,018 · -5.1%
- By 2075
- 138,068 · -12.1%
- By 2100
- 119,927 · -23.6%
Race, ethnicity, and origin ACS 2023
- Neighborhood character
- Predominantly White (88%)
- Race & ethnicity
- White 88% Two or more races 4% Black 4% Hispanic / Latino 3%
- Common ancestry
- Serbian 3% Slovak 3% Italian 1%
- Foreign-born
- 2% · Canada
- Languages at home
- 98% English-only · Spanish 2%
Political lean MEDSL · Sullivan
- 2024 margin
- Solid R (+55.0) · D 22.0% · R 77.0% · Other 1.0%
- 2008→2024 swing
- -13.6pp toward R · 2008: -41.3pp · 2024: -55.0pp
- All cycles
- 2024: R+55.0 2020: R+51.9 2016: R+56.2 2012: R+47.2 2008: R+41.3
Not yet ingested
- Civics
- —
Market trends
- HPI YoY
- ▼ -80.93%
- Current HPI
- 252.9821
- Rent YoY
- ▲ 7.95%
- Metro
- Kingsport-Bristol, TN-VA
- State GDP YoY
- ▲ 2.78%
- F500 in state
- 22
Industry mix (Fortune 500 HQ in TN)
| Industry | F500 HQs | Revenue |
|---|---|---|
| Healthcare | 3 | $91B |
|
||
| Retail | 3 | $72B |
|
||
| Transportation / Logistics | 1 | $88B |
|
||
| Paper / Packaging | 1 | $19B |
|
||
| Insurance | 1 | $13B |
|
||
| Energy | 1 | $12B |
|
||
Price history
+2026.7% since first listed3 events — show timeline
- 2026-04-08 Listed $1,595,000 Knoxville MLS
- 2004-02-05 Sold (Public Records) $85,000 Public Records
- 2002-05-28 Sold (Public Records) $75,000 Public Records
Property tax history
+6.2%/yrLatest (2025): $2,585 · +75.7% YoY. Source: county tax records.
Cash-flow waterfall
monthlySold comps — $/sqft
last 12 mo · ≤1 miLoading sold comps…