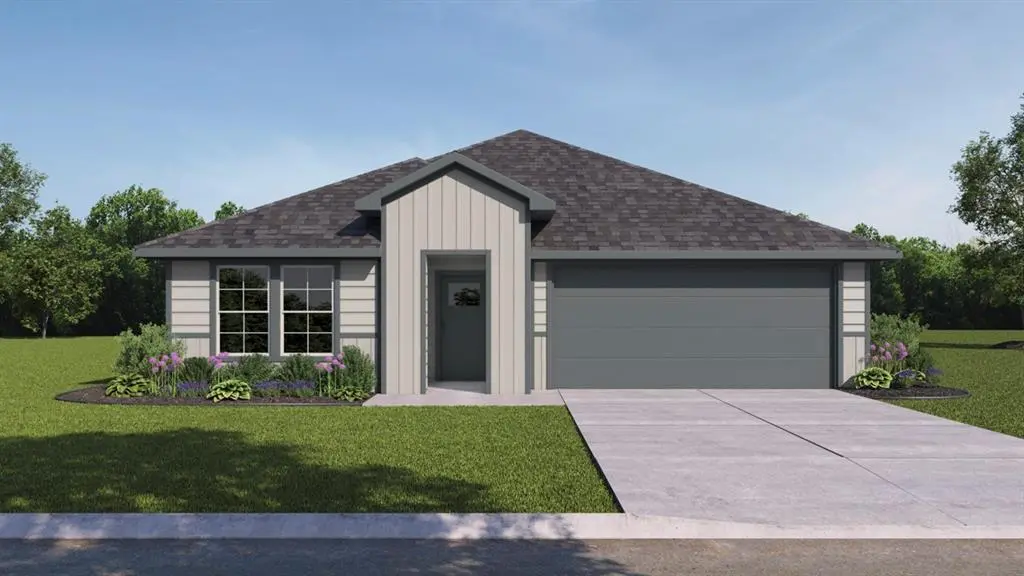
516 Saddle Blanket Dr · Josephine, TX
Flood risk No data
- FEMA flood zone
- —
- Chance of flooding over 30 yrs
- —
- Est. flood insurance / yr
- —
Fire risk No data
- Est. fire insurance / yr
- —
Heat risk No data
- Hot days now (above threshold)
- —
- Hot days in 30 yrs
- —
Wind risk No data
- Chance of severe wind over 30 yrs
- —
Air-quality risk No data
- Unhealthy air days now
- —
- Unhealthy air days in 30 yrs
- —
Risk factors via First Street. Map © Google.
Why this score? — see what drove the D- grade
The composite is a weighted blend of 9 inputs, each scored 0–100. Each bar is that input's sub-score; the figure is the points it added to the 100-point composite (weight × sub-score).
- Appreciation +10.0/10.0
- Cash flow +6.5/30.0
- ARV discount +6.2/15.0
- Schools +3.2/10.0
- Livability +3.0/5.0
- Rent growth +2.5/5.0
- Condition / age +2.5/5.0
- 1% rule +1.8/10.0
- DSCR +0.8/10.0
$301,490
🖨 Deal sheet 📄 Offer letter ✓ Due diligence
Listing remarks
New! Spacious open floor plan! Four bedrooms, three full baths, with separate study-den, and covered patio. Home includes, island kitchen, granite counters throughout, LED lighting, full sprinkler system, professionally engineered post tension foundation, and much more! Waverly Estates is a new D. R. Horton community in Josephine. The community is conveniently located just minutes from Interstate 30, providing easy access to Rockwall and the DFW Metroplex. Waverly Estates offers a variety of single-family homes to choose from. If you're looking for a new home in the Josephine area, Waverly Estates is the perfect community for you.
Key facts
- 8,276 sq ft lot
- 2 garage spots
- Built 2026
Neighborhood map
What this means for you Summary
Snapshot
- This is a 4-bed/3.0-bath single-family listed at $301k.
Deal economics
- At list price, monthly cash flow is $-503 ($-6k/yr) — negative.
- To cash-flow at today's rent, offer at most $229k (24.1% below list).
- To meet the 1% rule (rent ≥ 1% of price), the offer needs to be $206k (31.7% below list).
- Recommended offer: $206k (31.7% below list) — sets the bar for 1% rule.
Location & tenants
- Location reads 60/100 on livability (#1,076 in TX) — a middle-class / working-renter tenant base. Strengths: cost of living A+, housing A+, crime A-; Watch: amenities F, commute F, health & safety F.
- Community ISD (rural): math 30% / reading 38% proficiency, ranked #479 of 826 in TX (top 58%) — families likely to look elsewhere, expect single-tenant / working-renter base with shorter leases.
- Zoned schools: John & Barbara Roderick El (678 students, 52% FRL) — zoned schools average 52% FRL vs 36% district-wide (16 pts higher); higher-poverty schools than district average — tighter screening recommended.
- Market conditions: 421 active listings in the ZIP; 25 comparable units currently listed for rent nearby; rentals leasing fast (median 13d on market — plan ~1-2 weeks tenant-placement turnaround); 19,194 units permitted in Collin County in 2024 (3,988 in 5+ unit buildings).
Forward outlook
- In year one you build about $32k of equity ($2k loan paydown + $30k appreciation (10.0% local appreciation)).
- Collin County population projected at +60% by 2050 — long-run rental-demand tailwind backs the buy-and-hold thesis.
- By year 2, paydown + projected appreciation supports a ~$52k cash-out refi (75% LTV) — recoverable capital for the next deal without selling this one.
Negotiation context
- It's been on market 19 days — a 2% lower offer ($297k) is reasonable based on typical stale-listing flexibility.
Questions for the listing agent
- What do current leases actually rent for vs. the listed asking? Can we see a recent rent roll and the last 12 months of T-12 income?
- What does the HOA fee cover, when was the last increase, and are there any pending special assessments or reserve-fund shortfalls?
- Is there a deadline driving the sale (1031 exchange, divorce, estate, relocation)? That informs how much negotiation room exists.
- Schools are F-rated, which usually means shorter tenancies and higher turnover. Who's the typical renter profile here, and what's been the actual vacancy rate?
- The area grade is low — what's the realistic commute time and amenity access for the typical tenant pool here? Any planned neighborhood developments (good or bad) we should know about?
- What's the average days-on-market for RENTAL listings here right now (not sales)? A rising rental-DOM trend means longer vacancies and softer asking-rent achievability than the comps imply.
- What's the recent tenant-quality profile in this submarket — average credit score on applications, eviction rate, late-payment / NSF rate, and stable-employment percentage? A property-management company in the area should have these aggregated.
- How much new for-sale + rental construction is in the pipeline within 1–3 miles? Heavy new supply typically softens prices + rents 12–24 months out; constrained supply supports both.
Investment metrics
- 1% rule
- 0.68% ✗
- Cap rate
- 4.29%
- Cash-on-cash
- -7.14%
- DSCR
- 0.68
- GRM
- 12.2
CMA / ARV
- ARV (on-the-fly)
- $292,896
- Comps found
- 12
Show comp detail 12 sales within ~0.75 mi
| Address | Dist | Beds/Ba | Sqft | Sold | Price | $/sf | Match |
|---|---|---|---|---|---|---|---|
| 516 Saddle Blanket Dr | 0.00mi | 4/3.0 | 2,034 (0%) | 1mo | $301,490 | $148 | 100 |
| 512 Saddle Blanket Dr | 0.02mi | 4/2.0 | 2,024 (-0%) | 2mo | $291,535 | $144 | 92 |
| 1133 Bristlecone Dr | 0.20mi | 4/2.0 | 2,024 (-0%) | 0mo | $324,990 | $161 | 86 |
| 311 American Elm Dr | 0.36mi | 4/2.0 | 2,037 (+0%) | 3mo | $281,490 | $138 | 77 |
| 505 Silver Birch Dr | 0.16mi | 5/2.0 (+1) | 1,938 (-5%) | 0mo | $269,990 | $139 | 76 |
| 506 Saddle Blanket Dr | 0.06mi | 4/2.0 | 1,801 (-12%) | 1mo | $290,990 | $162 | 73 |
| 205 Weathered Way | 0.48mi | 4/2.0 | 2,042 (+0%) | 2mo | $342,990 | $168 | 71 |
| 407 Saddle Blanket Dr | 0.13mi | 4/2.0 | 1,801 (-12%) | 2mo | $273,990 | $152 | 69 |
| 505 Plum Dr | 0.42mi | 4/2.0 | 1,891 (-7%) | 3mo | $265,000 | $140 | 62 |
| 500 Northern Red Dr | 0.27mi | 4/2.0 | 2,314 (+14%) | 1mo | $303,490 | $131 | 60 |
| 708 Wisteria Dr | 0.62mi | 4/2.5 | 2,155 (+6%) | 1mo | $255,000 | $118 | 59 |
| 403 American Elm Dr | 0.35mi | 4/2.0 | 2,314 (+14%) | 3mo | $294,490 | $127 | 54 |
Match score weights: distance 35% · size 25% · config 20% · recency 20%. Top-matched comps best support the ARV.
Projected returns pro-forma
10.0% appreciation · 3.0% rent growth · sell at horizon
- IRR
- 19.2%
- Equity multiple
- 2.57×
- Total profit
- $132,252
- Equity at exit
- $271,606
- IRR
- 17.7%
- Equity multiple
- 5.91×
- Total profit
- $414,748
- Equity at exit
- $585,729
Cash invested: $84,417 (down + closing). Projections, not guarantees.
Landlord ↔ Tenant lean methodology
- Overall (STATE)
- 87 Strongly Landlord-Friendly
- State Texas
- 87 Strongly Landlord-Friendly · R+5
- County
- — inherits STATE
- City
- — inherits STATE
ZIP-level market 75173
- Home prices YoY
- 3.1%
- Active inventory
- 421
- Price-to-rent
- 12.2×
Monthly cashflow live
- Estimated rent
- $2,059 high interval (Pro) →
- Mortgage (P&I)
- −$1,581
- Tax est. 1.5%
- −$377 /mo · $4,522/yr
- Insurance
- −$126
- HOA
- −$46
- Vacancy / Maint / Mgmt
- −$432
- Net cashflow
- $-503
Break-even live
UW: 25.0% down · 7.5% · 30yr · 1.5% tax · 5.0% vac · 8.0% maint · 8.0% mgmt
Financing live
Cash to close
- Down payment
- $75,372
- Closing costs
- $9,045
- Reserves months
- —
- Total cash needed
- —
Loan-product check · same deal, 3 products live
Conventional
25% down · 7.5% · 30yr
- Down + closing
- —
- Monthly P&I
- —
- Monthly cashflow
- —
- DSCR
- —
- Eligible?
- —
Personal DTI + credit; lowest rate.
DSCR
20% down · 8.5% · 30yr
- Down + closing
- —
- Monthly P&I
- —
- Monthly cashflow
- —
- DSCR
- —
- Eligible?
- —
No personal income docs; deal must DSCR.
Hard money
10% down · 12.0% · 12mo
- Down + closing
- —
- Monthly P&I
- —
- Monthly cashflow
- —
- DSCR
- —
- Eligible?
- —
Short-term bridge; refi at stabilization.
Rent comps 25 comps
| Address | Beds | Baths | Sqft | Rent | $/sqft | DOM | Units | Dist |
|---|---|---|---|---|---|---|---|---|
| 504 Saddle Blanket Dr Nevada, TX | 4.0 | 2.0 | 1649 | $1,949 | $1.18 | 15d | 1 | 0.05mi |
| 504 Saddle Blanket Dr Nevada, TX | 4.0 | 2.0 | 1649 | $1,925 | $1.17 | 6d | 1 | 0.05mi |
| 503 Saddle Blanket Dr Nevada, TX | 4.0 | 3.0 | 2077 | $2,190 | $1.05 | 44d | 1 | 0.06mi |
| 319 Plum Dr Nevada, TX | 4.0 | 2.0 | 1587 | $1,899 | $1.20 | 10d | 1 | 0.46mi |
| 305 Silo Cir Royse City, TX | 4.0 | 2.0 | 2074 | $2,100 | $1.01 | 25d | 1 | 0.75mi |
| 1307 Community Way Royse City, TX | 4.0 | 2.0 | 2104 | $2,100 | $1.00 | 44d | 1 | 0.77mi |
| 311 Milo Way Royse City, TX | 4.0 | 2.0 | 2074 | $2,200 | $1.06 | 6d | 1 | 0.80mi |
| 802 Turnbuckle Ct Royse City, TX | 4.0 | 2.0 | 1577 | $1,849 | $1.17 | 44d | 1 | 0.86mi |
| 801 Meadow Creek Ln Josephine, TX | 4.0 | 2.0 | 1757 | $2,500 | $1.42 | 5d | 1 | 0.98mi |
| 722 Windmill St Josephine, TX | 4.0 | 2.0 | 1568 | $2,190 | $1.40 | 2d | 1 | 0.99mi |
| 1004 Cotton Gin Ct Royse City, TX | 4.0 | 2.0 | 1875 | $1,850 | $0.99 | 13d | 1 | 1.00mi |
| 800 Windmill St Josephine, TX | 4.0 | 2.0 | 1843 | $2,100 | $1.14 | 7d | 1 | 1.00mi |
| 315 Pine Hollow Way Josephine, TX | 4.0 | 3.0 | 2212 | $2,300 | $1.04 | 7d | 1 | 1.00mi |
| 1007 Cotton Gin Ct Royse City, TX | 3.0 | 2.0 | 1611 | $2,050 | $1.27 | 44d | 1 | 1.01mi |
| 508 Windrow Dr Royse City, TX | 3.0 | 2.0 | 1533 | $1,875 | $1.22 | 25d | 1 | 1.04mi |
| 508 Windrow Dr Royse City, TX | 3.0 | 2.0 | 1533 | $1,900 | $1.24 | 44d | 1 | 1.04mi |
| 1503 Cotton Gin Ct Royse City, TX | 3.0 | 2.0 | 1566 | $2,200 | $1.40 | 44d | 1 | 1.07mi |
| 306 E Cook St Josephine, TX | 3.0 | 2.0 | 1817 | $2,100 | $1.16 | 1d | 1 | 1.10mi |
| 1501 Bridle Dr Josephine, TX | 4.0 | 2.0 | 2081 | $1,975 | $0.95 | 44d | 1 | 1.12mi |
| 813 Cottonwood Way Royse City, TX | 4.0 | 3.0 | 2347 | $2,350 | $1.00 | 13d | 1 | 1.13mi |
| 1210 Honeysuckle Dr Josephine, TX | 5.0 | 2.0 | 1995 | $2,100 | $1.05 | 13d | 1 | 1.14mi |
| 717 Cottonwood WAY Josephine, TX | 4.0 | 3.0 | 2073 | $2,125 | $1.03 | 1d | 1 | 1.16mi |
| 1208 Fieldstone Ct Royse City, TX | 4.0 | 2.0 | 1835 | $2,000 | $1.09 | 44d | 1 | 1.23mi |
| 711 Cistern Way Royse City, TX | 4.0 | 2.0 | 2081 | $1,975 | $0.95 | 7d | 1 | 1.23mi |
| 1413 Thunder Canyon Way Josephine, TX | 5.0 | 2.0 | 2006 | $2,500 | $1.25 | 44d | 1 | 1.31mi |
HOA detail
- Monthly dues
- $46 · $552/yr
Listing history 3 events
-
2026-04-27status Pending
-
2026-04-22price $301,490
-
2026-04-08$331,490 Active
ⓘ Source: listings_history table (triggers on properties + properties_extension) + one-shot
backfill from property_details.listing_events for pre-trigger history.
Nearby sold comps map
Loading sold comps map…
Walkable amenities ~0.75 mi
Loading nearby amenities…
Taxation est. · year 1
- Rental income
- $24,714
- − Mortgage interest
- −$16,888
- − Property taxes
- −$4,522
- − Insurance
- −$1,507
- − Repairs & maintenance
- −$1,977
- − Management
- −$1,977
- − HOA
- −$552
- − Depreciation
- −$8,771
- Taxable loss
- −$11,481
- Est. tax savings @ 24.0%
- +$2,755
- After-tax cash flow
- $-3,275/yr
For passive investors: Depreciation is non-cash, so a rental often shows a tax loss while cash-flowing — sheltering income. Rental losses are passive: they offset passive income freely, and up to $25,000/yr can offset ordinary (W-2) income if you actively participate and your MAGI is under $100k (phasing out to $0 by $150k); unused losses carry forward. On sale, claimed depreciation is recaptured at up to 25%, and gains may owe capital-gains tax (a 1031 exchange can defer both). Figures are a year-1 estimate at your 24.0% rate — not tax advice; consult a CPA.
Schools (NCES district)
- District
- Community ISD
- NCES district ID
- 4814850
- Math proficiency
- 30% ▼ -23.00%
- Reading proficiency
- 38% ▼ -11.00%
- Median HH income
- $71,841
- Composite
- 31.58/100
- National rank
- #5951
- State rank
- #479 of 826 in TX
Livability — Josephine
- Score
- 60/100
- State rank
- #1076
- US rank
- #19105
Category grades
Schools grade is shown separately in the Schools card above.
Census & demographics
- Population (ZIP)
- 9,284
Population outlook (Collin County) Hauer SSP2
- Today (2025)
- 1,210,074 people
- By 2030
- 1,358,201 · +12.2%
- By 2040
- 1,654,061 · +36.7%
- By 2050
- 1,937,359 · +60.1%
- By 2075
- 2,567,039 · +112.1%
- By 2100
- 2,952,048 · +144.0%
Race, ethnicity, and origin ACS 2023
- Neighborhood character
- Majority White (65%)
- Race & ethnicity
- White 65% Hispanic / Latino 28% Two or more races 15% Black 2% Native American 1%
- Hispanic origin (detail)
- Mexican 26%
- Common ancestry
- Slovak 2% Serbian 1% Iranian 1%
- Foreign-born
- 17% · Canada, Jamaica
- Languages at home
- 74% English-only · Spanish 24% Arabic 1%
Political lean MEDSL · Collin
- 2024 margin
- R (+11.1) · D 43.1% · R 54.3% · Other 2.6%
- 2008→2024 swing
- +14.4pp toward D · 2008: -25.6pp · 2024: -11.1pp
- All cycles
- 2024: R+11.1 2020: R+4.3 2016: R+17.0 2012: R+31.6 2008: R+25.6
Not yet ingested
- Civics
- —
Market trends
- HPI YoY
- ▲ 10.09%
- Current HPI
- 331.12
- Rent YoY
- —
- Metro
- —
- State GDP YoY
- ▲ 3.95%
- F500 in state
- 110
Industry mix (Fortune 500 HQ in TX)
| Industry | F500 HQs | Revenue |
|---|---|---|
| Energy | 16 | $1,198B |
|
||
| Technology | 5 | $198B |
|
||
| Engineering / Construction | 4 | $72B |
|
||
| Energy Services | 3 | $60B |
|
||
| Utilities | 3 | $41B |
|
||
| Healthcare | 2 | $330B |
|
||
Price history
-9.1% since first listed3 events — show timeline
- 2026-04-27 Pending — NTREIS
- 2026-04-22 Price Changed $301,490 NTREIS
- 2026-04-08 Listed $331,490 NTREIS
Cash-flow waterfall
monthlySold comps — $/sqft
last 12 mo · ≤1 miLoading sold comps…