2301 W Michigan Ave #18 · Bellview, FL
Flood risk 5/10 · Moderate
- FEMA flood zone
- AE
- Chance of flooding over 30 yrs
- 0.49%
- Est. flood insurance / yr
- $1,737 – $8,500
Fire risk 3/10 · Minor
- Est. fire insurance / yr
- $947 – $1,759
Heat risk 10/10 · Severe
- Hot days now (above 105°F)
- 6 days/yr
- Hot days in 30 yrs
- 18 days/yr
Wind risk 9/10 · Severe
- Chance of severe wind over 30 yrs
- 99.0%
Air-quality risk 1/10 · Minimal
- Unhealthy air days now
- 0 days/yr
- Unhealthy air days in 30 yrs
- 0 days/yr
Risk factors via First Street. Map © Google.
Why this score? — see what drove the B+ grade
The composite is a weighted blend of 9 inputs, each scored 0–100. Each bar is that input's sub-score; the figure is the points it added to the 100-point composite (weight × sub-score).
- Cash flow +30.0/30.0
- ARV discount +13.4/15.0
- DSCR +10.0/10.0
- 1% rule +9.9/10.0
- Rent growth +3.6/5.0
- Schools +3.6/10.0
- Livability +3.4/5.0
- Condition / age +2.2/5.0
- Appreciation +0.0/10.0
$99,000
🖨 Deal sheet 📄 Offer letter ✓ Due diligence
Listing remarks MLS
Townhome Centrally located in Pensacola just off Michigan Ave. unit needs work . easy to show on combo box
Key facts
- $99 HOA
- 4 parking spots
- Built 2005
Neighborhood map
What this means for you Summary
Snapshot
- This is a 2-bed/2.5-bath townhouse listed at $99k. Condition is rated fair.
Deal economics
- At list price, monthly cash flow is $-51 ($-608/yr) — negative.
- To cash-flow at today's rent, offer at most $90k (9.0% below list).
- Meets the 1% rule at list price ($1k rent vs $99k).
- Recommended offer: $87k (12.0% below list) — sets the bar for market timing.
- Cap rate 10.8% vs local median 5.2% in Bellview — top-decile yield for the area; either an underpriced asset or a hidden risk that comps aren't pricing in. Stress-test before assuming the spread holds.
Location & tenants
- Location reads 67/100 on livability (#561 in FL) — a middle-class / working-renter tenant base. Strengths: cost of living A+, housing A+; Watch: schools D+, amenities F, commute F.
- Escambia (suburban): math 40% / reading 45% proficiency, ranked #56 of 73 in FL (top 77%) — families likely to look elsewhere, expect single-tenant / working-renter base with shorter leases.
- Market conditions: Rents rising fast (+4.4%/yr); 417 active listings in the ZIP; 16 comparable units currently listed for rent nearby; rentals at typical pace (median 23d on market — plan ~3-4 weeks tenant-placement turnaround); solid renter incomes; 1,479 units permitted in Escambia County in 2024 (0 in 5+ unit buildings).
Forward outlook
- Local home prices are declining (-3.0%/yr); year-one equity from $684 of loan paydown is wiped out by about $3k of value loss. Plan a longer hold.
- Escambia County population projected at +13% by 2050 — modest demand growth; plan on rents tracking national, not racing it.
Negotiation context
- It's been on market 122 days — a 12% lower offer ($87k) is reasonable based on typical stale-listing flexibility.
- 4 sale attempts since 21y ago; this cycle's ask has dropped $11k (10%) from the opening price — seller is motivated, your offer sets the floor, not the list.
Risks & watch-outs
- Watch-outs: flood insurance adds $427/mo.
- Climate carrying-cost: in FEMA flood zone AE (mandatory federal flood insurance); severe wind risk, 99% chance of damaging wind over 30y; extreme-heat days projected 6→18/yr by 2055 (HVAC capex compounding) — expect insurance premiums to compound above CPI over the hold.
Questions for the listing agent
- What do current leases actually rent for vs. the listed asking? Can we see a recent rent roll and the last 12 months of T-12 income?
- It's been on market 122 days. Have you received any prior offers? Is the seller open to a 12% concession, seller financing, or rate buy-down credit?
- Have any recent inspections been done? Can we get a copy of the seller's disclosures and any deferred-maintenance estimates?
- What's the actual annual flood-insurance premium (NFIP or private), and is the property in a SFHA with mandatory coverage?
- What does the HOA fee cover, when was the last increase, and are there any pending special assessments or reserve-fund shortfalls?
- Why hasn't it sold? Are there any deal-killer items the seller is aware of (foundation, flood, title, zoning, code violations)?
- Is there a deadline driving the sale (1031 exchange, divorce, estate, relocation)? That informs how much negotiation room exists.
- Schools are D-rated, which usually means shorter tenancies and higher turnover. Who's the typical renter profile here, and what's been the actual vacancy rate?
- What's the average days-on-market for RENTAL listings here right now (not sales)? A rising rental-DOM trend means longer vacancies and softer asking-rent achievability than the comps imply.
- What's the recent tenant-quality profile in this submarket — average credit score on applications, eviction rate, late-payment / NSF rate, and stable-employment percentage? A property-management company in the area should have these aggregated.
- How much new for-sale + rental construction is in the pipeline within 1–3 miles? Heavy new supply typically softens prices + rents 12–24 months out; constrained supply supports both.
Investment metrics
- 1% rule
- 1.49% ✓
- Cap rate
- 10.85%
- Cash-on-cash
- 16.27%
- DSCR
- 1.72
- GRM
- 5.6
CMA / ARV
- ARV (median comp)
- $113,833
- List price
- $99,000
- Delta
- -13.03%
- Verdict
- UNDERPRICED
- Comps
- 20 within 1.0 mi
Show comp detail 9 sales within ~0.75 mi
| Address | Dist | Beds/Ba | Sqft | Sold | Price | $/sf | Match |
|---|---|---|---|---|---|---|---|
| 2301 W Michigan Ave #12 | 0.05mi | 2/2.5 | 1,164 (0%) | 1mo | $143,000 | $123 | 97 |
| 2301 W Michigan Ave #20 | 0.01mi | 2/2.5 | 1,164 (0%) | 12mo | $130,000 | $112 | 89 |
| 2301 W Michigan Ave #25 | 0.04mi | 2/2.5 | 1,164 (0%) | 11mo | $155,000 | $133 | 89 |
| 2303 W Michigan Ave Unit F-5 | 0.08mi | 2/2.0 | 1,014 (-13%) | 7mo | $94,500 | $93 | 67 |
| 2303 W Michigan Ave Unit B12 | 0.08mi | 2/2.0 | 1,014 (-13%) | 10mo | $112,000 | $110 | 65 |
| 2303 W Michigan Ave Unit A-8 | 0.08mi | 2/2.0 | 1,014 (-13%) | 11mo | $103,000 | $102 | 64 |
| 2303 W Michigan Ave Unit C-7 | 0.08mi | 2/2.0 | 1,014 (-13%) | 11mo | $105,000 | $104 | 64 |
| 6103 East Shore Dr Unit B | 0.53mi | 2/2.0 | 1,212 (+4%) | 10mo | $170,000 | $140 | 58 |
| 2303 Michigan Ave Unit B-8 | 0.08mi | 2/2.0 | 1,014 (-13%) | 18mo | $120,000 | $118 | 58 |
Match score weights: distance 35% · size 25% · config 20% · recency 20%. Top-matched comps best support the ARV.
Projected returns pro-forma
-3.0% appreciation · 4.42% rent growth · sell at horizon
- IRR
- -16.6%
- Equity multiple
- 0.39×
- Total profit
- $-16,781
- Equity at exit
- $14,761
- IRR
- -4.0%
- Equity multiple
- 0.70×
- Total profit
- $-8,313
- Equity at exit
- $8,560
Cash invested: $27,720 (down + closing). Projections, not guarantees.
Landlord ↔ Tenant lean methodology
- Overall (STATE)
- 87 Strongly Landlord-Friendly
- State Florida
- 87 Strongly Landlord-Friendly · R+3
- County
- — inherits STATE
- City
- — inherits STATE
ZIP-level market 32526
- Home prices YoY
- -28.3%
- Rents YoY
- 4.4%
- Active inventory
- 417
- Price-to-rent
- 5.6×
Monthly cashflow live
- Estimated rent
- $1,476 high interval (Pro) →
- Mortgage (P&I)
- −$519
- Tax from tax record
- −$131 /mo · $1,572/yr
- Insurance
- −$41
- Flood insurance flood zone
- −$427 /mo · $5,118/yr
- HOA
- −$99
- Vacancy / Maint / Mgmt
- −$310
- Net cashflow
- $-51
Break-even live
UW: 25.0% down · 7.5% · 30yr · 1.5% tax · 5.0% vac · 8.0% maint · 8.0% mgmt
Financing live
Cash to close
- Down payment
- $24,750
- Closing costs
- $2,970
- Reserves months
- —
- Total cash needed
- —
Loan-product check · same deal, 3 products live
Conventional
25% down · 7.5% · 30yr
- Down + closing
- —
- Monthly P&I
- —
- Monthly cashflow
- —
- DSCR
- —
- Eligible?
- —
Personal DTI + credit; lowest rate.
DSCR
20% down · 8.5% · 30yr
- Down + closing
- —
- Monthly P&I
- —
- Monthly cashflow
- —
- DSCR
- —
- Eligible?
- —
No personal income docs; deal must DSCR.
Hard money
10% down · 12.0% · 12mo
- Down + closing
- —
- Monthly P&I
- —
- Monthly cashflow
- —
- DSCR
- —
- Eligible?
- —
Short-term bridge; refi at stabilization.
Rent comps 16 comps
| Address | Beds | Baths | Sqft | Rent | $/sqft | DOM | Units | Dist |
|---|---|---|---|---|---|---|---|---|
| 2301 W Michigan Ave #21 Pensacola, FL | 2.0 | 2.5 | 1164 | $1,325 | $1.14 | 23d | 1 | 0.01mi |
| 2303 W Michigan Ave Unit A6 Pensacola, FL | 2.0 | 2.0 | 1014 | $1,300 | $1.28 | 23d | 1 | 0.09mi |
| 5602 W Shore Dr Unit B Pensacola, FL | 2.0 | 2.0 | 920 | $1,250 | $1.36 | 23d | 1 | 0.13mi |
| 2300 W Michigan Ave #12 Pensacola, FL | 2.0 | 2.0 | 1050 | $1,300 | $1.24 | 23d | 1 | 0.34mi |
| 2355 W Michigan Ave Pensacola, FL | 1.0–2.0 | 1.0–2.0 | 850 | $1,450 | $1.71 | 13d | 9 | 0.47mi |
| 925 Twinbrook Ave Pensacola, FL | 3.0 | 1.0 | 1105 | $1,750 | $1.58 | 23d | 1 | 0.51mi |
| 918 Montclair Rd Pensacola, FL | 3.0 | 1.0 | 1012 | $1,500 | $1.48 | 13d | 1 | 0.54mi |
| 902 Lucerne Ave Pensacola, FL | 3.0 | 2.0 | 1276 | $1,600 | $1.25 | 23d | 1 | 0.59mi |
| 5180 Burlington Ave Pensacola, FL | 3.0 | 2.0 | 1184 | $1,650 | $1.39 | 23d | 1 | 0.98mi |
| 3216 Two Sisters Way Pensacola, FL | 3.0 | 2.0 | 1117 | $1,700 | $1.52 | 23d | 1 | 1.03mi |
| 5472 Dover Ave Pensacola, FL | 3.0 | 2.0 | 840 | $1,300 | $1.55 | 23d | 1 | 1.13mi |
| 221 Edison Dr Pensacola, FL | 3.0 | 1.0 | 1500 | $1,598 | $1.07 | 23d | 1 | 1.23mi |
| 2702 Massachusetts Ave Pensacola, FL | 1.0–3.0 | 1.0–2.5 | 1150 | $1,520 | $1.32 | 13d | 9 | 1.23mi |
| 5207 Charbar Dr Unit B Pensacola, FL | 2.0 | 1.0 | 850 | $1,050 | $1.24 | 23d | 1 | 1.28mi |
| 707 New York Dr Pensacola, FL | 2.0 | 1.0 | 1266 | $1,185 | $0.94 | 23d | 1 | 1.44mi |
| 6322 Louisville Ave Pensacola, FL | 3.0 | 2.0 | 1001 | $2,147 | $2.14 | 23d | 1 | 1.46mi |
HOA detail
- Monthly dues
- $99 · $1,188/yr
Listing history 22 events
-
2026-06-18days on market $99,000 Active 122 DOM
-
2026-06-17days on market $99,000 Active 121 DOM
-
2026-06-16days on market $99,000 Active 120 DOM
-
2026-06-15days on market $99,000 Active 119 DOM
-
2026-06-14days on market $99,000 Active 117 DOM
-
2026-06-10days on market $99,000 Active 114 DOM
-
2026-06-09days on market $99,000 Active 113 DOM
-
2026-06-08days on market $99,000 Active 112 DOM
-
2026-06-07days on market $99,000 Active 111 DOM
-
2026-06-03days on market $99,000 Active 107 DOM
-
2026-06-02days on market $99,000 Active 106 DOM
-
2026-06-01days on market $99,000 Active 105 DOM
-
2026-05-31days on market $99,000 Active 104 DOM
-
2026-05-31days on market $99,000 Active 103 DOM
-
2026-04-07price $99,000 106-char remark
Show marketing remark (106 chars)
Townhome Centrally located in Pensacola just off Michigan Ave. unit needs work . easy to show on combo box
-
2026-02-15$109,900 Active 106-char remark
Show marketing remark (106 chars)
Townhome Centrally located in Pensacola just off Michigan Ave. unit needs work . easy to show on combo box
-
2023-05-11price $129,000
-
2023-04-24$132,000 Active
-
2006-12-30soldstatus $111,000
-
2006-12-15soldstatus $110,000
-
2006-08-31$110,000
-
2005-08-10$110,000
ⓘ Source: listings_history table (triggers on properties + properties_extension) + one-shot
backfill from property_details.listing_events for pre-trigger history.
Tax reassessment forecast FL · Resets to sale price
- Current annual tax
- $1,572 · $131/mo
- Projected year-2 tax
- $1,572 · $131/mo
- Expected delta
- $0/yr ($0/mo · 0.0%)
ⓘ Screening estimate from a state-policy table — verify with the county assessor before closing.
Climate risk First Street
- Flood 5/10 Major FEMA zone AE · 49% chance over 30 yrs
- Wildfire 3/10 Moderate
- Heat 10/10 Extreme 6 d/yr ≥105°F today · 18 d/yr by 30 yrs out
- Wind 9/10 Extreme 99% chance of damaging wind over 30 yrs
- Air quality 1/10 Low 0 unhealthy d/yr today · 0 by 30 yrs out
Nearby sold comps map
Loading sold comps map…
Walkable amenities ~0.75 mi
Loading nearby amenities…
Taxation est. · year 1
- Rental income
- $17,716
- − Mortgage interest
- −$5,546
- − Property taxes
- −$1,572
- − Insurance
- −$5,614
- − Repairs & maintenance
- −$1,417
- − Management
- −$1,417
- − HOA
- −$1,188
- − Depreciation
- −$2,880
- Taxable loss
- −$1,918
- Est. tax savings @ 24.0%
- +$460
- After-tax cash flow
- $-148/yr
For passive investors: Depreciation is non-cash, so a rental often shows a tax loss while cash-flowing — sheltering income. Rental losses are passive: they offset passive income freely, and up to $25,000/yr can offset ordinary (W-2) income if you actively participate and your MAGI is under $100k (phasing out to $0 by $150k); unused losses carry forward. On sale, claimed depreciation is recaptured at up to 25%, and gains may owe capital-gains tax (a 1031 exchange can defer both). Figures are a year-1 estimate at your 24.0% rate — not tax advice; consult a CPA.
Condition & rehab AI · 8 photos
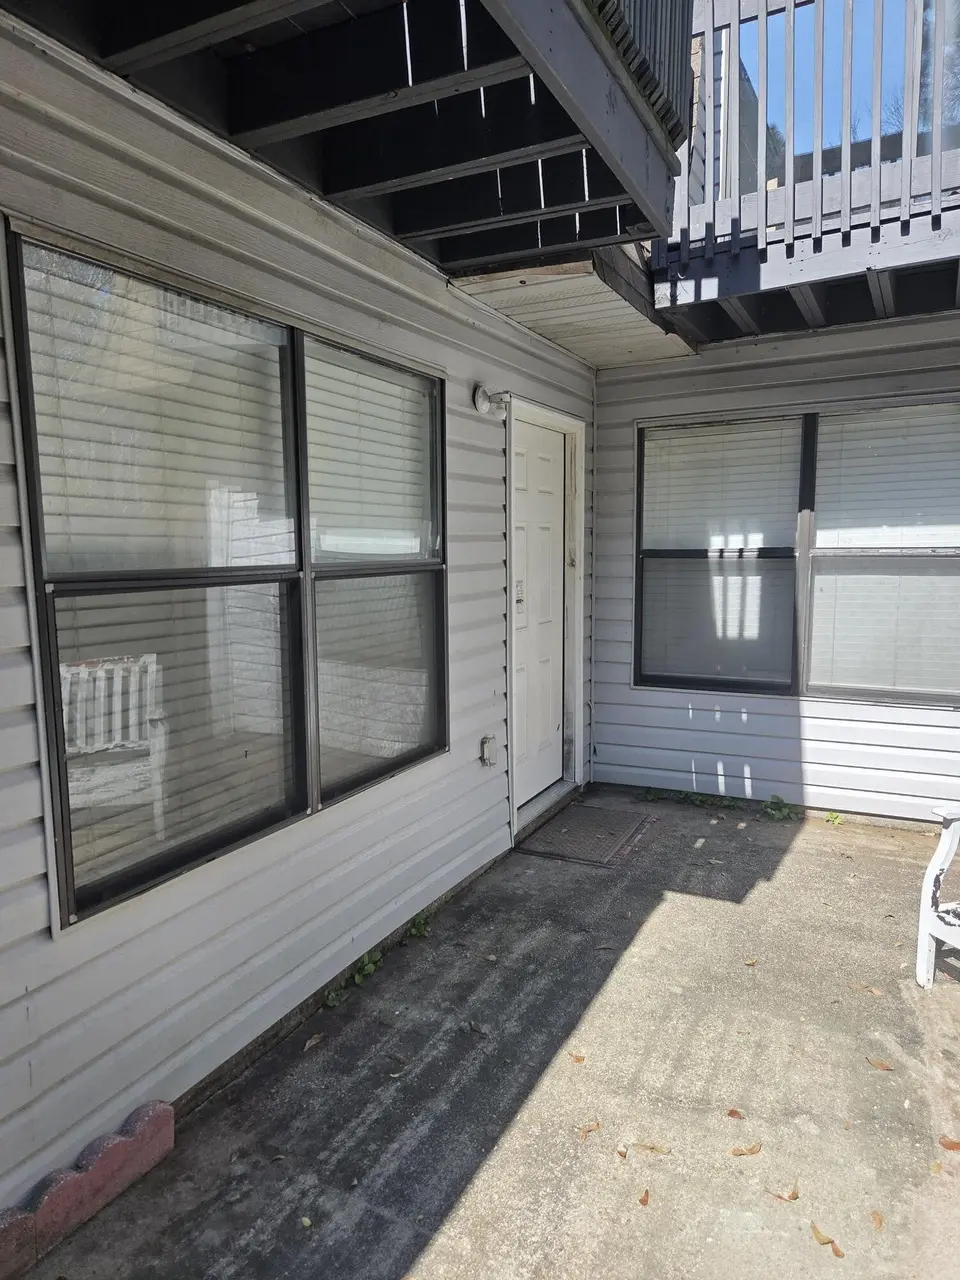
This townhome requires moderate repairs and maintenance, including painting and replacing the siding and carpet. These updates will significantly improve its curb appeal and value for both resale and rental.
Repairs flagged
- Major siding — Significant peeling and wear on the exterior siding
- Major paint — Peeling paint on the exterior and interior walls
- Minor flooring — Worn-out carpet in the living area that can be replaced
Value-add opportunities
- Resale Paint the exterior and interior walls — Fresh paint can significantly improve the home's curb appeal and value
- Rental Replace the carpet in the living area — New carpet will make the living area more appealing to renters
- Both Replace the siding and paint — This will improve the home's overall appearance and increase its value for both resale and rental
Renovation cost estimate screening
| Repair item | Severity | Est. cost |
|---|---|---|
| siding · Significant peeling and wear on the exterior siding | Major | $15,000–50,000 |
| paint · Peeling paint on the exterior and interior walls | Major | $15,000–50,000 |
| flooring · Worn-out carpet in the living area that can be replaced | Minor | $500–3,000 |
| Total estimated repair cost · 3 items | $30,500–103,000 |
Value-add ROI direction
- Resale Paint the exterior and interior walls — Fresh paint can significantly improve the home's curb appeal and value ↑
- Rental Replace the carpet in the living area — New carpet will make the living area more appealing to renters ↑
- Both Replace the siding and paint — This will improve the home's overall appearance and increase its value for both resale and rental ↑
ⓘ Cost ranges are severity-bucket heuristics (US national rule-of-thumb). Get contractor quotes + a written scope before underwriting a rehab budget.
Schools (NCES district)
- District
- Escambia
- NCES district ID
- 1200510
- Math proficiency
- 40% ▼ -9.00%
- Reading proficiency
- 45% ▼ -4.00%
- Median HH income
- $44,649
- Composite
- 36.04/100
- National rank
- #4773
- State rank
- #56 of 73 in FL
Livability — Bellview
- Score
- 67/100
- State rank
- #561
- US rank
- #10731
Category grades
Schools grade is shown separately in the Schools card above.
Census & demographics
- Census place
- Bellview, FL
- County
- Escambia County · 301,722 people
- Metro
- Pensacola-Ferry Pass-Brent, FL
- Population (ZIP)
- 44,680
- Household income
- $75,098
- Rent vs Own
- Severe rent burden
- 1166.0
Population outlook (Escambia County) Hauer SSP2
- Today (2025)
- 334,637 people
- By 2030
- 345,779 · +3.3%
- By 2040
- 364,828 · +9.0%
- By 2050
- 378,514 · +13.1%
- By 2075
- 403,220 · +20.5%
- By 2100
- 386,125 · +15.4%
Race, ethnicity, and origin ACS 2023
- Neighborhood character
- Predominantly White (66%)
- Race & ethnicity
- White 66% Black 19% Two or more races 8% Hispanic / Latino 5% Asian 3%
- Common ancestry
- Lithuanian 2% Slovak 2% Serbian 2%
- Foreign-born
- 5% · Canada, China
- Languages at home
- 94% English-only · Spanish 2% Tagalog/Filipino 1% Other Indo-European 1%
Political lean MEDSL · Escambia
- 2024 margin
- R (+19.5) · D 39.7% · R 59.2% · Other 1.1%
- 2008→2024 swing
- -0.2pp no change · 2008: -19.3pp · 2024: -19.5pp
- All cycles
- 2024: R+19.5 2020: R+15.1 2016: R+20.6 2012: R+20.6 2008: R+19.3
Not yet ingested
- Civics
- —
Market trends
- HPI YoY
- ▼ -99.68%
- Current HPI
- 252.6406
- Rent YoY
- ▲ 4.42%
- Metro
- Pensacola-Ferry Pass-Brent, FL
- State GDP YoY
- ▲ 3.28%
- F500 in state
- 36
Industry mix (Fortune 500 HQ in FL)
| Industry | F500 HQs | Revenue |
|---|---|---|
| Industrial Technology | 2 | $29B |
|
||
| Insurance | 2 | $17B |
|
||
| Retail | 1 | $60B |
|
||
| Technology Distribution | 1 | $58B |
|
||
| Homebuilding | 1 | $35B |
|
||
| Technology Manufacturing | 1 | $35B |
|
||
Price history
-10.0% since first listed8 events — show timeline
- 2026-04-07 Price Changed $99,000 ECAR
- 2026-02-15 Listed $109,900 ECAR
- 2023-05-11 Price Changed $129,000 ECAR
- 2023-04-24 Listed $132,000 ECAR
- 2006-12-30 Sold (MLS) $111,000 PARMLS
- 2006-12-15 Sold (MLS) $110,000 ECAR
- 2006-08-31 Listed $110,000 PARMLS
- 2005-08-10 Listed $110,000 ECAR
Property tax history
+14.4%/yrLatest (2025): $1,572 · +14.4% YoY. Source: county tax records.
Cash-flow waterfall
monthlySold comps — $/sqft
last 12 mo · ≤1 miLoading sold comps…