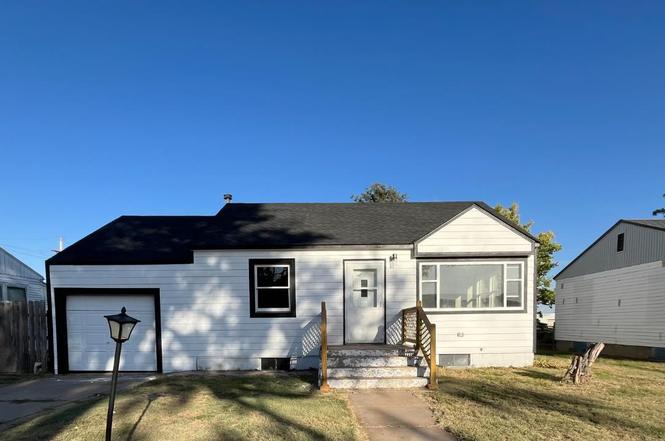
716 Colby Ave · Oakley, KS
Flood risk 1/10 · Minimal
- FEMA flood zone
- —
- Chance of flooding over 30 yrs
- 0.0%
- Est. flood insurance / yr
- —
Fire risk 4/10 · Minor
- Est. fire insurance / yr
- $1,154 – $2,142
Heat risk 4/10 · Minor
- Hot days now (above 101°F)
- 7 days/yr
- Hot days in 30 yrs
- 18 days/yr
Wind risk 2/10 · Minimal
- Chance of severe wind over 30 yrs
- —
Air-quality risk 2/10 · Minimal
- Unhealthy air days now
- 1 days/yr
- Unhealthy air days in 30 yrs
- 1 days/yr
Risk factors via First Street. Map © Google.
Why this score? — see what drove the D grade
The composite is a weighted blend of 9 inputs, each scored 0–100. Each bar is that input's sub-score; the figure is the points it added to the 100-point composite (weight × sub-score).
- Cash flow +10.8/30.0
- ARV discount +7.5/15.0
- Appreciation +7.4/10.0
- Livability +3.9/5.0
- 1% rule +3.2/10.0
- DSCR +3.1/10.0
- Rent growth +2.5/5.0
- Condition / age +2.5/5.0
- Schools +2.1/10.0
$99,000
🖨 Deal sheet (PDF) 📄 Offer letter ✓ Due diligence
Key facts
- Spacious backyard
- Attached garage
- New flooring
Tags
Property features AI
Exterior
- Parking: Attached garage (1 car)
- Home design: Single-family residence; Residential property
- Construction: Frame construction
- Exterior features: Lot approximately 0.15 acres
Interior
- Kitchen: Cooktop
- Bathrooms: 2 full bathrooms
- Interior features: Cooktop
Neighborhood map
What this means for you Summary
Snapshot
- This is a 2-bed/2.0-bath single-family listed at $99k.
Deal economics
- At list price, monthly cash flow is $-45 ($-538/yr) — negative.
- To cash-flow at today's rent, offer at most $93k (6.6% below list).
- To meet the 1% rule (rent ≥ 1% of price), the offer needs to be $81k (18.3% below list).
- Recommended offer: $81k (18.3% below list) — sets the bar for 1% rule.
Location & tenants
- Location reads 77/100 on livability (#38 in KS, #2,950 nationally) — a middle-class / working-renter tenant base. Strengths: cost of living A+, housing A+, health & safety A+; Watch: employment C-, amenities F, commute F.
- Oakley (rural): math 20% / reading 28% proficiency, ranked #139 of 169 in KS (top 82%) — low school quality limits family demand, transient renter base, plan for 1-2y turnover.
- Market conditions: 10 active listings in the ZIP.
Forward outlook
- In year one you build about $5k of equity ($684 loan paydown + $5k appreciation (4.8% local appreciation)).
- Logan County population projected at +20% by 2050 — long-run rental-demand tailwind backs the buy-and-hold thesis.
- At projected returns (4.8% appreciation + 3.0% rent growth), your $28k cash investment doubles in ~5 years — after that, you're playing with house money.
- By year 7, paydown + projected appreciation supports a ~$35k cash-out refi (75% LTV) — recoverable capital for the next deal without selling this one.
Negotiation context
- It's been on market 357 days — a 12% lower offer ($87k) is reasonable based on typical stale-listing flexibility.
- Current owner paid $14k; list at $99k implies a 633% gain — meaningful room to come down on a strong offer.
Risks & watch-outs
- Watch-outs: built in 1930 — expect roof / HVAC / electrical / plumbing capex.
Questions for the listing agent
- What do current leases actually rent for vs. the listed asking? Can we see a recent rent roll and the last 12 months of T-12 income?
- It's been on market 357 days. Have you received any prior offers? Is the seller open to a 18% concession, seller financing, or rate buy-down credit?
- Built in 1930 — when were the roof, HVAC, electrical panel, plumbing, and water heater last replaced?
- Why hasn't it sold? Are there any deal-killer items the seller is aware of (foundation, flood, title, zoning, code violations)?
- Is there a deadline driving the sale (1031 exchange, divorce, estate, relocation)? That informs how much negotiation room exists.
- The area grade is low — what's the realistic commute time and amenity access for the typical tenant pool here? Any planned neighborhood developments (good or bad) we should know about?
- What's the average days-on-market for RENTAL listings here right now (not sales)? A rising rental-DOM trend means longer vacancies and softer asking-rent achievability than the comps imply.
- What's the recent tenant-quality profile in this submarket — average credit score on applications, eviction rate, late-payment / NSF rate, and stable-employment percentage? A property-management company in the area should have these aggregated.
- How much new for-sale + rental construction is in the pipeline within 1–3 miles? Heavy new supply typically softens prices + rents 12–24 months out; constrained supply supports both.
Investment metrics
- 1% rule
- 0.82% ✗
- Cap rate
- 5.75%
- Cash-on-cash
- -1.94%
- DSCR
- 0.91
- GRM
- 10.2
CMA / ARV
No comps found within radius.
Projected returns pro-forma
4.78% appreciation · 3.0% rent growth · sell at horizon
- IRR
- 10.7%
- Equity multiple
- 1.68×
- Total profit
- $18,716
- Equity at exit
- $54,764
- IRR
- 12.1%
- Equity multiple
- 3.15×
- Total profit
- $59,699
- Equity at exit
- $93,426
Cash invested: $27,720 (down + closing). Projections, not guarantees.
Landlord ↔ Tenant lean methodology
- Overall (STATE)
- 83 Strongly Landlord-Friendly
- State Kansas
- 83 Strongly Landlord-Friendly · R+10
- County
- — inherits STATE
- City
- — inherits STATE
ZIP-level market 67748
- Home prices YoY
- 2.6%
- Active inventory
- 10
- Price-to-rent
- 10.2×
Monthly cashflow live
- Estimated rent
- $809 medium interval (Pro) →
- Mortgage (P&I)
- −$519
- Tax est. 1.5%
- −$124 /mo · $1,485/yr
- Insurance
- −$41
- HOA
- −$0
- Vacancy / Maint / Mgmt
- −$170
- Net cashflow
- $-45
Break-even live
Sensitivity live
| Price | -10% $24 | -5% $-11 | +0% $-45 | +5% $-79 | +10% $-113 |
|---|---|---|---|---|---|
| Rent | -10% $-109 | -5% $-77 | +0% $-45 | +5% $-13 | +10% $19 |
| Rate | -1.0pp $5 | -0.5pp $-20 | base $-45 | +0.5pp $-71 | +1.0pp $-97 |
UW: 25.0% down · 7.5% · 30yr · 1.5% tax · 5.0% vac · 8.0% maint · 8.0% mgmt
Financing live
Cash to close
- Down payment
- $24,750
- Closing costs
- $2,970
- Reserves months
- —
- Total cash needed
- —
Loan-product check · same deal, 3 products live
Conventional
25% down · 7.5% · 30yr
- Down + closing
- —
- Monthly P&I
- —
- Monthly cashflow
- —
- DSCR
- —
- Eligible?
- —
Personal DTI + credit; lowest rate.
DSCR
20% down · 8.5% · 30yr
- Down + closing
- —
- Monthly P&I
- —
- Monthly cashflow
- —
- DSCR
- —
- Eligible?
- —
No personal income docs; deal must DSCR.
Hard money
10% down · 12.0% · 12mo
- Down + closing
- —
- Monthly P&I
- —
- Monthly cashflow
- —
- DSCR
- —
- Eligible?
- —
Short-term bridge; refi at stabilization.
Listing history 18 events
-
2026-06-21days on market $99,000 Active 357 DOM
-
2026-06-18days on market $99,000 Active 355 DOM
-
2026-06-17days on market $99,000 Active 354 DOM
-
2026-06-16days on market $99,000 Active 353 DOM
-
2026-06-15days on market $99,000 Active 352 DOM
-
2026-06-13days on market $99,000 Active 350 DOM
-
2026-06-12days on market $99,000 Active 349 DOM
-
2026-06-09days on market $99,000 Active 346 DOM
-
2026-06-08days on market $99,000 Active 345 DOM
-
2026-06-07days on market $99,000 Active 344 DOM
-
2026-06-05days on market $99,000 Active 342 DOM
-
2026-06-04days on market $99,000 Active 340 DOM
-
2026-06-02days on market $99,000 Active 339 DOM
-
2026-06-01days on market $99,000 Active 338 DOM
-
2026-05-31days on market $99,000 Active 337 DOM
-
2026-05-31days on market $99,000 Active 336 DOM
-
2024-10-01$99,000 Active
-
2002-09-01soldstatus $13,500
ⓘ Source: listings_history table (triggers on properties + properties_extension) + one-shot
backfill from property_details.listing_events for pre-trigger history.
Climate risk First Street
- Flood 1/10 Low 0% chance over 30 yrs
- Wildfire 4/10 Moderate
- Heat 4/10 Moderate 7 d/yr ≥101°F today · 18 d/yr by 30 yrs out
- Wind 2/10 Low
- Air quality 2/10 Low 1 unhealthy d/yr today · 1 by 30 yrs out
Nearby sold comps map
Loading sold comps map…
Walkable amenities ~0.75 mi
Loading nearby amenities…
Taxation est. · year 1
- Rental income
- $9,711
- − Mortgage interest
- −$5,546
- − Property taxes
- −$1,485
- − Insurance
- −$495
- − Repairs & maintenance
- −$777
- − Management
- −$777
- − Depreciation
- −$2,880
- Taxable loss
- −$2,248
- Est. tax savings @ 24.0%
- +$540
- After-tax cash flow
- $1/yr
For passive investors: Depreciation is non-cash, so a rental often shows a tax loss while cash-flowing — sheltering income. Rental losses are passive: they offset passive income freely, and up to $25,000/yr can offset ordinary (W-2) income if you actively participate and your MAGI is under $100k (phasing out to $0 by $150k); unused losses carry forward. On sale, claimed depreciation is recaptured at up to 25%, and gains may owe capital-gains tax (a 1031 exchange can defer both). Figures are a year-1 estimate at your 24.0% rate — not tax advice; consult a CPA.
Schools (NCES district)
- District
- Oakley
- NCES district ID
- 2010050
- Math proficiency
- 20% ▼ -10.00%
- Reading proficiency
- 28% ▼ -7.00%
- Median HH income
- $45,077
- Composite
- 20.73/100
- National rank
- #8521
- State rank
- #139 of 169 in KS
Livability — Oakley
- Score
- 77/100
- State rank
- #38
- US rank
- #2950
Category grades
Schools grade is shown separately in the Schools card above.
Census & demographics
- Census place
- Oakley, KS
- Population (ZIP)
- 2,695
Population outlook (Logan County) Hauer SSP2
- Today (2025)
- 3,054 people
- By 2030
- 3,164 · +3.6%
- By 2040
- 3,376 · +10.5%
- By 2050
- 3,660 · +19.8%
- By 2075
- 4,503 · +47.4%
- By 2100
- 5,039 · +65.0%
Race, ethnicity, and origin ACS 2023
- Neighborhood character
- Predominantly White (89%)
- Race & ethnicity
- White 89% Hispanic / Latino 6% Two or more races 4% Native American 1%
- Hispanic origin (detail)
- Mexican 5%
- Common ancestry
- Italian 4% Slovak 3% Lithuanian 2%
- Foreign-born
- 2% · Canada
- Languages at home
- 94% English-only · Spanish 5% German/W. Germanic 1% Other Asian/Pacific 1%
Political lean MEDSL · Logan
- 2024 margin
- Solid R (+71.6) · D 13.1% · R 84.7% · Other 2.2%
- 2008→2024 swing
- -4.8pp toward R · 2008: -66.8pp · 2024: -71.6pp
- All cycles
- 2024: R+71.6 2020: R+72.8 2016: R+72.3 2012: R+68.4 2008: R+66.8
Not yet ingested
- Civics
- —
Market trends
- HPI YoY
- ▲ 4.78%
- Current HPI
- 191.2601
- Rent YoY
- —
- Metro
- —
- State GDP YoY
- —
- F500 in state
- 0
Price history
+633.3% since first listed2 events — show timeline
- 2024-10-01 Listed $99,000 SWKSBOR
- 2002-09-01 Sold (Public Records) $13,500 Public Records
Cash-flow waterfall
monthlySold comps — $/sqft
last 12 mo · ≤1 miLoading sold comps…