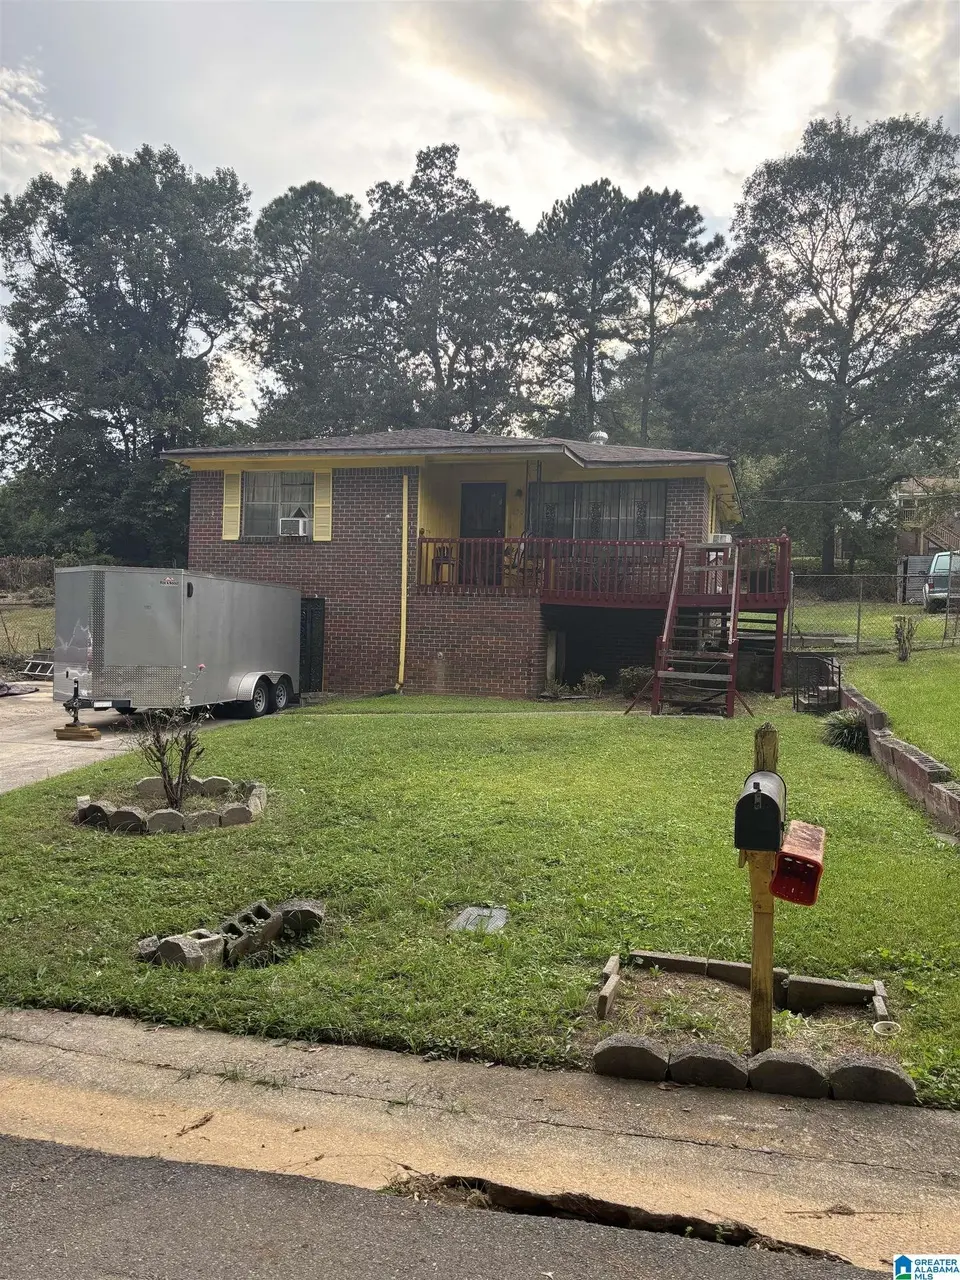
230 Marsh Ave · Hueytown, AL
Flood risk 1/10 · Minimal
- FEMA flood zone
- X (unshaded)
- Chance of flooding over 30 yrs
- 0.0%
- Est. flood insurance / yr
- $473 – $860
Fire risk 3/10 · Minor
- Est. fire insurance / yr
- $916 – $1,700
Heat risk 6/10 · Moderate
- Hot days now (above 108°F)
- 7 days/yr
- Hot days in 30 yrs
- 19 days/yr
Wind risk 6/10 · Moderate
- Chance of severe wind over 30 yrs
- 27.0%
Air-quality risk 3/10 · Minor
- Unhealthy air days now
- 3 days/yr
- Unhealthy air days in 30 yrs
- 5 days/yr
Risk factors via First Street. Map © Google.
Why this score? — see what drove the B grade
The composite is a weighted blend of 9 inputs, each scored 0–100. Each bar is that input's sub-score; the figure is the points it added to the 100-point composite (weight × sub-score).
- Cash flow +30.0/30.0
- 1% rule +10.0/10.0
- DSCR +10.0/10.0
- ARV discount +7.5/15.0
- Appreciation +4.7/10.0
- Rent growth +2.9/5.0
- Livability +2.9/5.0
- Condition / age +2.5/5.0
- Schools +1.8/10.0
$78,000
🖨 Deal sheet 📄 Offer letter ✓ Due diligence
Listing remarks MLS
Home is located in a good area of Hueytown and sits on two lots, Main level with Basement. House need some TCL, roof was replaced 3 years ago. Half bath and bedroom was being added in basement but not completed. Price to sell fast AS-IS Back on the Market, contract fell through
Key facts
- 1 acre lot
- Garage
- Built 1963
Neighborhood map
What this means for you Summary
Snapshot
- This is a 2-bed/1.0-bath single-family listed at $78k.
Deal economics
- At list price, monthly cash flow is $439 ($5k/yr) — positive.
- The deal already cash-flows at list — no discount required.
- Meets the 1% rule at list price ($1k rent vs $78k).
- Recommended offer: $69k (12.0% below list) — sets the bar for market timing.
- Cap rate 13.1% vs local median 5.9% in Hueytown — top-decile yield for the area; either an underpriced asset or a hidden risk that comps aren't pricing in. Stress-test before assuming the spread holds.
Location & tenants
- Location reads 57/100 on livability (#378 in AL) — a working-class tenant base; expect higher turnover. Strengths: cost of living A+, housing A+; Watch: employment D, schools F, crime F.
- Jefferson County (suburban): math 9% / reading 32% proficiency, ranked #104 of 129 in AL (top 81%) — low school quality limits family demand, transient renter base, plan for 1-2y turnover.
- Market conditions: Rents rising (+1.6%/yr); 250 active listings in the ZIP; 4 comparable units currently listed for rent nearby; rentals at typical pace (median 21d on market — plan ~3-4 weeks tenant-placement turnaround); 2,114 units permitted in Jefferson County in 2024 (556 in 5+ unit buildings).
Forward outlook
- In year one you build about $71 of equity ($539 loan paydown + $-468 appreciation (-0.6% local appreciation)).
- Jefferson County population projected to shrink 4% by 2050 — rents likely to lag national; underwrite the cash flow, not the appreciation.
- At projected returns (-0.6% appreciation + 1.6% rent growth), your $22k cash investment doubles in ~4 years — after that, you're playing with house money.
Negotiation context
- It's been on market 261 days — a 12% lower offer ($69k) is reasonable based on typical stale-listing flexibility.
- 2 sale attempts; this cycle's ask has dropped $27k (26%) from the opening price — seller is motivated, your offer sets the floor, not the list.
Risks & watch-outs
- Climate carrying-cost: major wind risk, 27% chance of damaging wind over 30y; extreme-heat days projected 7→19/yr by 2055 (HVAC capex compounding) — expect insurance premiums to compound above CPI over the hold.
Questions for the listing agent
- It's been on market 261 days. Have you received any prior offers? Is the seller open to a 12% concession, seller financing, or rate buy-down credit?
- Built in 1963 — when were the roof, HVAC, electrical panel, plumbing, and water heater last replaced?
- Why hasn't it sold? Are there any deal-killer items the seller is aware of (foundation, flood, title, zoning, code violations)?
- Is there a deadline driving the sale (1031 exchange, divorce, estate, relocation)? That informs how much negotiation room exists.
- Schools are F-rated, which usually means shorter tenancies and higher turnover. Who's the typical renter profile here, and what's been the actual vacancy rate?
- Crime grade is F in this area — have there been break-ins, vandalism, or insurance claims at this property in the last 3 years? What carrier currently insures it and at what premium?
- What's the average days-on-market for RENTAL listings here right now (not sales)? A rising rental-DOM trend means longer vacancies and softer asking-rent achievability than the comps imply.
- What's the recent tenant-quality profile in this submarket — average credit score on applications, eviction rate, late-payment / NSF rate, and stable-employment percentage? A property-management company in the area should have these aggregated.
- How much new for-sale + rental construction is in the pipeline within 1–3 miles? Heavy new supply typically softens prices + rents 12–24 months out; constrained supply supports both.
Investment metrics
- 1% rule
- 1.60% ✓
- Cap rate
- 13.05%
- Cash-on-cash
- 24.15%
- DSCR
- 2.07
- GRM
- 5.2
CMA / ARV
- ARV (median comp)
- $171,499
- List price
- $78,000
- Delta
- -54.52%
- Verdict
- UNDERPRICED
- Comps
- 20 within 1.0 mi
Show comp detail 3 sales within ~0.75 mi
| Address | Dist | Beds/Ba | Sqft | Sold | Price | $/sf | Match |
|---|---|---|---|---|---|---|---|
| 202 Mabelon Ct | 0.30mi | 3/1.0 (+1) | 1,593 (-14%) | 8mo | $157,000 | $99 | 52 |
| 141 Newport Dr | 0.67mi | 3/2.0 (+1) | 1,679 (-9%) | 10mo | $205,000 | $122 | 36 |
| 112 Newport Dr | 0.54mi | 3/2.0 (+1) | 1,578 (-14%) | 14mo | $145,000 | $92 | 30 |
Match score weights: distance 35% · size 25% · config 20% · recency 20%. Top-matched comps best support the ARV.
Projected returns pro-forma
-0.6% appreciation · 1.6% rent growth · sell at horizon
- IRR
- 21.7%
- Equity multiple
- 2.00×
- Total profit
- $21,825
- Equity at exit
- $20,337
- IRR
- 25.6%
- Equity multiple
- 3.57×
- Total profit
- $56,065
- Equity at exit
- $22,669
Cash invested: $21,840 (down + closing). Projections, not guarantees.
Landlord ↔ Tenant lean methodology
- Overall (STATE)
- 90 Strongly Landlord-Friendly
- State Alabama
- 90 Strongly Landlord-Friendly · R+15
- County
- — inherits STATE
- City
- — inherits STATE
ZIP-level market 35023
- Home prices YoY
- -0.1%
- Rents YoY
- 1.6%
- Active inventory
- 250
- Price-to-rent
- 5.2×
Monthly cashflow live
- Estimated rent
- $1,249 medium interval (Pro) →
- Mortgage (P&I)
- −$409
- Tax from tax record
- −$106 /mo · $1,271/yr
- Insurance
- −$32
- HOA
- −$0
- Vacancy / Maint / Mgmt
- −$262
- Net cashflow
- $439
Break-even live
UW: 25.0% down · 7.5% · 30yr · 1.5% tax · 5.0% vac · 8.0% maint · 8.0% mgmt
Financing live
Cash to close
- Down payment
- $19,500
- Closing costs
- $2,340
- Reserves months
- —
- Total cash needed
- —
Loan-product check · same deal, 3 products live
Conventional
25% down · 7.5% · 30yr
- Down + closing
- —
- Monthly P&I
- —
- Monthly cashflow
- —
- DSCR
- —
- Eligible?
- —
Personal DTI + credit; lowest rate.
DSCR
20% down · 8.5% · 30yr
- Down + closing
- —
- Monthly P&I
- —
- Monthly cashflow
- —
- DSCR
- —
- Eligible?
- —
No personal income docs; deal must DSCR.
Hard money
10% down · 12.0% · 12mo
- Down + closing
- —
- Monthly P&I
- —
- Monthly cashflow
- —
- DSCR
- —
- Eligible?
- —
Short-term bridge; refi at stabilization.
Rent comps 4 comps
| Address | Beds | Baths | Sqft | Rent | $/sqft | DOM | Units | Dist |
|---|---|---|---|---|---|---|---|---|
| 1983 Townhouse Ln Bessemer, AL | 2.0 | 2.0 | 1465 | $1,100 | $0.75 | 16d | 1 | 0.63mi |
| 106 Lindberg Rd Bessemer, AL | 3.0 | 2.0 | 1554 | $1,385 | $0.89 | 21d | 1 | 0.90mi |
| 123 Westbrook Rd Bessemer, AL | 3.0 | 2.0 | 1427 | $1,275 | $0.89 | 44d | 1 | 1.02mi |
| 216 Meadowood Ave Bessemer, AL | 3.0 | 1.0 | 1430 | $1,250 | $0.87 | 2d | 1 | 1.48mi |
Listing history 11 events
-
2026-06-18days on market $78,000 Active 261 DOM
-
2026-06-17days on market $78,000 Active 260 DOM
-
2026-06-16days on market $78,000 Active 259 DOM
-
2026-06-15statusdays on market $78,000 Active 258 DOM
-
2026-05-12price $78,000 279-char remark
Show marketing remark (279 chars)
Home is located in a good area of Hueytown and sits on two lots, Main level with Basement. House need some TCL, roof was replaced 3 years ago. Half bath and bedroom was being added in basement but not completed. Price to sell fast AS-IS Back on the Market, contract fell through
-
2026-05-12status Active 279-char remark
Show marketing remark (279 chars)
Home is located in a good area of Hueytown and sits on two lots, Main level with Basement. House need some TCL, roof was replaced 3 years ago. Half bath and bedroom was being added in basement but not completed. Price to sell fast AS-IS Back on the Market, contract fell through
-
2026-04-13historical Contingent 279-char remark
Show marketing remark (279 chars)
Home is located in a good area of Hueytown and sits on two lots, Main level with Basement. House need some TCL, roof was replaced 3 years ago. Half bath and bedroom was being added in basement but not completed. Price to sell fast AS-IS Back on the Market, contract fell through
-
2026-04-10status Pending 279-char remark
Show marketing remark (279 chars)
Home is located in a good area of Hueytown and sits on two lots, Main level with Basement. House need some TCL, roof was replaced 3 years ago. Half bath and bedroom was being added in basement but not completed. Price to sell fast AS-IS Back on the Market, contract fell through
-
2026-04-05price $80,000 279-char remark
Show marketing remark (279 chars)
Home is located in a good area of Hueytown and sits on two lots, Main level with Basement. House need some TCL, roof was replaced 3 years ago. Half bath and bedroom was being added in basement but not completed. Price to sell fast AS-IS Back on the Market, contract fell through
-
2026-01-09price $95,000 279-char remark
Show marketing remark (279 chars)
Home is located in a good area of Hueytown and sits on two lots, Main level with Basement. House need some TCL, roof was replaced 3 years ago. Half bath and bedroom was being added in basement but not completed. Price to sell fast AS-IS Back on the Market, contract fell through
-
2025-09-05$105,000 Active 279-char remark
Show marketing remark (279 chars)
Home is located in a good area of Hueytown and sits on two lots, Main level with Basement. House need some TCL, roof was replaced 3 years ago. Half bath and bedroom was being added in basement but not completed. Price to sell fast AS-IS Back on the Market, contract fell through
ⓘ Source: listings_history table (triggers on properties + properties_extension) + one-shot
backfill from property_details.listing_events for pre-trigger history.
Tax reassessment forecast AL · Resets to sale price
- Current annual tax
- $1,271 · $106/mo
- Projected year-2 tax
- $1,271 · $106/mo
- Expected delta
- $0/yr ($0/mo · 0.0%)
ⓘ Screening estimate from a state-policy table — verify with the county assessor before closing.
Climate risk First Street
- Flood 1/10 Low FEMA zone X (unshaded) · 0% chance over 30 yrs
- Wildfire 3/10 Moderate
- Heat 6/10 Major 7 d/yr ≥108°F today · 19 d/yr by 30 yrs out
- Wind 6/10 Major 27% chance of damaging wind over 30 yrs
- Air quality 3/10 Moderate 3 unhealthy d/yr today · 5 by 30 yrs out
Nearby sold comps map
Loading sold comps map…
Walkable amenities ~0.75 mi
Loading nearby amenities…
Taxation est. · year 1
- Rental income
- $14,991
- − Mortgage interest
- −$4,369
- − Property taxes
- −$1,271
- − Insurance
- −$390
- − Repairs & maintenance
- −$1,199
- − Management
- −$1,199
- − Depreciation
- −$2,269
- Taxable income
- $4,294
- Est. tax owed @ 24.0%
- −$1,030
- After-tax cash flow
- $4,243/yr
For passive investors: Depreciation is non-cash, so a rental often shows a tax loss while cash-flowing — sheltering income. Rental losses are passive: they offset passive income freely, and up to $25,000/yr can offset ordinary (W-2) income if you actively participate and your MAGI is under $100k (phasing out to $0 by $150k); unused losses carry forward. On sale, claimed depreciation is recaptured at up to 25%, and gains may owe capital-gains tax (a 1031 exchange can defer both). Figures are a year-1 estimate at your 24.0% rate — not tax advice; consult a CPA.
Schools (NCES district)
- District
- Jefferson County
- NCES district ID
- 0101920
- Math proficiency
- 9% ▼ -24.00%
- Reading proficiency
- 32% ▼ -5.00%
- Median HH income
- $51,712
- Composite
- 18.4/100
- National rank
- #8937
- State rank
- #104 of 129 in AL
Livability — Hueytown
- Score
- 57/100
- State rank
- #378
- US rank
- #21611
Category grades
Schools grade is shown separately in the Schools card above.
Census & demographics
- Census place
- Hueytown, AL
- County
- Jefferson County · 527,445 people
- Metro
- Birmingham-Hoover, AL
- Population (ZIP)
- 25,533
- Household income
- $69,863
- Rent vs Own
- Severe rent burden
- 247.0
Population outlook (Jefferson County) Hauer SSP2
- Today (2025)
- 669,185 people
- By 2030
- 669,694 · +0.1%
- By 2040
- 661,388 · -1.2%
- By 2050
- 643,086 · -3.9%
- By 2075
- 577,267 · -13.7%
- By 2100
- 474,758 · -29.1%
Race, ethnicity, and origin ACS 2023
- Neighborhood character
- Diverse neighborhood (Simpson 0.56)
- Race & ethnicity
- White 58% Black 30% Hispanic / Latino 7% Two or more races 3%
- Hispanic origin (detail)
- Mexican 5%
- Common ancestry
- Slovak 1% Lithuanian 1% Serbian 1%
- Foreign-born
- 4% · Canada
- Languages at home
- 93% English-only · Spanish 7%
Political lean MEDSL · Jefferson
- 2024 margin
- D (+10.4) · D 54.6% · R 44.2% · Other 1.2%
- 2008→2024 swing
- +5.4pp toward D · 2008: 5.1pp · 2024: 10.4pp
- All cycles
- 2024: D+10.4 2020: D+13.2 2016: D+7.2 2012: D+6.0 2008: D+5.1
Not yet ingested
- Civics
- —
Market trends
- HPI YoY
- ▼ -0.60%
- Current HPI
- 389.38
- Rent YoY
- ▲ 1.60%
- Metro
- Birmingham-Hoover, AL
- State GDP YoY
- ▲ 2.94%
- F500 in state
- 4
Industry mix (Fortune 500 HQ in AL)
| Industry | F500 HQs | Revenue |
|---|---|---|
| Financial Services | 1 | $8B |
|
||
| Healthcare | 1 | $5B |
|
||
Price history
-25.7% since first listed7 events — show timeline
- 2026-05-12 Price Changed $78,000 Greater Alabama MLS
- 2026-05-12 Relisted — Greater Alabama MLS
- 2026-04-13 Contingent — Greater Alabama MLS
- 2026-04-10 Pending — Greater Alabama MLS
- 2026-04-05 Price Changed $80,000 Greater Alabama MLS
- 2026-01-09 Price Changed $95,000 Greater Alabama MLS
- 2025-09-05 Listed $105,000 Greater Alabama MLS
Property tax history
+4.8%/yrLatest (2025): $1,271 · +0.0% YoY. Source: county tax records.
Cash-flow waterfall
monthlySold comps — $/sqft
last 12 mo · ≤1 miLoading sold comps…