 🏷️ Likely Rental
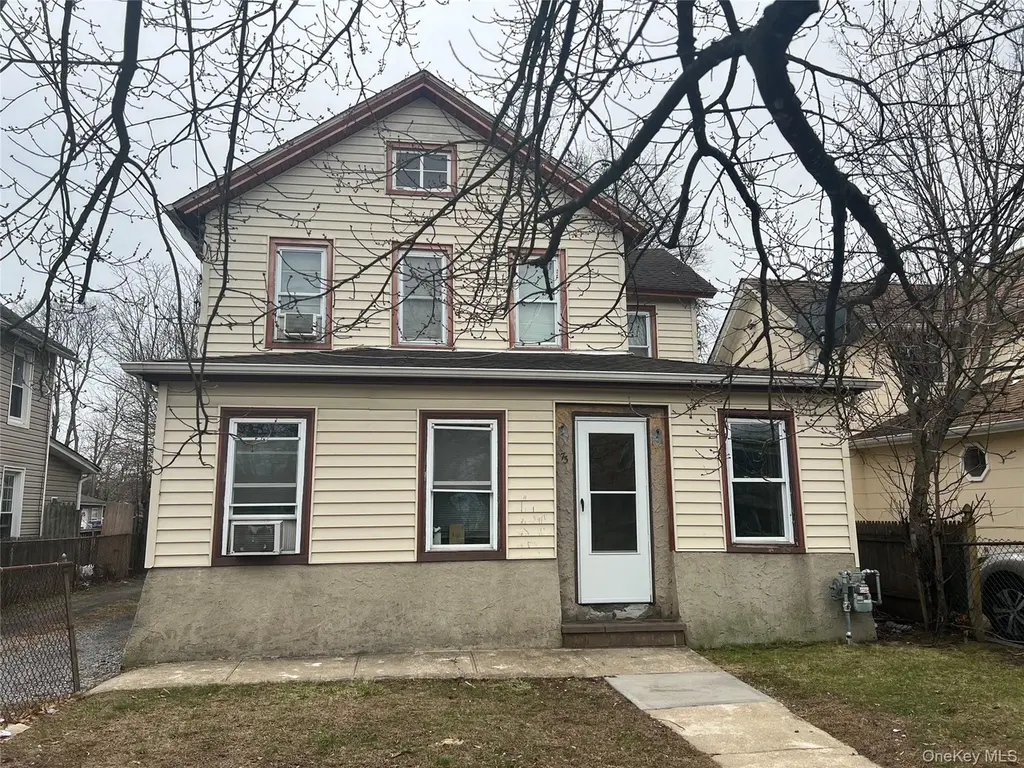
73 Raynor St · Freeport, NY
Flood risk 1/10 · Minimal
- FEMA flood zone
- X (unshaded)
- Chance of flooding over 30 yrs
- 0.0%
- Est. flood insurance / yr
- $473 – $860
Fire risk 5/10 · Moderate
- Est. fire insurance / yr
- $691 – $1,283
Heat risk 6/10 · Moderate
- Hot days now (above 95°F)
- 7 days/yr
- Hot days in 30 yrs
- 16 days/yr
Wind risk 6/10 · Moderate
- Chance of severe wind over 30 yrs
- 69.0%
Air-quality risk 4/10 · Minor
- Unhealthy air days now
- 5 days/yr
- Unhealthy air days in 30 yrs
- 8 days/yr
Risk factors via First Street. Map © Google.
Why this score? — see what drove the B+ grade
The composite is a weighted blend of 9 inputs, each scored 0–100. Each bar is that input's sub-score; the figure is the points it added to the 100-point composite (weight × sub-score).
- Cash flow +30.0/30.0
- ARV discount +15.0/15.0
- DSCR +10.0/10.0
- 1% rule +8.7/10.0
- Schools +4.6/10.0
- Livability +4.2/5.0
- Rent growth +2.5/5.0
- Condition / age +2.5/5.0
- Appreciation +0.0/10.0
$599,111
🖨 Deal sheet 📄 Offer letter ✓ Due diligence
Multi-family units
County records classify this as Multi-Family (2-4 Unit). Listing-text estimate: 1 unit. estimate disagrees with records
Listing remarks MLS
Location, location, location. Original gem. Both apartments are occupied on a month to month lease structure.
Key facts
- 7,880 sq ft lot
- Built 1898
- Listed 84 days
Neighborhood map
What this means for you Summary
Snapshot
- This is a 6-bed/2.0-bath multifamily listed at $599k.
Deal economics
- At list price, monthly cash flow is $2k ($29k/yr) — positive.
- The deal already cash-flows at list — no discount required.
- Meets the 1% rule at list price ($8k rent vs $599k).
- Recommended offer: $563k (6.0% below list) — sets the bar for market timing.
- Cap rate 11.1% vs local median 3.0% in Freeport — top-decile yield for the area; either an underpriced asset or a hidden risk that comps aren't pricing in. Stress-test before assuming the spread holds.
Location & tenants
- Location reads 83/100 on livability (#69 in NY, #1,033 nationally) — a professional / high-income tenant draw. Strengths: commute A+, employment A+, housing A+; Watch: cost of living F.
- Freeport Union Free School District (suburban): math 49% / reading 55% proficiency, ranked #325 of 590 in NY (top 55%) — acceptable for families but not a draw, mixed tenant base, ~2y average lease.
- Market conditions: 199 active listings in the ZIP; 1 comparable units currently listed for rent nearby; 824 units permitted in Nassau County in 2024 (153 in 5+ unit buildings).
Forward outlook
- Local home prices are declining (-3.0%/yr); year-one equity from $4k of loan paydown is wiped out by about $18k of value loss. Plan a longer hold.
- Nassau County population projected at +7% by 2050 — modest demand growth; plan on rents tracking national, not racing it.
- At projected returns (-3.0% appreciation + 3.0% rent growth), your $168k cash investment doubles in ~7 years — after that, you're playing with house money.
Negotiation context
- It's been on market 84 days — a 6% lower offer ($563k) is reasonable based on typical stale-listing flexibility.
- Current owner paid $115k; list at $599k implies a 421% gain — meaningful room to come down on a strong offer.
Risks & watch-outs
- Watch-outs: built in 1898 — expect roof / HVAC / electrical / plumbing capex.
- Climate carrying-cost: major wind risk, 69% chance of damaging wind over 30y; moderate wildfire risk; extreme-heat days projected 7→16/yr by 2055 (HVAC capex compounding) — expect insurance premiums to compound above CPI over the hold.
Questions for the listing agent
- It's been on market 84 days. Have you received any prior offers? Is the seller open to a 6% concession, seller financing, or rate buy-down credit?
- Built in 1898 — when were the roof, HVAC, electrical panel, plumbing, and water heater last replaced?
- Why hasn't it sold? Are there any deal-killer items the seller is aware of (foundation, flood, title, zoning, code violations)?
- Is there a deadline driving the sale (1031 exchange, divorce, estate, relocation)? That informs how much negotiation room exists.
- Schools are B-rated — typically a magnet for longer-tenancy family renters. What's the average tenant stay here, and is there a school-zone premium baked into asking?
- What's the average days-on-market for RENTAL listings here right now (not sales)? A rising rental-DOM trend means longer vacancies and softer asking-rent achievability than the comps imply.
- What's the recent tenant-quality profile in this submarket — average credit score on applications, eviction rate, late-payment / NSF rate, and stable-employment percentage? A property-management company in the area should have these aggregated.
- How much new apartment / multifamily construction is in the pipeline within 1–3 miles? Heavy new supply (>2% of stock underway) typically softens rents 12–24 months out; light construction supports rent growth.
Investment metrics
- 1% rule
- 1.37% ✓
- Cap rate
- 11.11%
- Cash-on-cash
- 17.20%
- DSCR
- 1.77
- GRM
- 6.1
CMA / ARV
- ARV (median comp)
- $1,065,850
- List price
- $599,111
- Delta
- -43.79%
- Verdict
- UNDERPRICED
- Comps
- 6 within 1.0 mi
Show comp detail 1 sale within ~0.75 mi
| Address | Dist | Beds/Ba | Sqft | Sold | Price | $/sf | Match |
|---|---|---|---|---|---|---|---|
| 31 Harding Pl | 0.62mi | 5/2.0 (-1) | 1,861 (+15%) | 10mo | $740,000 | $398 | 33 |
Match score weights: distance 35% · size 25% · config 20% · recency 20%. Top-matched comps best support the ARV.
Projected returns pro-forma
-3.0% appreciation · 3.0% rent growth · sell at horizon
- IRR
- 8.5%
- Equity multiple
- 1.33×
- Total profit
- $56,173
- Equity at exit
- $89,329
- IRR
- 17.8%
- Equity multiple
- 2.47×
- Total profit
- $246,529
- Equity at exit
- $51,800
Cash invested: $167,751 (down + closing). Projections, not guarantees.
Landlord ↔ Tenant lean methodology
- Overall (STATE)
- 15 Strongly Tenant-Friendly
- State New York
- 15 Strongly Tenant-Friendly · D+10
- County
- — inherits STATE
- City
- — inherits STATE
ZIP-level market 11520
- Active inventory
- 199
- Price-to-rent
- 18.2×
Monthly cashflow live
- Estimated rent
- $8,233 medium interval (Pro) →
- Mortgage (P&I)
- −$3,142
- Tax from tax record
- −$708 /mo · $8,495/yr
- Insurance
- −$250
- HOA
- −$0
- Vacancy / Maint / Mgmt
- −$1,729
- Net cashflow
- $2,405
Break-even live
3-unit breakdown (identical units grouped — click to expand)
| Units | Beds | Baths | Est. rent |
|---|---|---|---|
| 3× units | 2 | 1 | $8,232 |
| #1 | 2 | 1 | $2,744 |
| #2 | 2 | 1 | $2,744 |
| #3 | 2 | 1 | $2,744 |
| Total (3 units) | $8,233 | ||
UW: 25.0% down · 7.5% · 30yr · 1.5% tax · 5.0% vac · 8.0% maint · 8.0% mgmt
Financing live
Cash to close
- Down payment
- $149,778
- Closing costs
- $17,973
- Reserves months
- —
- Total cash needed
- —
Loan-product check · same deal, 3 products live
Conventional
25% down · 7.5% · 30yr
- Down + closing
- —
- Monthly P&I
- —
- Monthly cashflow
- —
- DSCR
- —
- Eligible?
- —
Personal DTI + credit; lowest rate.
DSCR
20% down · 8.5% · 30yr
- Down + closing
- —
- Monthly P&I
- —
- Monthly cashflow
- —
- DSCR
- —
- Eligible?
- —
No personal income docs; deal must DSCR.
Hard money
10% down · 12.0% · 12mo
- Down + closing
- —
- Monthly P&I
- —
- Monthly cashflow
- —
- DSCR
- —
- Eligible?
- —
Short-term bridge; refi at stabilization.
Rent comps 1 comps
| Address | Beds | Baths | Sqft | Rent | $/sqft | DOM | Units | Dist |
|---|---|---|---|---|---|---|---|---|
| 9 Ann Dr N Freeport, NY | 5.0 | 3.0 | 1400 | $4,300 | $3.07 | 1d | 1 | 0.82mi |
Listing history 18 events
-
2026-06-18days on market $599,111 Active 84 DOM
-
2026-06-17days on market $599,111 Active 83 DOM
-
2026-06-16days on market $599,111 Active 82 DOM
-
2026-06-15days on market $599,111 Active 81 DOM
-
2026-06-13days on market $599,111 Active 79 DOM
-
2026-06-12days on market $599,111 Active 78 DOM
-
2026-06-09days on market $599,111 Active 75 DOM
-
2026-06-08days on market $599,111 Active 74 DOM
-
2026-06-07days on market $599,111 Active 73 DOM
-
2026-06-07days on market $599,111 Active 72 DOM
-
2026-06-04days on market $599,111 Active 69 DOM
-
2026-06-02days on market $599,111 Active 68 DOM
-
2026-06-01days on market $599,111 Active 67 DOM
-
2026-05-31days on market $599,111 Active 66 DOM
-
2026-04-29price $599,111 110-char remark
Show marketing remark (110 chars)
Location, location, location. Original gem. Both apartments are occupied on a month to month lease structure.
-
2026-03-26$649,000 Active 110-char remark
Show marketing remark (110 chars)
Location, location, location. Original gem. Both apartments are occupied on a month to month lease structure.
-
1993-11-19soldstatus $115,000
-
1985-06-21soldstatus $90,000
ⓘ Source: listings_history table (triggers on properties + properties_extension) + one-shot
backfill from property_details.listing_events for pre-trigger history.
Tax reassessment forecast NY · Partial reset (capped growth)
- Current annual tax
- $8,495 · $708/mo
- Projected year-2 tax
- $9,310 · $776/mo
- Expected delta
- +$815/yr (+$68/mo · 9.6%)
ⓘ Screening estimate from a state-policy table — verify with the county assessor before closing.
Climate risk First Street
- Flood 1/10 Low FEMA zone X (unshaded) · 0% chance over 30 yrs
- Wildfire 5/10 Major
- Heat 6/10 Major 7 d/yr ≥95°F today · 16 d/yr by 30 yrs out
- Wind 6/10 Major 69% chance of damaging wind over 30 yrs
- Air quality 4/10 Moderate 5 unhealthy d/yr today · 8 by 30 yrs out
Nearby sold comps map
Loading sold comps map…
Walkable amenities ~0.75 mi
Loading nearby amenities…
Taxation est. · year 1
- Rental income
- $98,796
- − Mortgage interest
- −$33,560
- − Property taxes
- −$8,495
- − Insurance
- −$2,996
- − Repairs & maintenance
- −$7,904
- − Management
- −$7,904
- − Depreciation
- −$17,429
- Taxable income
- $20,509
- Est. tax owed @ 24.0%
- −$4,922
- After-tax cash flow
- $23,934/yr
For passive investors: Depreciation is non-cash, so a rental often shows a tax loss while cash-flowing — sheltering income. Rental losses are passive: they offset passive income freely, and up to $25,000/yr can offset ordinary (W-2) income if you actively participate and your MAGI is under $100k (phasing out to $0 by $150k); unused losses carry forward. On sale, claimed depreciation is recaptured at up to 25%, and gains may owe capital-gains tax (a 1031 exchange can defer both). Figures are a year-1 estimate at your 24.0% rate — not tax advice; consult a CPA.
Schools (NCES district)
- District
- Freeport Union Free School District
- NCES district ID
- 3611550
- Math proficiency
- 49% ▼ -4.00%
- Reading proficiency
- 55% ▲ 2.00%
- Median HH income
- $67,772
- Composite
- 46.12/100
- National rank
- #2507
- State rank
- #325 of 590 in NY
Livability — Freeport
- Score
- 83/100
- State rank
- #69
- US rank
- #1033
Category grades
Schools grade is shown separately in the Schools card above.
Census & demographics
- Census place
- Freeport, NY
- City population
- 44,873
- Population (ZIP)
- 44,873
Population outlook (Nassau County) Hauer SSP2
- Today (2025)
- 1,409,302 people
- By 2030
- 1,431,482 · +1.6%
- By 2040
- 1,471,607 · +4.4%
- By 2050
- 1,502,845 · +6.6%
- By 2075
- 1,575,403 · +11.8%
- By 2100
- 1,554,356 · +10.3%
Race, ethnicity, and origin ACS 2023
- Neighborhood character
- Diverse neighborhood (Simpson 0.67)
- Race & ethnicity
- Hispanic / Latino 43% Black 33% White 19% Two or more races 17% Asian 2%
- Hispanic origin (detail)
- Puerto Rican 4% Dominican 15%
- Common ancestry
- Hispanic 5% Scotch-Irish 1% Romanian 1%
- Foreign-born
- 34% · Canada, Jamaica, Guatemala
- Languages at home
- 55% English-only · Spanish 38% French/Haitian/Cajun 3% Other Indo-European 1%
Political lean MEDSL · Nassau
- 2024 margin
- Toss-up / Even · D 47.9% · R 52.1%
- 2008→2024 swing
- -12.6pp toward R · 2008: 8.4pp · 2024: -4.2pp
- All cycles
- 2024: R+4.2 2020: D+9.5 2016: D+5.3 2012: D+6.7 2008: D+8.4
Not yet ingested
- Civics
- —
Market trends
- HPI YoY
- ▼ -721.06%
- Current HPI
- 317.6076
- Rent YoY
- —
- Metro
- —
- State GDP YoY
- ▲ 2.60%
- F500 in state
- 92
Industry mix (Fortune 500 HQ in NY)
| Industry | F500 HQs | Revenue |
|---|---|---|
| Financial Services | 10 | $950B |
|
||
| Consumer Goods | 9 | $162B |
|
||
| Insurance | 4 | $225B |
|
||
| Telecommunications | 2 | $144B |
|
||
| Pharmaceuticals | 2 | $112B |
|
||
| Media / Entertainment | 2 | $69B |
|
||
Price history
+565.7% since first listed4 events — show timeline
- 2026-04-29 Price Changed $599,111 OneKey® MLS as Distributed by MLS Grid
- 2026-03-26 Listed $649,000 OneKey® MLS as Distributed by MLS Grid
- 1993-11-19 Sold (Public Records) $115,000 Public Records
- 1985-06-21 Sold (Public Records) $90,000 Public Records
Property tax history
+1.8%/yrLatest (2024): $8,495 · +4.8% YoY. Source: county tax records.
Cash-flow waterfall
monthlySold comps — $/sqft
last 12 mo · ≤1 miLoading sold comps…