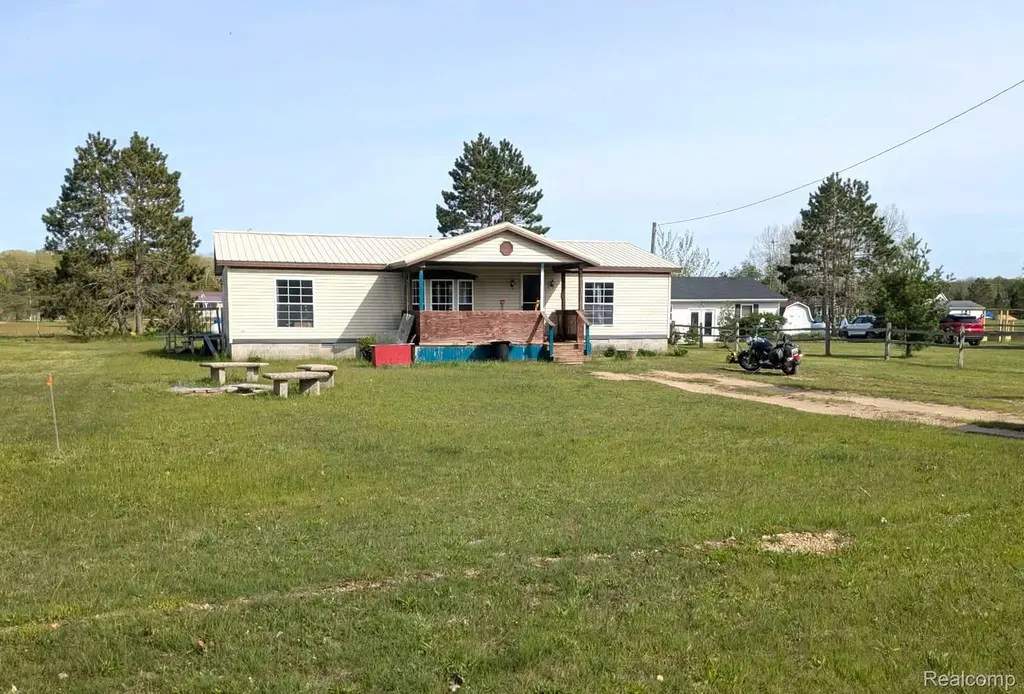
5554 N Sauble Lake Dr · Sauble, MI
Flood risk No data
- FEMA flood zone
- —
- Chance of flooding over 30 yrs
- —
- Est. flood insurance / yr
- —
Fire risk No data
- Est. fire insurance / yr
- —
Heat risk No data
- Hot days now (above threshold)
- —
- Hot days in 30 yrs
- —
Wind risk No data
- Chance of severe wind over 30 yrs
- —
Air-quality risk No data
- Unhealthy air days now
- —
- Unhealthy air days in 30 yrs
- —
Risk factors via First Street. Map © Google.
Why this score? — see what drove the C grade
The composite is a weighted blend of 9 inputs, each scored 0–100. Each bar is that input's sub-score; the figure is the points it added to the 100-point composite (weight × sub-score).
- Cash flow +16.3/30.0
- ARV discount +15.0/15.0
- Appreciation +10.0/10.0
- DSCR +5.0/10.0
- 1% rule +3.2/10.0
- Rent growth +2.5/5.0
- Livability +2.5/5.0
- Condition / age +2.5/5.0
- Schools +2.3/10.0
$139,500
🖨 Deal sheet 📄 Offer letter ✓ Due diligence
Listing remarks MLS
Just in time for Summer! This 3 bedroom 2 bath ranch has open concept living, kitchen and dining with lots of natural sunlight, covered front porch, rear wood deck and a convenient wood shed. This home has deeded lake access to all 4 Sauble Lakes. The location is close to ORV Trail Systems, North Country Hiking Trail, 1000s of acres of public land and 100s of lakes, rivers and streams! The home updates include: vanity & toilet Bathroom 2021, living/dining room flooring in 2020, primary bath toilet in 2021, furnace & central air 2023, metal roof in 2019; septic pumped in 2022; new pressure tank for well in 2018, new light fixtures in 2023. The home has a nice sized open yard.
Key facts
- Covered front porch
- Wood shed
- Open concept living
Tags
Property features AI
Exterior
- Parking: No garage
- Utilities: Private well water; Septic tank sewer
- Home design: Single-family residence; One level; Ground-level entry with steps
- Construction: Vinyl siding; Metal roof; Block foundation; Built on a 0.25-acre lot (approx. 88 x 170)
- Exterior features: Covered patio/porch; Deck; Porch; Shed(s); Paved road access; Waterfront on Sauble Lake
Interior
- Kitchen: Dishwasher; Free-standing electric range; Free-standing refrigerator
- Bedrooms: 7 total rooms (includes bedrooms and living space)
- Bathrooms: 2 full bathrooms
- Heating & cooling: Forced air heating (propane); Central air conditioning; Ceiling fans
- Interior features: Dishwasher; Free-standing electric range; Free-standing refrigerator; Crawl space
- Laundry & utility: Dedicated laundry room
Neighborhood map
What this means for you Summary
Snapshot
- This is a 3-bed/1.0-bath single-family listed at $140k.
Deal economics
- At list price, monthly cash flow is $76 ($910/yr) — positive.
- The deal already cash-flows at list — no discount required.
- To meet the 1% rule (rent ≥ 1% of price), the offer needs to be $115k (17.5% below list).
- Recommended offer: $115k (17.5% below list) — sets the bar for 1% rule.
Location & tenants
- Location reads: area grade C — affects rentability + tenant quality, not the cash-flow math above.
- Baldwin Community Schools (rural): math 21% / reading 28% proficiency, ranked #618 of 760 in MI (top 81%) — low school quality limits family demand, transient renter base, plan for 1-2y turnover; 85% free/reduced lunch — lower-income household profile, screen leases tightly.
- Market conditions: 64 active listings in the ZIP; 30 units permitted in Lake County in 2024 (0 in 5+ unit buildings).
Forward outlook
- In year one you build about $15k of equity ($964 loan paydown + $14k appreciation (10.0% local appreciation)).
- Lake County population projected at -22% by 2050 — secular population decline; favor cash flow + early exit over multi-decade hold.
- At projected returns (10.0% appreciation + 3.0% rent growth), your $39k cash investment doubles in ~3 years — after that, you're playing with house money.
- By year 3, paydown + projected appreciation supports a ~$38k cash-out refi (75% LTV) — recoverable capital for the next deal without selling this one.
Negotiation context
- It's been on market 24 days — a 2% lower offer ($137k) is reasonable based on typical stale-listing flexibility.
- 10 sale attempts since 22y ago with the ask held roughly flat each time — persistent listings suggest the price (not the market) is what's stuck; bring a comps-based counter.
- Current owner paid $33k; list at $140k implies a 323% gain — meaningful room to come down on a strong offer.
Questions for the listing agent
- Is there a deadline driving the sale (1031 exchange, divorce, estate, relocation)? That informs how much negotiation room exists.
- What's the average days-on-market for RENTAL listings here right now (not sales)? A rising rental-DOM trend means longer vacancies and softer asking-rent achievability than the comps imply.
- What's the recent tenant-quality profile in this submarket — average credit score on applications, eviction rate, late-payment / NSF rate, and stable-employment percentage? A property-management company in the area should have these aggregated.
- How much new for-sale + rental construction is in the pipeline within 1–3 miles? Heavy new supply typically softens prices + rents 12–24 months out; constrained supply supports both.
Investment metrics
- 1% rule
- 0.82% ✗
- Cap rate
- 6.95%
- Cash-on-cash
- 2.33%
- DSCR
- 1.10
- GRM
- 10.1
CMA / ARV
- ARV (on-the-fly)
- $192,192
- Comps found
- 1
Show comp detail 1 sale within ~0.75 mi
| Address | Dist | Beds/Ba | Sqft | Sold | Price | $/sf | Match |
|---|---|---|---|---|---|---|---|
| 7380 W White Birch Dr | 0.12mi | 3/1.5 | 1,152 (-8%) | 8mo | $177,000 | $154 | 73 |
Match score weights: distance 35% · size 25% · config 20% · recency 20%. Top-matched comps best support the ARV.
Projected returns pro-forma
10.0% appreciation · 3.0% rent growth · sell at horizon
- IRR
- 25.9%
- Equity multiple
- 3.07×
- Total profit
- $80,743
- Equity at exit
- $125,673
- IRR
- 22.8%
- Equity multiple
- 6.99×
- Total profit
- $233,850
- Equity at exit
- $271,018
Cash invested: $39,060 (down + closing). Projections, not guarantees.
Landlord ↔ Tenant lean methodology
- Overall (STATE)
- 62 Landlord-Friendly
- State Michigan
- 62 Landlord-Friendly · EVEN
- County
- — inherits STATE
- City
- — inherits STATE
ZIP-level market 49644
- Home prices YoY
- 12.6%
- Active inventory
- 64
- Price-to-rent
- 10.1×
Monthly cashflow live
- Estimated rent
- $1,150 medium interval (Pro) →
- Mortgage (P&I)
- −$732
- Tax from tax record
- −$43 /mo · $520/yr
- Insurance
- −$58
- HOA
- −$0
- Vacancy / Maint / Mgmt
- −$242
- Net cashflow
- $76
Break-even live
UW: 25.0% down · 7.5% · 30yr · 1.5% tax · 5.0% vac · 8.0% maint · 8.0% mgmt
Financing live
Cash to close
- Down payment
- $34,875
- Closing costs
- $4,185
- Reserves months
- —
- Total cash needed
- —
Loan-product check · same deal, 3 products live
Conventional
25% down · 7.5% · 30yr
- Down + closing
- —
- Monthly P&I
- —
- Monthly cashflow
- —
- DSCR
- —
- Eligible?
- —
Personal DTI + credit; lowest rate.
DSCR
20% down · 8.5% · 30yr
- Down + closing
- —
- Monthly P&I
- —
- Monthly cashflow
- —
- DSCR
- —
- Eligible?
- —
No personal income docs; deal must DSCR.
Hard money
10% down · 12.0% · 12mo
- Down + closing
- —
- Monthly P&I
- —
- Monthly cashflow
- —
- DSCR
- —
- Eligible?
- —
Short-term bridge; refi at stabilization.
Listing history 45 events
-
2026-06-18days on market $139,500 Active 24 DOM
-
2026-06-17days on market $139,500 Active 23 DOM
-
2026-06-16days on market $139,500 Active 22 DOM
-
2026-06-15days on market $139,500 Active 21 DOM
-
2026-06-13days on market $139,500 Active 19 DOM
-
2026-06-12days on market $139,500 Active 18 DOM
-
2026-06-09days on market $139,500 Active 15 DOM
-
2026-06-09price $139,500 Active 14 DOM
-
2026-06-08days on market $140,000 Active 14 DOM
-
2026-06-07days on market $140,000 Active 13 DOM
-
2026-06-07days on market $140,000 Active 12 DOM
-
2026-06-04days on market $140,000 Active 9 DOM
-
2026-06-02days on market $140,000 Active 8 DOM
-
2026-06-01pricedays on market $140,000 Active 7 DOM
-
2026-05-31days on market $145,900 Active 6 DOM
-
2026-05-31days on market $145,900 Active 5 DOM
-
2026-05-25$145,900 Active
Show marketing remark (695 chars)
Just in time for Summer! This 3 bedroom 2 bath ranch has open concept living, kitchen and dining with lots of natural sunlight, covered front porch, rear wood deck and a convenient wood shed. This home has deeded lake access to all 4 Sauble Lakes. The location is close to ORV Trail Systems, North Country Hiking Trail, 1000s of acres of public land and 100s of lakes, rivers and streams! The home updates include: vanity & toilet Bathroom 2021, living/dining room flooring in 2020, primary bath toilet in 2021, furnace & central air 2023, metal roof in 2019; septic pumped in 2022; new pressure tank for well in 2018, new light fixtures in 2023. The home has a nice sized open yard.
-
2026-05-25$145,900 Active 695-char remark
Show marketing remark (695 chars)
Just in time for Summer! This 3 bedroom 2 bath ranch has open concept living, kitchen and dining with lots of natural sunlight, covered front porch, rear wood deck and a convenient wood shed. This home has deeded lake access to all 4 Sauble Lakes. The location is close to ORV Trail Systems, North Country Hiking Trail, 1000s of acres of public land and 100s of lakes, rivers and streams! The home updates include: vanity & toilet Bathroom 2021, living/dining room flooring in 2020, primary bath toilet in 2021, furnace & central air 2023, metal roof in 2019; septic pumped in 2022; new pressure tank for well in 2018, new light fixtures in 2023. The home has a nice sized open yard.
-
2025-04-09historical
-
2025-04-09historical
-
2024-08-26price $130,000
-
2024-08-24price $130,000
-
2024-08-23price $130,000
-
2024-08-06price $139,900
-
2024-08-06price $139,900
-
2024-08-06price $139,900
-
2024-07-12price $144,900
-
2024-07-12price $144,900
-
2024-07-12price $144,900
-
2024-06-14$149,900 Active
-
2024-06-14$149,900 Active
-
2015-01-24historical
-
2015-01-24historical
-
2014-09-15historical
-
2014-09-10soldstatus $33,000
-
2009-10-08historical
-
2009-04-08$63,900
-
2009-04-08$63,900
-
2007-04-01$69,900
-
2006-10-07soldstatus $45,000
-
2005-12-06historical
-
2005-09-15historical
-
2004-08-10$55,000
-
2004-08-10$55,000
-
2004-08-10$55,000
ⓘ Source: listings_history table (triggers on properties + properties_extension) + one-shot
backfill from property_details.listing_events for pre-trigger history.
Tax reassessment forecast MI · Partial reset (capped growth)
- Current annual tax
- $520 · $43/mo
- Projected year-2 tax
- $1,334 · $111/mo
- Expected delta
- +$814/yr (+$68/mo · 156.5%)
ⓘ Screening estimate from a state-policy table — verify with the county assessor before closing.
Nearby sold comps map
Loading sold comps map…
Walkable amenities ~0.75 mi
Loading nearby amenities…
Taxation est. · year 1
- Rental income
- $13,806
- − Mortgage interest
- −$7,814
- − Property taxes
- −$520
- − Insurance
- −$698
- − Repairs & maintenance
- −$1,104
- − Management
- −$1,104
- − Depreciation
- −$4,058
- Taxable loss
- −$1,493
- Est. tax savings @ 24.0%
- +$358
- After-tax cash flow
- $1,269/yr
For passive investors: Depreciation is non-cash, so a rental often shows a tax loss while cash-flowing — sheltering income. Rental losses are passive: they offset passive income freely, and up to $25,000/yr can offset ordinary (W-2) income if you actively participate and your MAGI is under $100k (phasing out to $0 by $150k); unused losses carry forward. On sale, claimed depreciation is recaptured at up to 25%, and gains may owe capital-gains tax (a 1031 exchange can defer both). Figures are a year-1 estimate at your 24.0% rate — not tax advice; consult a CPA.
Schools (NCES district)
- District
- Baldwin Community Schools
- NCES district ID
- 2603810
- Math proficiency
- 21% ▲ 3.00%
- Reading proficiency
- 28% ▼ -2.00%
- Median HH income
- $27,638
- Composite
- 22.56/100
- National rank
- #13447
- State rank
- #618 of 760 in MI
Livability — Sauble
No livability data for this city. (Only ~50 U.S. cities are tracked.)
Census & demographics
- Population (ZIP)
- 1,846
Population outlook (Lake County) Hauer SSP2
- Today (2025)
- 10,933 people
- By 2030
- 10,503 · -3.9%
- By 2040
- 9,470 · -13.4%
- By 2050
- 8,526 · -22.0%
- By 2075
- 7,160 · -34.5%
- By 2100
- 5,634 · -48.5%
Race, ethnicity, and origin ACS 2023
- Neighborhood character
- Predominantly White (92%)
- Race & ethnicity
- White 92% Two or more races 6% Hispanic / Latino 1%
- Common ancestry
- Romanian 8% Iranian 4% Lithuanian 2%
- Foreign-born
- 0%
- Languages at home
- 99% English-only · Spanish 1%
Political lean MEDSL · Lake
- 2024 margin
- Solid R (+32.2) · D 33.2% · R 65.4% · Other 1.4%
- 2008→2024 swing
- -44.5pp toward R · 2008: 12.3pp · 2024: -32.2pp
- All cycles
- 2024: R+32.2 2020: R+26.2 2016: R+22.9 2012: D+5.0 2008: D+12.3
Not yet ingested
- Civics
- —
Market trends
- HPI YoY
- ▲ 26.53%
- Current HPI
- 236.7989
- Rent YoY
- —
- Metro
- —
- State GDP YoY
- ▲ 1.37%
- F500 in state
- 28
Industry mix (Fortune 500 HQ in MI)
| Industry | F500 HQs | Revenue |
|---|---|---|
| Automotive Parts | 3 | $48B |
|
||
| Automotive | 2 | $372B |
|
||
| Chemicals | 1 | $45B |
|
||
| Automotive Retail | 1 | $29B |
|
||
| Healthcare / Medical Devices | 1 | $23B |
|
||
| Automotive Technology | 1 | $20B |
|
||
Price history
+165.3% since first listed29 events — show timeline
- 2026-05-25 Listed $145,900 REALCOMP
- 2026-05-25 Listed $145,900 MiRealSource-MiMLS
- 2025-04-09 Listing Removed — REALCOMP
- 2025-04-09 Listing Removed — MiRealSource-MiMLS
- 2024-08-26 Price Changed $130,000 REALCOMP
- 2024-08-24 Price Changed $130,000 MiRealSource-MiMLS
- 2024-08-23 Price Changed $130,000 SW Michigan MLS
- 2024-08-06 Price Changed $139,900 MiRealSource-MiMLS
- 2024-08-06 Price Changed $139,900 REALCOMP
- 2024-08-06 Price Changed $139,900 SW Michigan MLS
- 2024-07-12 Price Changed $144,900 MiRealSource-MiMLS
- 2024-07-12 Price Changed $144,900 REALCOMP
- 2024-07-12 Price Changed $144,900 SW Michigan MLS
- 2024-06-14 Listed $149,900 REALCOMP
- 2024-06-14 Listed $149,900 MiRealSource-MiMLS
- 2015-01-24 Listing Removed — SW Michigan MLS
- 2015-01-24 Listing Removed — SW Michigan MLS
- 2014-09-15 Listing Removed — SW Michigan MLS
- 2014-09-10 Sold (Public Records) $33,000 Public Records
- 2009-10-08 Listing Removed — REALCOMP
- 2009-04-08 Listed $63,900 REALCOMP
- 2009-04-08 Listed $63,900 SW Michigan MLS
- 2007-04-01 Listed $69,900 SW Michigan MLS
- 2006-10-07 Sold (Public Records) $45,000 Public Records
- 2005-12-06 Listing Removed — REALCOMP
- 2005-09-15 Listing Removed — SW Michigan MLS
- 2004-08-10 Listed $55,000 SW Michigan MLS
- 2004-08-10 Listed $55,000 REALCOMP
- 2004-08-10 Listed $55,000 SW Michigan MLS
Property tax history
-2.2%/yrLatest (2024): $520 · +4.9% YoY. Source: county tax records.
Cash-flow waterfall
monthlySold comps — $/sqft
last 12 mo · ≤1 miLoading sold comps…