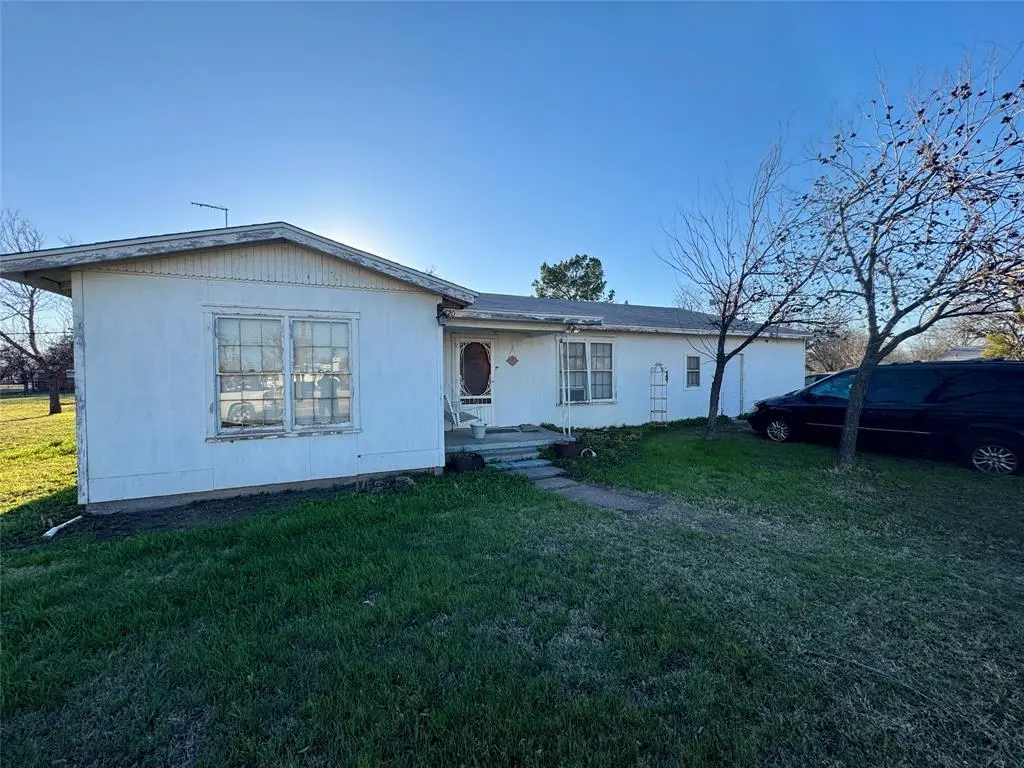
620 5th St · Hawley, TX
Flood risk 3/10 · Minor
- FEMA flood zone
- X (unshaded)
- Chance of flooding over 30 yrs
- 0.2%
- Est. flood insurance / yr
- $507 – $1,088
Fire risk 8/10 · Major
- Est. fire insurance / yr
- $1,222 – $2,270
Heat risk 7/10 · Major
- Hot days now (above 105°F)
- 7 days/yr
- Hot days in 30 yrs
- 21 days/yr
Wind risk 4/10 · Minor
- Chance of severe wind over 30 yrs
- 10.0%
Air-quality risk 1/10 · Minimal
- Unhealthy air days now
- 0 days/yr
- Unhealthy air days in 30 yrs
- 0 days/yr
Risk factors via First Street. Map © Google.
Why this score? — see what drove the D grade
The composite is a weighted blend of 9 inputs, each scored 0–100. Each bar is that input's sub-score; the figure is the points it added to the 100-point composite (weight × sub-score).
- ARV discount +15.0/15.0
- Appreciation +8.0/10.0
- Cash flow +6.8/30.0
- Livability +3.4/5.0
- Rent growth +2.5/5.0
- Schools +2.5/10.0
- Condition / age +2.5/5.0
- 1% rule +1.5/10.0
- DSCR +1.0/10.0
$209,000
🖨 Deal sheet (PDF) 📄 Offer letter ✓ Due diligence
Listing remarks MLS
This generously sized 3-bedroom, 2-bath home situated on a double city lot in the heart of Hawley, Texas. Offering approximately 1,770 square feet, this property features two separate living areas, providing flexible space for entertaining, relaxing, or working from home. The kitchen and dining area flow naturally into the family room, while original hardwood floors add character throughout much of the home. The converted garage serves as a versatile shop or workspace. Located 20 minutes from the OpenAI Data Center in Abilene and 40 minutes from the two Google data centers in Haskell, this property presents strong potential as a workforce rental.
Key facts
- Converted garage
- Double city lot
- 0.32 acre lot
Tags
Neighborhood map
What this means for you Summary
Snapshot
- This is a 3-bed/1.5-bath single-family listed at $209k.
Deal economics
- At list price, monthly cash flow is $-326 ($-4k/yr) — negative.
- To cash-flow at today's rent, offer at most $151k (27.5% below list).
- To meet the 1% rule (rent ≥ 1% of price), the offer needs to be $136k (35.0% below list).
- Recommended offer: $136k (35.0% below list) — sets the bar for 1% rule.
- Cap rate 4.4% vs local median 2.3% in Hawley — top-decile yield for the area; either an underpriced asset or a hidden risk that comps aren't pricing in. Stress-test before assuming the spread holds.
Location & tenants
- Location reads 68/100 on livability (#459 in TX) — a middle-class / working-renter tenant base. Strengths: crime A+, cost of living A+, housing A+; Watch: employment C-, health & safety C-, amenities F.
- Hawley ISD (rural): math 27% / reading 31% proficiency, ranked #642 of 826 in TX (top 78%) — low school quality limits family demand, transient renter base, plan for 1-2y turnover.
- Zoned schools: Hawley El (math 27% / reading 32%, grade F, #2,525 of 4,322 statewide, top 62%, 406 students, 55% FRL); Hawley Middle (math 32% / reading 22%, grade F, #1,177 of 1,662 statewide, top 72%, 200 students, 52% FRL); Hawley H S (math 15% / reading 54%, grade F, #959 of 1,632 statewide, top 59%, 213 students, 49% FRL).
- Market conditions: 78 active listings in the ZIP; 1 units permitted in Jones County in 2024 (0 in 5+ unit buildings).
Forward outlook
- In year one you build about $14k of equity ($1k loan paydown + $12k appreciation (6.0% local appreciation)).
- Jones County population projected at +13% by 2050 — modest demand growth; plan on rents tracking national, not racing it.
- By year 3, paydown + projected appreciation supports a ~$34k cash-out refi (75% LTV) — recoverable capital for the next deal without selling this one.
Negotiation context
- It's been on market 119 days — a 9% lower offer ($190k) is reasonable based on typical stale-listing flexibility.
Risks & watch-outs
- Watch-outs: built in 1951 — expect roof / HVAC / electrical / plumbing capex.
- Climate carrying-cost: severe wildfire risk; extreme-heat days projected 7→21/yr by 2055 (HVAC capex compounding) — expect insurance premiums to compound above CPI over the hold.
Questions for the listing agent
- What do current leases actually rent for vs. the listed asking? Can we see a recent rent roll and the last 12 months of T-12 income?
- It's been on market 119 days. Have you received any prior offers? Is the seller open to a 35% concession, seller financing, or rate buy-down credit?
- Built in 1951 — when were the roof, HVAC, electrical panel, plumbing, and water heater last replaced?
- Why hasn't it sold? Are there any deal-killer items the seller is aware of (foundation, flood, title, zoning, code violations)?
- Is there a deadline driving the sale (1031 exchange, divorce, estate, relocation)? That informs how much negotiation room exists.
- Schools are F-rated, which usually means shorter tenancies and higher turnover. Who's the typical renter profile here, and what's been the actual vacancy rate?
- The area grade is low — what's the realistic commute time and amenity access for the typical tenant pool here? Any planned neighborhood developments (good or bad) we should know about?
- What's the average days-on-market for RENTAL listings here right now (not sales)? A rising rental-DOM trend means longer vacancies and softer asking-rent achievability than the comps imply.
- What's the recent tenant-quality profile in this submarket — average credit score on applications, eviction rate, late-payment / NSF rate, and stable-employment percentage? A property-management company in the area should have these aggregated.
- How much new for-sale + rental construction is in the pipeline within 1–3 miles? Heavy new supply typically softens prices + rents 12–24 months out; constrained supply supports both.
Investment metrics
- 1% rule
- 0.65% ✗
- Cap rate
- 4.42%
- Cash-on-cash
- -6.68%
- DSCR
- 0.70
- GRM
- 12.8
CMA / ARV
- ARV (median comp)
- $280,330
- List price
- $209,000
- Delta
- -25.45%
- Verdict
- UNDERPRICED
- Comps
- 9 within 1.0 mi
Show comp detail 1 sale within ~0.75 mi
| Address | Dist | Beds/Ba | Sqft | Sold | Price | $/sf | Match |
|---|---|---|---|---|---|---|---|
| 12222 US Highway 277 S | 0.71mi | 3/2.0 | 2,286 (-10%) | 10mo | $449,900 | $197 | 39 |
Match score weights: distance 35% · size 25% · config 20% · recency 20%. Top-matched comps best support the ARV.
Projected returns pro-forma
5.95% appreciation · 3.0% rent growth · sell at horizon
- IRR
- 9.8%
- Equity multiple
- 1.66×
- Total profit
- $38,902
- Equity at exit
- $130,666
- IRR
- 11.1%
- Equity multiple
- 3.24×
- Total profit
- $130,840
- Equity at exit
- $236,337
Cash invested: $58,520 (down + closing). Projections, not guarantees.
Landlord ↔ Tenant lean methodology
- Overall (STATE)
- 87 Strongly Landlord-Friendly
- State Texas
- 87 Strongly Landlord-Friendly · R+5
- County
- — inherits STATE
- City
- — inherits STATE
ZIP-level market 79525
- Home prices YoY
- 3.0%
- Active inventory
- 78
- Price-to-rent
- 12.8×
Monthly cashflow live
- Estimated rent
- $1,358 medium interval (Pro) →
- Mortgage (P&I)
- −$1,096
- Tax from tax record
- −$216 /mo · $2,587/yr
- Insurance
- −$87
- HOA
- −$0
- Vacancy / Maint / Mgmt
- −$285
- Net cashflow
- $-326
Break-even live
Sensitivity live
| Price | -10% $-208 | -5% $-267 | +0% $-326 | +5% $-385 | +10% $-444 |
|---|---|---|---|---|---|
| Rent | -10% $-433 | -5% $-380 | +0% $-326 | +5% $-272 | +10% $-219 |
| Rate | -1.0pp $-221 | -0.5pp $-273 | base $-326 | +0.5pp $-380 | +1.0pp $-435 |
UW: 25.0% down · 7.5% · 30yr · 1.5% tax · 5.0% vac · 8.0% maint · 8.0% mgmt
Financing live
Cash to close
- Down payment
- $52,250
- Closing costs
- $6,270
- Reserves months
- —
- Total cash needed
- —
Loan-product check · same deal, 3 products live
Conventional
25% down · 7.5% · 30yr
- Down + closing
- —
- Monthly P&I
- —
- Monthly cashflow
- —
- DSCR
- —
- Eligible?
- —
Personal DTI + credit; lowest rate.
DSCR
20% down · 8.5% · 30yr
- Down + closing
- —
- Monthly P&I
- —
- Monthly cashflow
- —
- DSCR
- —
- Eligible?
- —
No personal income docs; deal must DSCR.
Hard money
10% down · 12.0% · 12mo
- Down + closing
- —
- Monthly P&I
- —
- Monthly cashflow
- —
- DSCR
- —
- Eligible?
- —
Short-term bridge; refi at stabilization.
Listing history 21 events
-
2026-06-22days on market $209,000 Active 119 DOM
-
2026-06-19days on market $209,000 Active 117 DOM
-
2026-06-18days on market $209,000 Active 116 DOM
-
2026-06-17days on market $209,000 Active 115 DOM
-
2026-06-16days on market $209,000 Active 114 DOM
-
2026-06-15days on market $209,000 Active 113 DOM
-
2026-06-14days on market $209,000 Active 111 DOM
-
2026-06-13days on market $209,000 Active 110 DOM
-
2026-06-10days on market $209,000 Active 108 DOM
-
2026-06-09days on market $209,000 Active 107 DOM
-
2026-06-08days on market $209,000 Active 106 DOM
-
2026-06-07days on market $209,000 Active 105 DOM
-
2026-06-05days on market $209,000 Active 102 DOM
-
2026-06-03days on market $209,000 Active 101 DOM
-
2026-06-02days on market $209,000 Active 100 DOM
-
2026-06-01days on market $209,000 Active 99 DOM
-
2026-05-31days on market $209,000 Active 98 DOM
-
2026-05-30days on market $209,000 Active 97 DOM
-
2026-03-05price $209,000 654-char remark
Show marketing remark (654 chars)
This generously sized 3-bedroom, 2-bath home situated on a double city lot in the heart of Hawley, Texas. Offering approximately 1,770 square feet, this property features two separate living areas, providing flexible space for entertaining, relaxing, or working from home. The kitchen and dining area flow naturally into the family room, while original hardwood floors add character throughout much of the home. The converted garage serves as a versatile shop or workspace. Located 20 minutes from the OpenAI Data Center in Abilene and 40 minutes from the two Google data centers in Haskell, this property presents strong potential as a workforce rental.
-
2026-02-22$239,000 Active 654-char remark
Show marketing remark (654 chars)
This generously sized 3-bedroom, 2-bath home situated on a double city lot in the heart of Hawley, Texas. Offering approximately 1,770 square feet, this property features two separate living areas, providing flexible space for entertaining, relaxing, or working from home. The kitchen and dining area flow naturally into the family room, while original hardwood floors add character throughout much of the home. The converted garage serves as a versatile shop or workspace. Located 20 minutes from the OpenAI Data Center in Abilene and 40 minutes from the two Google data centers in Haskell, this property presents strong potential as a workforce rental.
-
1992-01-29soldstatus
ⓘ Source: listings_history table (triggers on properties + properties_extension) + one-shot
backfill from property_details.listing_events for pre-trigger history.
Tax reassessment forecast TX · Resets to sale price
- Current annual tax
- $2,587 · $216/mo
- Projected year-2 tax
- $3,825 · $319/mo
- Expected delta
- +$1,238/yr (+$103/mo · 47.8%)
ⓘ Screening estimate from a state-policy table — verify with the county assessor before closing.
Climate risk First Street
- Flood 3/10 Moderate FEMA zone X (unshaded) · 20% chance over 30 yrs
- Wildfire 8/10 Severe
- Heat 7/10 Severe 7 d/yr ≥105°F today · 21 d/yr by 30 yrs out
- Wind 4/10 Moderate 10% chance of damaging wind over 30 yrs
- Air quality 1/10 Low 0 unhealthy d/yr today · 0 by 30 yrs out
Nearby sold comps map
Loading sold comps map…
Walkable amenities ~0.75 mi
Loading nearby amenities…
Taxation est. · year 1
- Rental income
- $16,295
- − Mortgage interest
- −$11,707
- − Property taxes
- −$2,587
- − Insurance
- −$1,045
- − Repairs & maintenance
- −$1,304
- − Management
- −$1,304
- − Depreciation
- −$6,080
- Taxable loss
- −$7,731
- Est. tax savings @ 24.0%
- +$1,855
- After-tax cash flow
- $-2,055/yr
For passive investors: Depreciation is non-cash, so a rental often shows a tax loss while cash-flowing — sheltering income. Rental losses are passive: they offset passive income freely, and up to $25,000/yr can offset ordinary (W-2) income if you actively participate and your MAGI is under $100k (phasing out to $0 by $150k); unused losses carry forward. On sale, claimed depreciation is recaptured at up to 25%, and gains may owe capital-gains tax (a 1031 exchange can defer both). Figures are a year-1 estimate at your 24.0% rate — not tax advice; consult a CPA.
Schools (NCES district)
- District
- Hawley ISD
- NCES district ID
- 4822800
- Math proficiency
- 27% ▼ -10.00%
- Reading proficiency
- 31% ▼ -9.00%
- Median HH income
- $46,851
- Composite
- 25.06/100
- National rank
- #7542
- State rank
- #642 of 826 in TX
Livability — Hawley
- Score
- 68/100
- State rank
- #459
- US rank
- #9278
Category grades
Schools grade is shown separately in the Schools card above.
Census & demographics
- Census place
- Hawley, TX
- Population (ZIP)
- 2,926
Population outlook (Jones County) Hauer SSP2
- Today (2025)
- 19,845 people
- By 2030
- 20,213 · +1.9%
- By 2040
- 21,446 · +8.1%
- By 2050
- 22,499 · +13.4%
- By 2075
- 23,272 · +17.3%
- By 2100
- 20,420 · +2.9%
Race, ethnicity, and origin ACS 2023
- Neighborhood character
- Predominantly White (81%)
- Race & ethnicity
- White 81% Two or more races 13% Hispanic / Latino 13%
- Hispanic origin (detail)
- Mexican 13%
- Common ancestry
- Slovak 4% Serbian 4% Italian 1%
- Foreign-born
- 1% · Canada
- Languages at home
- 91% English-only · Spanish 9%
Political lean MEDSL · Jones
- 2024 margin
- Solid R (+73.2) · D 13.1% · R 86.2%
- 2008→2024 swing
- -27.1pp toward R · 2008: -46.1pp · 2024: -73.2pp
- All cycles
- 2024: R+73.2 2020: R+69.1 2016: R+65.4 2012: R+54.5 2008: R+46.1
Not yet ingested
- Civics
- —
Market trends
- HPI YoY
- ▲ 5.95%
- Current HPI
- 207.7392
- Rent YoY
- —
- Metro
- —
- State GDP YoY
- ▲ 3.95%
- F500 in state
- 110
Industry mix (Fortune 500 HQ in TX)
| Industry | F500 HQs | Revenue |
|---|---|---|
| Energy | 16 | $1,198B |
|
||
| Technology | 5 | $198B |
|
||
| Engineering / Construction | 4 | $72B |
|
||
| Energy Services | 3 | $60B |
|
||
| Utilities | 3 | $41B |
|
||
| Healthcare | 2 | $330B |
|
||
Price history
-12.6% since first listed3 events — show timeline
- 2026-03-05 Price Changed $209,000 NTREIS
- 2026-02-22 Listed $239,000 NTREIS
- 1992-01-29 Sold (Public Records) — Public Records
Property tax history
+1.1%/yrLatest (2025): $2,587 · +0.4% YoY. Source: county tax records.
Cash-flow waterfall
monthlySold comps — $/sqft
last 12 mo · ≤1 miLoading sold comps…