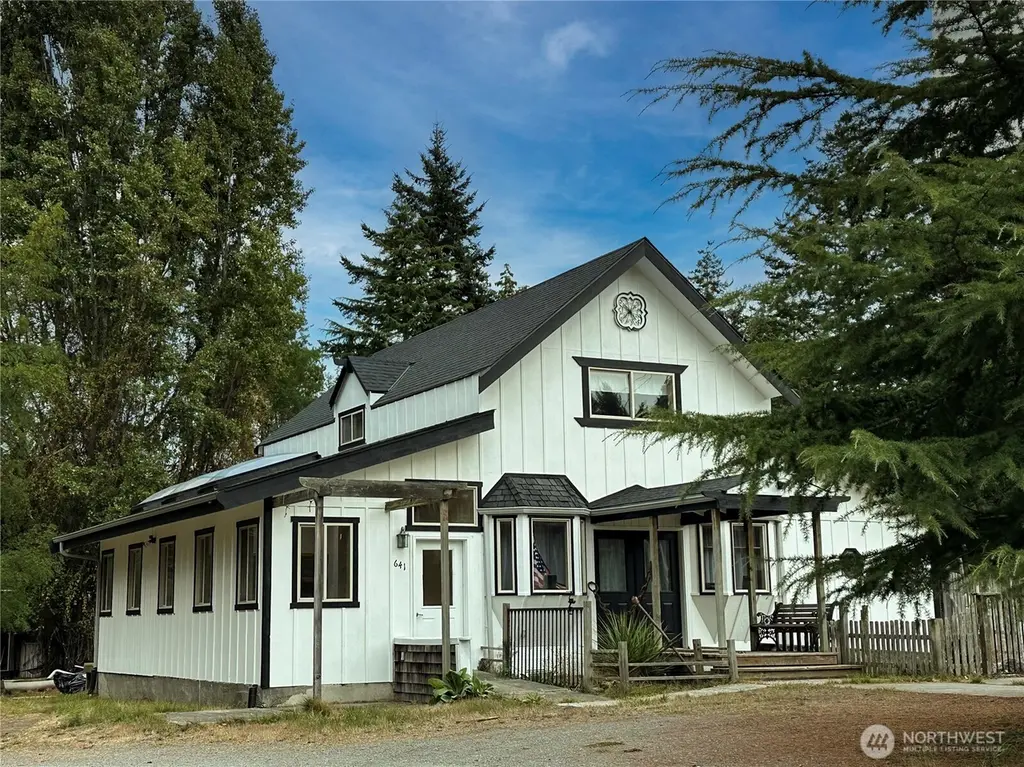
641 Decatur Head Dr · Anacortes, WA
Flood risk 1/10 · Minimal
- FEMA flood zone
- X
- Chance of flooding over 30 yrs
- 0.0%
- Est. flood insurance / yr
- $435 – $905
Fire risk 1/10 · Minimal
- Est. fire insurance / yr
- $604 – $1,122
Heat risk 1/10 · Minimal
- Hot days now (above threshold)
- 7 days/yr
- Hot days in 30 yrs
- 21 days/yr
Wind risk No data
- Chance of severe wind over 30 yrs
- —
Air-quality risk 5/10 · Moderate
- Unhealthy air days now
- 7 days/yr
- Unhealthy air days in 30 yrs
- 7 days/yr
Risk factors via First Street. Map © Google.
Why this score? — see what drove the F grade
The composite is a weighted blend of 9 inputs, each scored 0–100. Each bar is that input's sub-score; the figure is the points it added to the 100-point composite (weight × sub-score).
- ARV discount +7.5/15.0
- Cash flow +6.1/30.0
- Schools +4.1/10.0
- Livability +4.0/5.0
- Rent growth +3.3/5.0
- Condition / age +2.5/5.0
- DSCR +0.4/10.0
- 1% rule +0.2/10.0
- Appreciation +0.0/10.0
$499,999
🖨 Deal sheet (PDF) 📄 Offer letter ✓ Due diligence
Listing remarks
Large Farmhouse. Includes spacious 2nd story studio apt w Airbnb VR permit. Charming 1 bed cabin also sits quietly in the back. Private island in the San Juan islands 20 min from Anacortes. Use as an equestrian farm, full time residence or vacation home. Several outbuildings including a barn, bunkhouse and greenhouse. Centrally located. Short walk to the K-8th grade school. 1/2 mile walk to the beach. Live, work remotely on this large 2.64 acre lot. Partly wooded. Fiber for internet. Daily water taxi from Anacortes. 90 min drive from Seattle.
Key facts
- 2nd story studio apt
- 1 bed cabin
- Airbnb vr permit
Tags
Neighborhood map
What this means for you Summary
Snapshot
- This is a 3-bed/3.0-bath other listed at $500k.
Deal economics
- At list price, monthly cash flow is $-936 ($-11k/yr) — negative.
- To cash-flow at today's rent, offer at most $335k (33.1% below list).
- To meet the 1% rule (rent ≥ 1% of price), the offer needs to be $262k (47.6% below list).
- Recommended offer: $262k (47.6% below list) — sets the bar for 1% rule.
- Cap rate 4.0% vs local median 1.6% in Anacortes — top-decile yield for the area; either an underpriced asset or a hidden risk that comps aren't pricing in. Stress-test before assuming the spread holds.
Location & tenants
- Location reads 80/100 on livability (#85 in WA, #1,627 nationally) — a professional / high-income tenant draw. Strengths: commute A+, employment A+, health & safety A+; Watch: amenities F, cost of living F.
- Lopez School District (rural): math 40% / reading 50% proficiency, ranked #180 of 291 in WA (top 62%) — families likely to look elsewhere, expect single-tenant / working-renter base with shorter leases.
- Zoned schools: Decatur Elementary (3 students, 0% FRL); Lopez Middle High School (134 students, 69% FRL) — zoned schools at 34% FRL track the district average.
- Market conditions: Rents rising (+3.3%/yr); 282 active listings in the ZIP; solid renter incomes; 99 units permitted in San Juan County in 2024 (0 in 5+ unit buildings).
- This rent runs 33% of the median local income ($97k/yr) — at the standard rent-burdened threshold; future hikes will face affordability resistance.
Forward outlook
- Local home prices are declining (-3.0%/yr); year-one equity from $3k of loan paydown is wiped out by about $15k of value loss. Plan a longer hold.
- San Juan County population projected at +6% by 2050 — modest demand growth; plan on rents tracking national, not racing it.
Negotiation context
- It's been on market 111 days — a 9% lower offer ($455k) is reasonable based on typical stale-listing flexibility.
- 5 sale attempts since 11y ago with the ask held roughly flat each time — persistent listings suggest the price (not the market) is what's stuck; bring a comps-based counter.
Questions for the listing agent
- What do current leases actually rent for vs. the listed asking? Can we see a recent rent roll and the last 12 months of T-12 income?
- It's been on market 111 days. Have you received any prior offers? Is the seller open to a 48% concession, seller financing, or rate buy-down credit?
- Why hasn't it sold? Are there any deal-killer items the seller is aware of (foundation, flood, title, zoning, code violations)?
- Is there a deadline driving the sale (1031 exchange, divorce, estate, relocation)? That informs how much negotiation room exists.
- Schools are A-rated — typically a magnet for longer-tenancy family renters. What's the average tenant stay here, and is there a school-zone premium baked into asking?
- The area grade is low — what's the realistic commute time and amenity access for the typical tenant pool here? Any planned neighborhood developments (good or bad) we should know about?
- What's the average days-on-market for RENTAL listings here right now (not sales)? A rising rental-DOM trend means longer vacancies and softer asking-rent achievability than the comps imply.
- What's the recent tenant-quality profile in this submarket — average credit score on applications, eviction rate, late-payment / NSF rate, and stable-employment percentage? A property-management company in the area should have these aggregated.
- How much new for-sale + rental construction is in the pipeline within 1–3 miles? Heavy new supply typically softens prices + rents 12–24 months out; constrained supply supports both.
Investment metrics
- 1% rule
- 0.52% ✗
- Cap rate
- 4.05%
- Cash-on-cash
- -8.02%
- DSCR
- 0.64
- GRM
- 15.9
CMA / ARV
- ARV (median comp)
- $1,474,429
- List price
- $499,999
- Delta
- -66.09%
- Verdict
- UNDERPRICED
- Comps
- 2 within 2.0 mi
Projected returns pro-forma
-3.0% appreciation · 3.26% rent growth · sell at horizon
- IRR
- -30.2%
- Equity multiple
- -0.00×
- Total profit
- $-140,192
- Equity at exit
- $74,551
- IRR
- -31.4%
- Equity multiple
- -0.41×
- Total profit
- $-196,981
- Equity at exit
- $43,231
Cash invested: $140,000 (down + closing). Projections, not guarantees.
Landlord ↔ Tenant lean methodology
- Overall (STATE)
- 28 Tenant-Leaning
- State Washington
- 28 Tenant-Leaning · D+8
- County
- — inherits STATE
- City
- — inherits STATE
ZIP-level market 98221
- Rents YoY
- 3.3%
- Active inventory
- 282
- Price-to-rent
- 15.9×
Monthly cashflow live
- Estimated rent
- $2,618 medium interval (Pro) →
- Mortgage (P&I)
- −$2,622
- Tax from tax record
- −$174 /mo · $2,083/yr
- Insurance
- −$208
- HOA
- −$0
- Vacancy / Maint / Mgmt
- −$550
- Net cashflow
- $-936
Break-even live
Sensitivity live
| Price | -10% $-653 | -5% $-795 | +0% $-936 | +5% $-1,078 | +10% $-1,219 |
|---|---|---|---|---|---|
| Rent | -10% $-1,143 | -5% $-1,039 | +0% $-936 | +5% $-833 | +10% $-729 |
| Rate | -1.0pp $-684 | -0.5pp $-809 | base $-936 | +0.5pp $-1,066 | +1.0pp $-1,197 |
UW: 25.0% down · 7.5% · 30yr · 1.5% tax · 5.0% vac · 8.0% maint · 8.0% mgmt
Financing live
Cash to close
- Down payment
- $125,000
- Closing costs
- $15,000
- Reserves months
- —
- Total cash needed
- —
Loan-product check · same deal, 3 products live
Conventional
25% down · 7.5% · 30yr
- Down + closing
- —
- Monthly P&I
- —
- Monthly cashflow
- —
- DSCR
- —
- Eligible?
- —
Personal DTI + credit; lowest rate.
DSCR
20% down · 8.5% · 30yr
- Down + closing
- —
- Monthly P&I
- —
- Monthly cashflow
- —
- DSCR
- —
- Eligible?
- —
No personal income docs; deal must DSCR.
Hard money
10% down · 12.0% · 12mo
- Down + closing
- —
- Monthly P&I
- —
- Monthly cashflow
- —
- DSCR
- —
- Eligible?
- —
Short-term bridge; refi at stabilization.
Listing history 31 events
-
2026-06-21days on market $499,999 Active 111 DOM
-
2026-06-19days on market $499,999 Active 109 DOM
-
2026-06-18days on market $499,999 Active 108 DOM
-
2026-06-17days on market $499,999 Active 107 DOM
-
2026-06-16days on market $499,999 Active 106 DOM
-
2026-06-15days on market $499,999 Active 105 DOM
-
2026-06-14days on market $499,999 Active 103 DOM
-
2026-06-13days on market $499,999 Active 102 DOM
-
2026-06-10days on market $499,999 Active 100 DOM
-
2026-06-09days on market $499,999 Active 99 DOM
-
2026-06-08days on market $499,999 Active 98 DOM
-
2026-06-07days on market $499,999 Active 97 DOM
-
2026-06-05days on market $499,999 Active 94 DOM
-
2026-06-02days on market $499,999 Active 92 DOM
-
2026-06-01days on market $499,999 Active 91 DOM
-
2026-05-31days on market $499,999 Active 90 DOM
-
2026-05-30days on market $499,999 Active 89 DOM
-
2026-05-14price $499,999
-
2026-03-02$525,000 Active
-
2023-06-07soldstatus $550,000 Closed
-
2023-04-08status Pending
-
2023-03-16status Active
-
2023-03-16historical
-
2022-07-23price $589,000
-
2021-09-24$629,000 Active
-
2017-01-13soldstatus $145,000
-
2017-01-03status Pending
-
2017-01-02historical Cancelled
-
2016-05-27status Active
-
2016-05-13status Pending Feasibility
-
2015-04-02Active
ⓘ Source: listings_history table (triggers on properties + properties_extension) + one-shot
backfill from property_details.listing_events for pre-trigger history.
Tax reassessment forecast WA · Resets to sale price
- Current annual tax
- $2,083 · $174/mo
- Projected year-2 tax
- $4,900 · $408/mo
- Expected delta
- +$2,817/yr (+$235/mo · 135.2%)
ⓘ Screening estimate from a state-policy table — verify with the county assessor before closing.
Climate risk First Street
- Flood 1/10 Low FEMA zone X · 0% chance over 30 yrs
- Wildfire 1/10 Low
- Heat 1/10 Low
- Air quality 5/10 Major 7 unhealthy d/yr today · 7 by 30 yrs out
Nearby sold comps map
Loading sold comps map…
Walkable amenities ~0.75 mi
Loading nearby amenities…
Taxation est. · year 1
- Rental income
- $31,411
- − Mortgage interest
- −$28,008
- − Property taxes
- −$2,083
- − Insurance
- −$2,500
- − Repairs & maintenance
- −$2,513
- − Management
- −$2,513
- − Depreciation
- −$14,545
- Taxable loss
- −$20,751
- Est. tax savings @ 24.0%
- +$4,980
- After-tax cash flow
- $-6,253/yr
For passive investors: Depreciation is non-cash, so a rental often shows a tax loss while cash-flowing — sheltering income. Rental losses are passive: they offset passive income freely, and up to $25,000/yr can offset ordinary (W-2) income if you actively participate and your MAGI is under $100k (phasing out to $0 by $150k); unused losses carry forward. On sale, claimed depreciation is recaptured at up to 25%, and gains may owe capital-gains tax (a 1031 exchange can defer both). Figures are a year-1 estimate at your 24.0% rate — not tax advice; consult a CPA.
Schools (NCES district)
- District
- Lopez School District
- NCES district ID
- 5304530
- Math proficiency
- 40% ▼ -5.00%
- Reading proficiency
- 50% ▼ -5.00%
- Median HH income
- $50,349
- Composite
- 40.87/100
- National rank
- #7535
- State rank
- #180 of 291 in WA
Livability — Anacortes
- Score
- 80/100
- State rank
- #85
- US rank
- #1627
Category grades
Schools grade is shown separately in the Schools card above.
Census & demographics
- County
- Skagit County · 118,108 people
- City population
- 23,562
- Metro
- Mount Vernon-Anacortes, WA
- Population (ZIP)
- 23,562
- Household income
- $96,528
- Rent vs Own
- Severe rent burden
- 611.0
Population outlook (San Juan County) Hauer SSP2
- Today (2025)
- 17,439 people
- By 2030
- 17,871 · +2.5%
- By 2040
- 18,236 · +4.6%
- By 2050
- 18,468 · +5.9%
- By 2075
- 19,749 · +13.2%
- By 2100
- 20,348 · +16.7%
Race, ethnicity, and origin ACS 2023
- Neighborhood character
- Predominantly White (87%)
- Race & ethnicity
- White 87% Two or more races 7% Hispanic / Latino 5% Asian 2%
- Common ancestry
- Portuguese 7% Slovak 4% Italian 3%
- Foreign-born
- 6% · Canada, China
- Languages at home
- 95% English-only · Spanish 2% German/W. Germanic 1%
Political lean MEDSL · San Juan
- 2024 margin
- Solid D (+51.4) · D 73.7% · R 22.3% · Other 3.9%
- 2008→2024 swing
- +9.5pp toward D · 2008: 41.9pp · 2024: 51.4pp
- All cycles
- 2024: D+51.4 2020: D+50.5 2016: D+41.6 2012: D+37.5 2008: D+41.9
Not yet ingested
- Civics
- —
Market trends
- HPI YoY
- ▼ -632.48%
- Current HPI
- 329.0796
- Rent YoY
- ▲ 3.26%
- Metro
- Mount Vernon-Anacortes, WA
- State GDP YoY
- ▲ 4.65%
- F500 in state
- 22
Industry mix (Fortune 500 HQ in WA)
| Industry | F500 HQs | Revenue |
|---|---|---|
| Retail | 2 | $269B |
|
||
| Technology / Retail | 1 | $638B |
|
||
| Technology | 1 | $245B |
|
||
| Telecommunications | 1 | $38B |
|
||
| Food / Beverage | 1 | $36B |
|
||
| Automotive / Trucks | 1 | $34B |
|
||
Price history
+244.8% since first listed14 events — show timeline
- 2026-05-14 Price Changed $499,999 NWMLS as Distributed by MLS Grid
- 2026-03-02 Listed $525,000 NWMLS as Distributed by MLS Grid
- 2023-06-07 Sold (MLS) $550,000 NWMLS as Distributed by MLS Grid
- 2023-04-08 Pending — NWMLS as Distributed by MLS Grid
- 2023-03-16 Relisted — NWMLS as Distributed by MLS Grid
- 2023-03-16 Delisted — NWMLS as Distributed by MLS Grid
- 2022-07-23 Price Changed $589,000 NWMLS as Distributed by MLS Grid
- 2021-09-24 Listed $629,000 NWMLS as Distributed by MLS Grid
- 2017-01-13 Sold (Public Records) $145,000 Public Records
- 2017-01-03 Pending — NWMLS as Distributed by MLS Grid
- 2017-01-02 Delisted — NWMLS as Distributed by MLS Grid
- 2016-05-27 Relisted — NWMLS as Distributed by MLS Grid
- 2016-05-13 Pending — NWMLS as Distributed by MLS Grid
- 2015-04-02 Listed — NWMLS as Distributed by MLS Grid
Property tax history
+2.2%/yrLatest (2026): $2,083 · -4.2% YoY. Source: county tax records.
Cash-flow waterfall
monthlySold comps — $/sqft
last 12 mo · ≤1 miLoading sold comps…