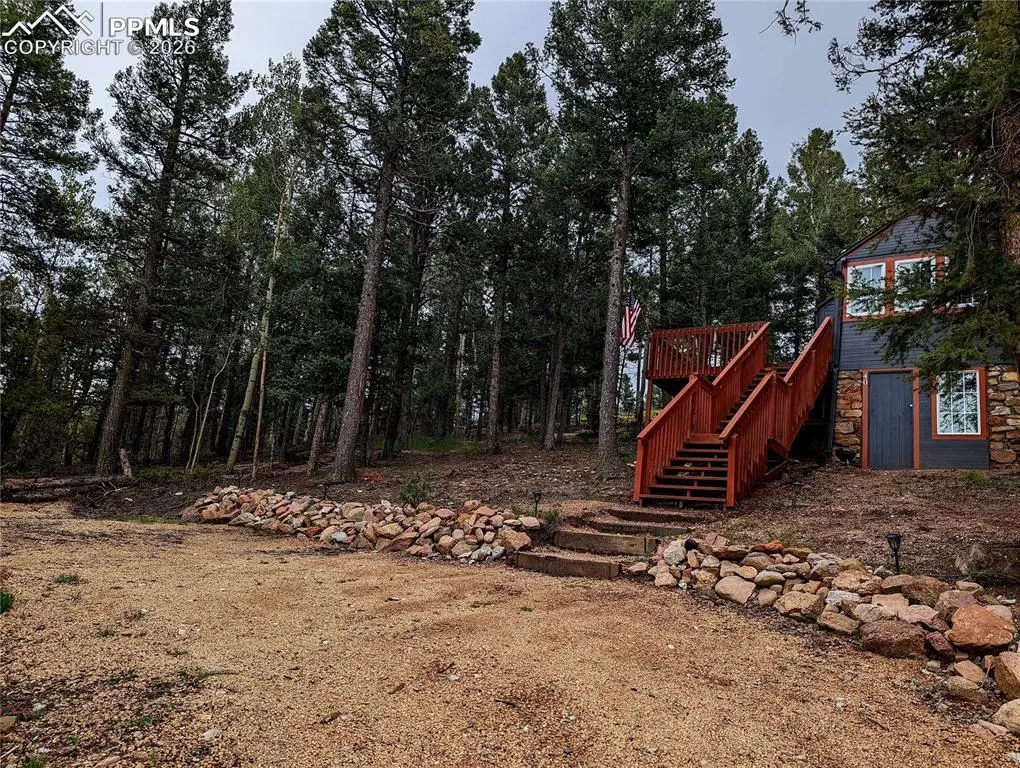
40 Flathead Ln · Green Mountain Falls, CO
Flood risk 1/10 · Minimal
- FEMA flood zone
- X (unshaded)
- Chance of flooding over 30 yrs
- 0.0%
- Est. flood insurance / yr
- $507 – $1,088
Fire risk 7/10 · Major
- Est. fire insurance / yr
- $939 – $1,743
Heat risk 1/10 · Minimal
- Hot days now (above 79°F)
- 2 days/yr
- Hot days in 30 yrs
- 4 days/yr
Wind risk 2/10 · Minimal
- Chance of severe wind over 30 yrs
- —
Air-quality risk 2/10 · Minimal
- Unhealthy air days now
- 1 days/yr
- Unhealthy air days in 30 yrs
- 1 days/yr
Risk factors via First Street. Map © Google.
Why this score? — see what drove the D grade
The composite is a weighted blend of 9 inputs, each scored 0–100. Each bar is that input's sub-score; the figure is the points it added to the 100-point composite (weight × sub-score).
- Cash flow +15.0/30.0
- ARV discount +7.5/15.0
- DSCR +4.6/10.0
- Rent growth +3.4/5.0
- Schools +3.4/10.0
- Livability +3.2/5.0
- 1% rule +2.8/10.0
- Condition / age +2.5/5.0
- Appreciation +0.0/10.0
$180,000
🖨 Deal sheet 📄 Offer letter ✓ Due diligence
Listing remarks
Please contact listing agent for showing. Ben Boyd 8167691304
Key facts
- 1 acre lot
- Built 1985
- Listed 49 days
Property features AI
Finance
- Other: 1 acre lot; Outbuilding of other type
- Financial info: Financing options may include cash, owner carry, or USDA
- HOA & community: No HOA; No association fee
Exterior
- Parking: Gravel driveway
- Utilities: Cistern water; Generator
- Home design: Single-family home; Existing home
- Construction: Wood frame construction; Wood siding; Composite shingle roof; Crawl space foundation
- Exterior features: Wood deck patio; Mountain view; Hiking trail access
Interior
- Kitchen: Range oven (gas/electric)
- Bedrooms: Main floor bedroom
- Flooring: Tile; Wood laminate
- Bathrooms: One three-quarter bathroom
- Heating & cooling: Active solar heating; Propane heating; No air conditioning
- Interior features: Tile and wood laminate floors; Wood laminate entry; Stove fireplace; Active solar heating and propane backup; No cooling
Neighborhood map
What this means for you Summary
Snapshot
- This is a 1-bed/1.0-bath single-family listed at $180k.
Deal economics
- At list price, monthly cash flow is $55 ($656/yr) — positive.
- The deal already cash-flows at list — no discount required.
- To meet the 1% rule (rent ≥ 1% of price), the offer needs to be $140k (22.4% below list).
- Recommended offer: $140k (22.4% below list) — sets the bar for 1% rule.
Location & tenants
- Location reads 63/100 on livability (#181 in CO) — a middle-class / working-renter tenant base. Strengths: crime A+, housing A+, employment B+; Watch: schools C-, cost of living C-, amenities F.
- Woodland Park School District No. Re-2 (town): math 28% / reading 47% proficiency, ranked #29 of 86 in CO (top 34%) — families likely to look elsewhere, expect single-tenant / working-renter base with shorter leases.
- Market conditions: Rents rising (+3.6%/yr); 245 active listings in the ZIP; solid renter incomes; 148 units permitted in Teller County in 2024 (0 in 5+ unit buildings).
- This rent is only 16% of the median local income ($105k/yr) — well below the 30% rent-burden line; pricing power to push rent on renewal without tenant pushback.
Forward outlook
- Local home prices are declining (-3.0%/yr); year-one equity from $1k of loan paydown is wiped out by about $5k of value loss. Plan a longer hold.
- Teller County population projected at -22% by 2050 — secular population decline; favor cash flow + early exit over multi-decade hold.
Negotiation context
- It's been on market 49 days — a 3% lower offer ($175k) is reasonable based on typical stale-listing flexibility.
- Current owner paid $10k; list at $180k implies a 1700% gain — meaningful room to come down on a strong offer.
Risks & watch-outs
- Climate carrying-cost: major wildfire risk — expect insurance premiums to compound above CPI over the hold.
Questions for the listing agent
- It's been on market 49 days. Have you received any prior offers? Is the seller open to a 22% concession, seller financing, or rate buy-down credit?
- Is there a deadline driving the sale (1031 exchange, divorce, estate, relocation)? That informs how much negotiation room exists.
- The area grade is low — what's the realistic commute time and amenity access for the typical tenant pool here? Any planned neighborhood developments (good or bad) we should know about?
- What's the average days-on-market for RENTAL listings here right now (not sales)? A rising rental-DOM trend means longer vacancies and softer asking-rent achievability than the comps imply.
- What's the recent tenant-quality profile in this submarket — average credit score on applications, eviction rate, late-payment / NSF rate, and stable-employment percentage? A property-management company in the area should have these aggregated.
- How much new for-sale + rental construction is in the pipeline within 1–3 miles? Heavy new supply typically softens prices + rents 12–24 months out; constrained supply supports both.
Investment metrics
- 1% rule
- 0.78% ✗
- Cap rate
- 6.66%
- Cash-on-cash
- 1.30%
- DSCR
- 1.06
- GRM
- 10.7
CMA / ARV
No comps found within radius.
Projected returns pro-forma
-3.0% appreciation · 3.64% rent growth · sell at horizon
- IRR
- -13.7%
- Equity multiple
- 0.51×
- Total profit
- $-24,880
- Equity at exit
- $26,839
- IRR
- -4.1%
- Equity multiple
- 0.73×
- Total profit
- $-13,820
- Equity at exit
- $15,563
Cash invested: $50,400 (down + closing). Projections, not guarantees.
Landlord ↔ Tenant lean methodology
- Overall (STATE)
- 38 Tenant-Leaning
- State Colorado
- 38 Tenant-Leaning · D+4
- County
- — inherits STATE
- City
- — inherits STATE
ZIP-level market 80863
- Home prices YoY
- -29.8%
- Rents YoY
- 3.6%
- Active inventory
- 245
- Price-to-rent
- 10.7×
Monthly cashflow live
- Estimated rent
- $1,397 medium interval (Pro) →
- Mortgage (P&I)
- −$944
- Tax from tax record
- −$30 /mo · $361/yr
- Insurance
- −$75
- HOA
- −$0
- Vacancy / Maint / Mgmt
- −$293
- Net cashflow
- $55
Break-even live
UW: 25.0% down · 7.5% · 30yr · 1.5% tax · 5.0% vac · 8.0% maint · 8.0% mgmt
Financing live
Cash to close
- Down payment
- $45,000
- Closing costs
- $5,400
- Reserves months
- —
- Total cash needed
- —
Loan-product check · same deal, 3 products live
Conventional
25% down · 7.5% · 30yr
- Down + closing
- —
- Monthly P&I
- —
- Monthly cashflow
- —
- DSCR
- —
- Eligible?
- —
Personal DTI + credit; lowest rate.
DSCR
20% down · 8.5% · 30yr
- Down + closing
- —
- Monthly P&I
- —
- Monthly cashflow
- —
- DSCR
- —
- Eligible?
- —
No personal income docs; deal must DSCR.
Hard money
10% down · 12.0% · 12mo
- Down + closing
- —
- Monthly P&I
- —
- Monthly cashflow
- —
- DSCR
- —
- Eligible?
- —
Short-term bridge; refi at stabilization.
Listing history 20 events
-
2026-06-18days on market $180,000 Active 49 DOM
-
2026-06-17days on market $180,000 Active 48 DOM
-
2026-06-16days on market $180,000 Active 47 DOM
-
2026-06-15days on market $180,000 Active 46 DOM
-
2026-06-14days on market $180,000 Active 44 DOM
-
2026-06-13days on market $180,000 Active 43 DOM
-
2026-06-10days on market $180,000 Active 41 DOM
-
2026-06-09days on market $180,000 Active 40 DOM
-
2026-06-08days on market $180,000 Active 39 DOM
-
2026-06-07days on market $180,000 Active 38 DOM
-
2026-06-03days on market $180,000 Active 34 DOM
-
2026-06-03days on market $180,000 Active 33 DOM
-
2026-06-01days on market $180,000 Active 32 DOM
-
2026-05-31days on market $180,000 Active 31 DOM
-
2026-04-30$180,000 Active
-
2025-09-24price $200,000
-
2025-08-27price $210,000
-
2025-08-19price $215,000
-
2025-07-31price $240,000
-
1994-10-21soldstatus $10,000
ⓘ Source: listings_history table (triggers on properties + properties_extension) + one-shot
backfill from property_details.listing_events for pre-trigger history.
Tax reassessment forecast CO · Resets to sale price
- Current annual tax
- $361 · $30/mo
- Projected year-2 tax
- $990 · $82/mo
- Expected delta
- +$629/yr (+$52/mo · 174.1%)
ⓘ Screening estimate from a state-policy table — verify with the county assessor before closing.
Climate risk First Street
- Flood 1/10 Low FEMA zone X (unshaded) · 0% chance over 30 yrs
- Wildfire 7/10 Severe
- Heat 1/10 Low 2 d/yr ≥79°F today · 4 d/yr by 30 yrs out
- Wind 2/10 Low
- Air quality 2/10 Low 1 unhealthy d/yr today · 1 by 30 yrs out
Nearby sold comps map
Loading sold comps map…
Walkable amenities ~0.75 mi
Loading nearby amenities…
Taxation est. · year 1
- Rental income
- $16,765
- − Mortgage interest
- −$10,083
- − Property taxes
- −$361
- − Insurance
- −$900
- − Repairs & maintenance
- −$1,341
- − Management
- −$1,341
- − Depreciation
- −$5,236
- Taxable loss
- −$2,498
- Est. tax savings @ 24.0%
- +$599
- After-tax cash flow
- $1,255/yr
For passive investors: Depreciation is non-cash, so a rental often shows a tax loss while cash-flowing — sheltering income. Rental losses are passive: they offset passive income freely, and up to $25,000/yr can offset ordinary (W-2) income if you actively participate and your MAGI is under $100k (phasing out to $0 by $150k); unused losses carry forward. On sale, claimed depreciation is recaptured at up to 25%, and gains may owe capital-gains tax (a 1031 exchange can defer both). Figures are a year-1 estimate at your 24.0% rate — not tax advice; consult a CPA.
Schools (NCES district)
- District
- Woodland Park School District No. Re-2
- NCES district ID
- 0807380
- Math proficiency
- 28% ▼ -3.00%
- Reading proficiency
- 47% ▼ -2.00%
- Median HH income
- $63,920
- Composite
- 33.68/100
- National rank
- #5385
- State rank
- #29 of 86 in CO
Livability — Green Mountain Falls
- Score
- 63/100
- State rank
- #181
- US rank
- #14786
Category grades
Schools grade is shown separately in the Schools card above.
Census & demographics
- County
- Teller County · 12,329 people
- Metro
- Colorado Springs, CO
- Population (ZIP)
- 12,329
- Household income
- $104,779
- Rent vs Own
- Severe rent burden
- 418.0
Population outlook (Teller County) Hauer SSP2
- Today (2025)
- 22,404 people
- By 2030
- 21,527 · -3.9%
- By 2040
- 19,356 · -13.6%
- By 2050
- 17,462 · -22.1%
- By 2075
- 14,658 · -34.6%
- By 2100
- 11,982 · -46.5%
Race, ethnicity, and origin ACS 2023
- Neighborhood character
- Predominantly White (85%)
- Race & ethnicity
- White 85% Two or more races 10% Hispanic / Latino 5% Black 1%
- Hispanic origin (detail)
- Mexican 3%
- Common ancestry
- Slovak 4% Lithuanian 3% Italian 3%
- Foreign-born
- 3% · South Korea
- Languages at home
- 97% English-only · Spanish 1% German/W. Germanic 1% Russian/Polish/Slavic 1%
Political lean MEDSL · Teller
- 2024 margin
- Solid R (+35.5) · D 31.0% · R 66.5% · Other 2.5%
- 2008→2024 swing
- -7.3pp toward R · 2008: -28.1pp · 2024: -35.5pp
- All cycles
- 2024: R+35.5 2020: R+35.2 2016: R+42.5 2012: R+33.1 2008: R+28.1
Not yet ingested
- Civics
- —
Market trends
- HPI YoY
- ▼ -129.47%
- Current HPI
- 304.4625
- Rent YoY
- ▲ 3.64%
- Metro
- Colorado Springs, CO
- State GDP YoY
- ▲ 1.95%
- F500 in state
- 14
Industry mix (Fortune 500 HQ in CO)
| Industry | F500 HQs | Revenue |
|---|---|---|
| Technology Distribution | 1 | $31B |
|
||
| Food / Agriculture | 1 | $18B |
|
||
| Packaging | 1 | $14B |
|
||
| Healthcare | 1 | $13B |
|
||
| Energy | 1 | $10B |
|
||
| Technology | 1 | $4B |
|
||
Price history
+1700.0% since first listed6 events — show timeline
- 2026-04-30 Listed $180,000 elevateMLS
- 2025-09-24 Price Changed $200,000 elevateMLS
- 2025-08-27 Price Changed $210,000 elevateMLS
- 2025-08-19 Price Changed $215,000 elevateMLS
- 2025-07-31 Price Changed $240,000 elevateMLS
- 1994-10-21 Sold (Public Records) $10,000 Public Records
Property tax history
+7.3%/yrLatest (2020): $361 · +1.7% YoY. Source: county tax records.
Cash-flow waterfall
monthlySold comps — $/sqft
last 12 mo · ≤1 miLoading sold comps…