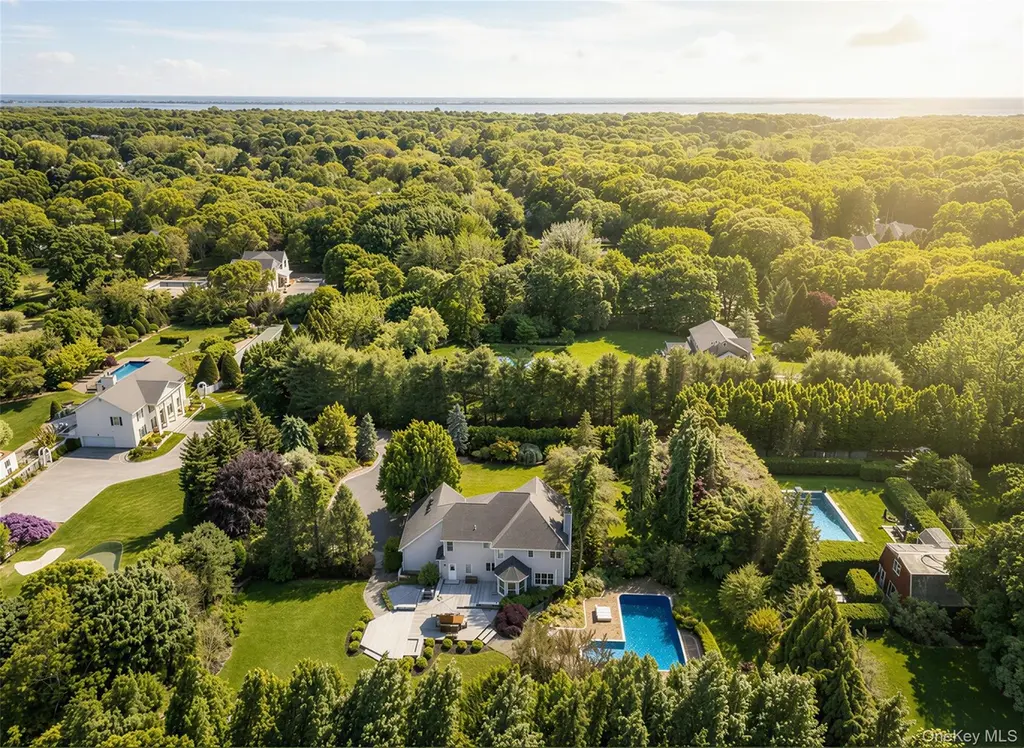
None · Remsenburg-Speonk, NY
Flood risk 1/10 · Minimal
- FEMA flood zone
- X (unshaded)
- Chance of flooding over 30 yrs
- 0.0%
- Est. flood insurance / yr
- $473 – $860
Fire risk 2/10 · Minimal
- Est. fire insurance / yr
- $691 – $1,283
Heat risk 4/10 · Minor
- Hot days now (above 91°F)
- 7 days/yr
- Hot days in 30 yrs
- 18 days/yr
Wind risk 8/10 · Major
- Chance of severe wind over 30 yrs
- 80.0%
Air-quality risk 4/10 · Minor
- Unhealthy air days now
- 4 days/yr
- Unhealthy air days in 30 yrs
- 5 days/yr
Risk factors via First Street. Map © Google.
Why this score? — see what drove the D grade
The composite is a weighted blend of 9 inputs, each scored 0–100. Each bar is that input's sub-score; the figure is the points it added to the 100-point composite (weight × sub-score).
- Appreciation +8.9/10.0
- Cash flow +8.1/30.0
- ARV discount +7.5/15.0
- Schools +4.8/10.0
- 1% rule +2.5/10.0
- Rent growth +2.5/5.0
- Livability +2.5/5.0
- Condition / age +2.5/5.0
- DSCR +2.1/10.0
$2,649,000
🖨 Deal sheet (PDF) 📄 Offer letter ✓ Due diligence
Listing remarks
Searching for the perfect Hamptons retreat? Your search may end here. Tucked away in the coveted hamlet of Remsenburg, this private sanctuary embodies the effortless elegance for which the Hamptons are renowned. Discreetly positioned beyond a long shared drive, the residence offers a rare sense of seclusion, thoughtfully designed for both refined living and relaxed coastal entertaining. Surrounded by lush landscaping, the outdoor experience rivals that of a boutique resort, with a sparkling pool and expansive terraces inviting long summer afternoons and elegant evenings under the stars. Inside, beautifully renovated baths, gracious bedroom suites, and a fully finished lower level featuring
Key facts
- Private sanctuary
- Renovated baths
- Expansive terraces
Tags
Property features AI
Exterior
- Parking: Garage; 2-car garage
- Utilities: Septic tank; Utilities: See remarks
- Home design: Single family residence
- Construction: Other construction materials; Other foundation details
- Exterior features: Private in-ground salt water pool; No waterfront
Interior
- Kitchen: Stainless steel appliances
- Bathrooms: 3 full bathrooms
- Heating & cooling: Central air conditioning; Oil heating
- Interior features: First floor full bath; Built-in features; ENERGY STAR qualified doors; High ceilings; Open floor plan; Walk-in closets; Finished basement; Unfinished attic; Total of 9 rooms
Neighborhood map
What this means for you Summary
Snapshot
- This is a 4-bed/2.5-bath single-family listed at $2.65M.
Deal economics
- At list price, monthly cash flow is $-3k ($-32k/yr) — negative.
- To cash-flow at today's rent, offer at most $2.27M (14.4% below list).
- To meet the 1% rule (rent ≥ 1% of price), the offer needs to be $1.98M (25.1% below list).
- Recommended offer: $1.98M (25.1% below list) — sets the bar for 1% rule.
- Cap rate 5.1% vs local median 6.4% in Remsenburg-Speonk — below-typical yield; the buyer is paying a premium for something (appreciation thesis, condition, location) that the cap rate doesn't capture.
Location & tenants
- Location reads: area grade D — affects rentability + tenant quality, not the cash-flow math above.
- Remsenburg-Speonk Union Free School District (suburban): math 60% / reading 40% proficiency, ranked #389 of 755 in NY (top 52%) — acceptable for families but not a draw, mixed tenant base, ~2y average lease; only 10% free/reduced lunch — higher-income household profile.
- Zoned schools: Remsenburg-Speonk Elementary School (math 52% / reading 62%, grade C+, #842 of 2,108 statewide, top 43%, 122 students, 36% FRL) — zoned schools average 36% FRL vs 10% district-wide (27 pts higher); higher-poverty schools than district average — tighter screening recommended.
- Market conditions: 41 active listings in the ZIP; 3 comparable units currently listed for rent nearby; rentals leasing fast (median 0d on market — plan ~1-2 weeks tenant-placement turnaround); 1,366 units permitted in Suffolk County in 2024 (216 in 5+ unit buildings).
Forward outlook
- In year one you build about $225k of equity ($18k loan paydown + $207k appreciation (7.8% local appreciation)).
- Suffolk County population projected to shrink 5% by 2050 — rents likely to lag national; underwrite the cash flow, not the appreciation.
- By year 2, paydown + projected appreciation supports a ~$360k cash-out refi (75% LTV) — recoverable capital for the next deal without selling this one.
Negotiation context
- It's been on market 16 days — a 2% lower offer ($2.61M) is reasonable based on typical stale-listing flexibility.
- Current owner paid $1.45M; list at $2.65M implies a 83% gain — meaningful room to come down on a strong offer.
Risks & watch-outs
- Climate carrying-cost: severe wind risk, 80% chance of damaging wind over 30y — expect insurance premiums to compound above CPI over the hold.
Questions for the listing agent
- What do current leases actually rent for vs. the listed asking? Can we see a recent rent roll and the last 12 months of T-12 income?
- Is there a deadline driving the sale (1031 exchange, divorce, estate, relocation)? That informs how much negotiation room exists.
- The area grade is low — what's the realistic commute time and amenity access for the typical tenant pool here? Any planned neighborhood developments (good or bad) we should know about?
- What's the average days-on-market for RENTAL listings here right now (not sales)? A rising rental-DOM trend means longer vacancies and softer asking-rent achievability than the comps imply.
- What's the recent tenant-quality profile in this submarket — average credit score on applications, eviction rate, late-payment / NSF rate, and stable-employment percentage? A property-management company in the area should have these aggregated.
- How much new for-sale + rental construction is in the pipeline within 1–3 miles? Heavy new supply typically softens prices + rents 12–24 months out; constrained supply supports both.
Investment metrics
- 1% rule
- 0.75% ✗
- Cap rate
- 5.10%
- Cash-on-cash
- -4.27%
- DSCR
- 0.81
- GRM
- 11.1
CMA / ARV
- ARV (on-the-fly)
- $977,105
- Comps found
- 12
Show comp detail 12 sales within ~0.75 mi
| Address | Dist | Beds/Ba | Sqft | Sold | Price | $/sf | Match |
|---|---|---|---|---|---|---|---|
| 45 Drew Dr | 0.33mi | 4/2.5 | 2,747 (+3%) | 3mo | $780,000 | $284 | 78 |
| 91 Drew Dr | 0.44mi | 4/2.5 | 2,678 (0%) | 7mo | $870,000 | $325 | 74 |
| 11 Sherri Ct | 0.25mi | 5/3.5 (+1) | 2,800 (+5%) | 10mo | $825,000 | $295 | 64 |
| 186 S Country Rd | 0.10mi | 3/4.0 (-1) | 2,404 (-10%) | 15mo | $1,815,000 | $755 | 55 |
| 16 Clay Pit Rd | 0.18mi | 3/2.5 (-1) | 2,300 (-14%) | 11mo | $1,158,000 | $503 | 54 |
| 3 Pheasant Ln | 0.61mi | 4/2.5 | 2,525 (-6%) | 11mo | $2,155,000 | $853 | 53 |
| 8 Drew Dr | 0.70mi | 4/2.5 | 2,600 (-3%) | 17mo | $950,000 | $365 | 48 |
| 15 Andy's Ln | 0.51mi | 4/2.5 | 2,875 (+7%) | 21mo | $900,000 | $313 | 46 |
| 17 East Brook Rd | 0.62mi | 4/2.5 | 2,886 (+8%) | 17mo | $945,000 | $327 | 44 |
| 11 Basket Neck Ln | 0.73mi | 4/4.0 | 2,700 (+1%) | 20mo | $1,750,000 | $648 | 42 |
| 22 Howell Pl | 0.73mi | 4/3.0 | 2,300 (-14%) | 6mo | $835,000 | $363 | 36 |
| 23 Laila Ln | 0.70mi | 4/5.0 | 2,982 (+11%) | 12mo | $2,850,000 | $956 | 28 |
Match score weights: distance 35% · size 25% · config 20% · recency 20%. Top-matched comps best support the ARV.
Projected returns pro-forma
7.81% appreciation · 3.0% rent growth · sell at horizon
- IRR
- 16.3%
- Equity multiple
- 2.20×
- Total profit
- $891,065
- Equity at exit
- $1,978,124
- IRR
- 15.8%
- Equity multiple
- 4.65×
- Total profit
- $2,710,018
- Equity at exit
- $3,894,200
Cash invested: $741,720 (down + closing). Projections, not guarantees.
Landlord ↔ Tenant lean methodology
- Overall (STATE)
- 15 Strongly Tenant-Friendly
- State New York
- 15 Strongly Tenant-Friendly · D+10
- County
- — inherits STATE
- City
- — inherits STATE
ZIP-level market 11960
- Home prices YoY
- 2.1%
- Active inventory
- 41
- Price-to-rent
- 11.1×
Monthly cashflow live
- Estimated rent
- $19,831 medium interval (Pro) →
- Mortgage (P&I)
- −$13,892
- Tax est. 1.5%
- −$3,311 /mo · $39,735/yr
- Insurance
- −$1,104
- HOA
- −$0
- Vacancy / Maint / Mgmt
- −$4,165
- Net cashflow
- $-2,640
Break-even live
Sensitivity live
| Price | -10% $-809 | -5% $-1,725 | +0% $-2,640 | +5% $-3,555 | +10% $-4,471 |
|---|---|---|---|---|---|
| Rent | -10% $-4,207 | -5% $-3,423 | +0% $-2,640 | +5% $-1,857 | +10% $-1,073 |
| Rate | -1.0pp $-1,306 | -0.5pp $-1,966 | base $-2,640 | +0.5pp $-3,326 | +1.0pp $-4,025 |
UW: 25.0% down · 7.5% · 30yr · 1.5% tax · 5.0% vac · 8.0% maint · 8.0% mgmt
Financing live
Cash to close
- Down payment
- $662,250
- Closing costs
- $79,470
- Reserves months
- —
- Total cash needed
- —
Loan-product check · same deal, 3 products live
Conventional
25% down · 7.5% · 30yr
- Down + closing
- —
- Monthly P&I
- —
- Monthly cashflow
- —
- DSCR
- —
- Eligible?
- —
Personal DTI + credit; lowest rate.
DSCR
20% down · 8.5% · 30yr
- Down + closing
- —
- Monthly P&I
- —
- Monthly cashflow
- —
- DSCR
- —
- Eligible?
- —
No personal income docs; deal must DSCR.
Hard money
10% down · 12.0% · 12mo
- Down + closing
- —
- Monthly P&I
- —
- Monthly cashflow
- —
- DSCR
- —
- Eligible?
- —
Short-term bridge; refi at stabilization.
Rent comps 3 comps
| Address | Beds | Baths | Sqft | Rent | $/sqft | DOM | Units | Dist |
|---|---|---|---|---|---|---|---|---|
| 3 Pine Grove Ct Westhampton, NY | 4.0 | 3.5 | 3500 | $35,000 | $10.00 | 23d | 1 | 1.18mi |
| 35 Halsey Rd Remsenburg, NY | 3.0 | 2.0 | 2345 | $10,000 | $4.26 | 0d | 1 | 1.26mi |
| 134A Montauk Hwy Westhampton, NY | 4.0 | 3.5 | 2478 | $15,000 | $6.05 | 0d | 1 | 1.48mi |
Listing history 11 events
-
2026-06-21days on market $2,649,000 Active 16 DOM
-
2026-06-18days on market $2,649,000 Active 13 DOM
-
2026-06-17days on market $2,649,000 Active 12 DOM
-
2026-06-16days on market $2,649,000 Active 11 DOM
-
2026-06-15days on market $2,649,000 Active 10 DOM
-
2026-06-13days on market $2,649,000 Active 8 DOM
-
2026-06-13days on market $2,649,000 Active 7 DOM
-
2026-06-09days on market $2,649,000 Active 4 DOM
-
2026-06-08days on market $2,649,000 Active 3 DOM
-
2026-06-07remarks 699-char remark
-
2026-06-07$2,649,000 Active 2 DOM
ⓘ Source: listings_history table (triggers on properties + properties_extension) + one-shot
backfill from property_details.listing_events for pre-trigger history.
Climate risk First Street
- Flood 1/10 Low FEMA zone X (unshaded) · 0% chance over 30 yrs
- Wildfire 2/10 Low
- Heat 4/10 Moderate 7 d/yr ≥91°F today · 18 d/yr by 30 yrs out
- Wind 8/10 Severe 80% chance of damaging wind over 30 yrs
- Air quality 4/10 Moderate 4 unhealthy d/yr today · 5 by 30 yrs out
Nearby sold comps map
Loading sold comps map…
Walkable amenities ~0.75 mi
Loading nearby amenities…
Taxation est. · year 1
- Rental income
- $237,974
- − Mortgage interest
- −$148,385
- − Property taxes
- −$39,735
- − Insurance
- −$13,245
- − Repairs & maintenance
- −$19,038
- − Management
- −$19,038
- − Depreciation
- −$77,062
- Taxable loss
- −$78,529
- Est. tax savings @ 24.0%
- +$18,847
- After-tax cash flow
- $-12,833/yr
For passive investors: Depreciation is non-cash, so a rental often shows a tax loss while cash-flowing — sheltering income. Rental losses are passive: they offset passive income freely, and up to $25,000/yr can offset ordinary (W-2) income if you actively participate and your MAGI is under $100k (phasing out to $0 by $150k); unused losses carry forward. On sale, claimed depreciation is recaptured at up to 25%, and gains may owe capital-gains tax (a 1031 exchange can defer both). Figures are a year-1 estimate at your 24.0% rate — not tax advice; consult a CPA.
Schools (NCES district)
- District
- Remsenburg-Speonk Union Free School District
- NCES district ID
- 3624420
- Math proficiency
- 60% ▲ 10.00%
- Reading proficiency
- 40% ▼ -10.00%
- Median HH income
- $79,972
- Composite
- 47.7/100
- National rank
- #4915
- State rank
- #389 of 755 in NY
Livability — Remsenburg-Speonk
No livability data for this city. (Only ~50 U.S. cities are tracked.)
Census & demographics
- Census place
- Remsenburg-Speonk, NY
- City population
- 1,346
- Population (ZIP)
- 1,037
Population outlook (Suffolk County) Hauer SSP2
- Today (2025)
- 1,505,262 people
- By 2030
- 1,498,318 · -0.5%
- By 2040
- 1,471,101 · -2.3%
- By 2050
- 1,424,848 · -5.3%
- By 2075
- 1,337,157 · -11.2%
- By 2100
- 1,217,720 · -19.1%
Race, ethnicity, and origin ACS 2023
- Neighborhood character
- Predominantly White (100%)
- Race & ethnicity
- White 100%
- Common ancestry
- Iranian 9% Romanian 8% Scotch-Irish 1%
- Foreign-born
- 3%
Political lean MEDSL · Suffolk
- 2024 margin
- Lean R (+10.0) · D 45.0% · R 55.0%
- 2008→2024 swing
- -16.0pp toward R · 2008: 6.0pp · 2024: -10.0pp
- All cycles
- 2024: R+10.0 2020: R+0.0 2016: R+8.2 2012: D+2.9 2008: D+6.0
Not yet ingested
- Civics
- —
Market trends
- HPI YoY
- ▲ 7.81%
- Current HPI
- 386.454
- Rent YoY
- —
- Metro
- —
- State GDP YoY
- ▲ 2.60%
- F500 in state
- 92
Industry mix (Fortune 500 HQ in NY)
| Industry | F500 HQs | Revenue |
|---|---|---|
| Financial Services | 10 | $950B |
|
||
| Consumer Goods | 9 | $162B |
|
||
| Insurance | 4 | $225B |
|
||
| Telecommunications | 2 | $144B |
|
||
| Pharmaceuticals | 2 | $112B |
|
||
| Media / Entertainment | 2 | $69B |
|
||
Price history
+82.7% since first listed2 events — show timeline
- 2026-06-05 Listed $2,649,000 OneKey® MLS as Distributed by MLS Grid
- 2024-03-28 Sold (Public Records) $1,450,000 Public Records
Property tax history
+2.1%/yrLatest (2024): $5,061 · +0.0% YoY. Source: county tax records.
Cash-flow waterfall
monthlySold comps — $/sqft
last 12 mo · ≤1 miLoading sold comps…