1913 Blue Ridge Dr · Flower Mound, TX
Flood risk 1/10 · Minimal
- FEMA flood zone
- X (unshaded)
- Chance of flooding over 30 yrs
- 0.0%
- Est. flood insurance / yr
- $507 – $1,088
Fire risk 5/10 · Moderate
- Est. fire insurance / yr
- $1,222 – $2,270
Heat risk 7/10 · Major
- Hot days now (above 109°F)
- 7 days/yr
- Hot days in 30 yrs
- 22 days/yr
Wind risk 4/10 · Minor
- Chance of severe wind over 30 yrs
- 24.0%
Air-quality risk 3/10 · Minor
- Unhealthy air days now
- 3 days/yr
- Unhealthy air days in 30 yrs
- 4 days/yr
Risk factors via First Street. Map © Google.
Why this score? — see what drove the D grade
The composite is a weighted blend of 9 inputs, each scored 0–100. Each bar is that input's sub-score; the figure is the points it added to the 100-point composite (weight × sub-score).
- Cash flow +13.3/30.0
- ARV discount +7.2/15.0
- Schools +4.7/10.0
- DSCR +4.0/10.0
- 1% rule +3.7/10.0
- Livability +3.6/5.0
- Condition / age +2.5/5.0
- Rent growth +2.4/5.0
- Appreciation +0.0/10.0
$799,900
🖨 Deal sheet (PDF) 📄 Offer letter ✓ Due diligence
Listing remarks
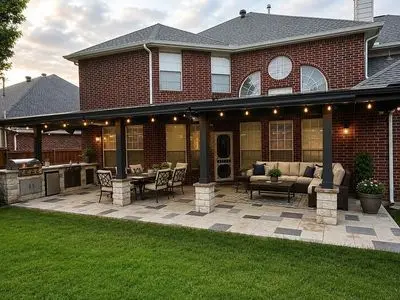
Beautifully maintained east-facing home offering 3,783 sq ft of spacious, light-filled living. This desirable layout features 4 bedrooms, 4 bathrooms, a private study (ideal for remote work), formal living and dining areas, plus an additional living space—perfect for both everyday comfort and entertaining. Step outside to your large covered patio with a built-in outdoor kitchen, creating the perfect setup for hosting and relaxing year-round. Built in 1999 and situated on a 0.23-acre lot, this home also includes a 2-car garage and excellent curb appeal. Roof replaced in 2017. AC Unit in 2022.
Key facts
- Large covered patio
- Private study
- 0.23 acre lot
Tags
Property features AI
Finance
- Other: Possession in 30-60 days
- Financial info: Listing terms: Cash; Loan payment type: Principal & Interest; No second mortgage indicated
- HOA & community: Mandatory association; HOA fee $17 monthly; Association fee includes full use of facilities; HOA management company: AAA
Exterior
- Parking: Attached garage; 2 covered/garage parking spaces (garage width approx. 20 ft, length approx. 20 ft, height approx. 20 ft); 2 covered spaces
- Utilities: City water; City sewer; No municipal utility district
- Home design: Single-family residence; Residential property; Two-story; Built in 1999; Not attached to another property; Lot less than 0.5 acre (approx. 0.2328 acres); Subdivision: Towne View Estate Ph I
- Construction: Slab foundation; Preowned condition
- Exterior features: Covered patio/porch
Interior
- Kitchen: Dishwasher; Disposal; Microwave; Refrigerator; Gas/standard range (not specified)
- Bedrooms: Primary bedroom on level 1 (approx. 16 x 14); Additional bedroom on level 1 (approx. 12 x 11)
- Flooring: Carpet
- Bathrooms: 4 full bathrooms
- Heating & cooling: Central heating; Central air conditioning; Living room fireplace
- Interior features: Bay windows; Two living areas; One dining area; Other interior features; 5 total rooms; Two levels
- Laundry & utility: Washer; Dryer
Neighborhood map
What this means for you Summary
Snapshot
- This is a 4-bed/3.0-bath single-family listed at $800k.
Deal economics
- At list price, monthly cash flow is $0 ($-5/yr) — negative.
- To cash-flow at today's rent, offer at most $800k (0.0% below list).
- To meet the 1% rule (rent ≥ 1% of price), the offer needs to be $693k (13.3% below list).
- Recommended offer: $693k (13.3% below list) — sets the bar for 1% rule.
- Cap rate 6.3% vs local median 2.5% in Flower Mound — top-decile yield for the area; either an underpriced asset or a hidden risk that comps aren't pricing in. Stress-test before assuming the spread holds.
Location & tenants
- Location reads 71/100 on livability (#317 in TX) — a middle-class / working-renter tenant base. Strengths: crime A+, employment A+, housing A+; Watch: amenities F, commute F, cost of living F.
- Lewisville ISD (suburban): math 49% / reading 54% proficiency, ranked #109 of 826 in TX (top 13%) — acceptable for families but not a draw, mixed tenant base, ~2y average lease.
- Zoned schools: Bluebonnet El (math 72% / reading 71%, grade A-, #117 of 4,322 statewide, top 3%, 632 students, 10% FRL); Shadow Ridge Middle (math 64% / reading 72%, grade A-, #73 of 1,662 statewide, top 5%, 649 students, 11% FRL); Flower Mound H S (math 82% / reading 86%, grade A, #19 of 1,632 statewide, top 1%, 3,542 students, 7% FRL) — zoned schools average 9% FRL vs 26% district-wide (17 pts lower); this property's tenant base skews higher-income than the district average.
- Zoned-school proficiency averages 74% at this address vs 52% district-wide (+23 pts) — the actual schools serving this property are materially stronger than the Lewisville ISD average implies; a family-tenant draw the district grade alone would hide.
- Market conditions: Rents soft (-0.2%/yr); 276 active listings in the ZIP; 12 comparable units currently listed for rent nearby; rentals at typical pace (median 24d on market — plan ~3-4 weeks tenant-placement turnaround); 42% of comp listings sitting > 30 days — soft ceiling on asking rent; high-income renter base; 10,531 units permitted in Denton County in 2024 (2,713 in 5+ unit buildings).
- At $6,932/mo this rent would consume 56% of the median local household income ($149k/yr) (locally 779% of renters already pay >50% of income on rent) — very limited rent-growth headroom before tenants either downsize or default.
Forward outlook
- Local home prices are declining (-3.0%/yr); year-one equity from $6k of loan paydown is wiped out by about $24k of value loss. Plan a longer hold.
- Denton County population projected at +66% by 2050 — long-run rental-demand tailwind backs the buy-and-hold thesis.
Negotiation context
- It's been on market 32 days — a 3% lower offer ($776k) is reasonable based on typical stale-listing flexibility.
Risks & watch-outs
- Climate carrying-cost: moderate wildfire risk; extreme-heat days projected 7→22/yr by 2055 (HVAC capex compounding) — expect insurance premiums to compound above CPI over the hold.
Questions for the listing agent
- What do current leases actually rent for vs. the listed asking? Can we see a recent rent roll and the last 12 months of T-12 income?
- It's been on market 32 days. Have you received any prior offers? Is the seller open to a 13% concession, seller financing, or rate buy-down credit?
- What does the HOA fee cover, when was the last increase, and are there any pending special assessments or reserve-fund shortfalls?
- Is there a deadline driving the sale (1031 exchange, divorce, estate, relocation)? That informs how much negotiation room exists.
- Schools are A-rated — typically a magnet for longer-tenancy family renters. What's the average tenant stay here, and is there a school-zone premium baked into asking?
- The area grade is low — what's the realistic commute time and amenity access for the typical tenant pool here? Any planned neighborhood developments (good or bad) we should know about?
- What's the average days-on-market for RENTAL listings here right now (not sales)? A rising rental-DOM trend means longer vacancies and softer asking-rent achievability than the comps imply.
- What's the recent tenant-quality profile in this submarket — average credit score on applications, eviction rate, late-payment / NSF rate, and stable-employment percentage? A property-management company in the area should have these aggregated.
- How much new for-sale + rental construction is in the pipeline within 1–3 miles? Heavy new supply typically softens prices + rents 12–24 months out; constrained supply supports both.
Investment metrics
- 1% rule
- 0.87% ✗
- Cap rate
- 6.29%
- Cash-on-cash
- -0.00%
- DSCR
- 1.00
- GRM
- 9.6
CMA / ARV
- ARV (on-the-fly)
- $794,640
- Comps found
- 12
Show comp detail 12 sales within ~0.75 mi
| Address | Dist | Beds/Ba | Sqft | Sold | Price | $/sf | Match |
|---|---|---|---|---|---|---|---|
| 1817 Lake Forest Blvd | 0.26mi | 4/3.5 | 3,973 (+5%) | 1mo | $800,000 | $201 | 77 |
| 2325 Heather Ridge Dr | 0.03mi | 5/4.0 (+1) | 4,055 (+7%) | 5mo | $845,000 | $208 | 73 |
| 1817 Meadow Ridge Dr | 0.15mi | 5/3.0 (+1) | 3,464 (-8%) | 4mo | $675,000 | $195 | 71 |
| 2301 Heather Ridge Dr | 0.12mi | 4/3.0 | 3,401 (-10%) | 9mo | $694,000 | $204 | 70 |
| 2321 Dana Dr | 0.06mi | 5/3.0 (+1) | 3,262 (-14%) | 1mo | $700,000 | $215 | 68 |
| 117 Red Oak Ln | 0.58mi | 4/3.5 | 3,799 (+0%) | 13mo | $1,320,000 | $347 | 59 |
| 1905 Tophill Dr | 0.43mi | 4/3.5 | 3,503 (-7%) | 12mo | $825,000 | $236 | 56 |
| 2212 Turtle Cv | 0.45mi | 4/3.5 | 4,008 (+6%) | 14mo | $621,000 | $155 | 55 |
| 2712 Meadow Green Dr | 0.40mi | 5/4.0 (+1) | 3,573 (-6%) | 14mo | $750,000 | $210 | 51 |
| 2717 Meadow Wood Dr | 0.46mi | 5/3.5 (+1) | 3,508 (-7%) | 13mo | $775,000 | $221 | 48 |
| 2116 Morgan Dr | 0.30mi | 4/4.0 | 3,268 (-14%) | 13mo | $775,000 | $237 | 48 |
| 2116 Dana Ct | 0.31mi | 5/4.0 (+1) | 4,154 (+10%) | 15mo | $825,000 | $199 | 48 |
Match score weights: distance 35% · size 25% · config 20% · recency 20%. Top-matched comps best support the ARV.
Projected returns pro-forma
-3.0% appreciation · 0.0% rent growth · sell at horizon
- IRR
- -19.7%
- Equity multiple
- 0.33×
- Total profit
- $-149,888
- Equity at exit
- $119,268
- IRR
- -20.6%
- Equity multiple
- 0.07×
- Total profit
- $-208,768
- Equity at exit
- $69,161
Cash invested: $223,972 (down + closing). Projections, not guarantees.
Landlord ↔ Tenant lean methodology
- Overall (STATE)
- 87 Strongly Landlord-Friendly
- State Texas
- 87 Strongly Landlord-Friendly · R+5
- County
- — inherits STATE
- City
- — inherits STATE
ZIP-level market 75028
- Home prices YoY
- -27.9%
- Rents YoY
- -0.2%
- Active inventory
- 276
- Price-to-rent
- 9.6×
Monthly cashflow live
- Estimated rent
- $6,932 high interval (Pro) →
- Mortgage (P&I)
- −$4,195
- Tax from tax record
- −$932 /mo · $11,180/yr
- Insurance
- −$333
- HOA
- −$17
- Vacancy / Maint / Mgmt
- −$1,456
- Net cashflow
- $-0
Break-even live
Sensitivity live
| Price | -10% $452 | -5% $226 | +0% $0 | +5% $-227 | +10% $-453 |
|---|---|---|---|---|---|
| Rent | -10% $-548 | -5% $-274 | +0% $0 | +5% $273 | +10% $547 |
| Rate | -1.0pp $402 | -0.5pp $203 | base $0 | +0.5pp $-208 | +1.0pp $-419 |
UW: 25.0% down · 7.5% · 30yr · 1.5% tax · 5.0% vac · 8.0% maint · 8.0% mgmt
Financing live
Cash to close
- Down payment
- $199,975
- Closing costs
- $23,997
- Reserves months
- —
- Total cash needed
- —
Loan-product check · same deal, 3 products live
Conventional
25% down · 7.5% · 30yr
- Down + closing
- —
- Monthly P&I
- —
- Monthly cashflow
- —
- DSCR
- —
- Eligible?
- —
Personal DTI + credit; lowest rate.
DSCR
20% down · 8.5% · 30yr
- Down + closing
- —
- Monthly P&I
- —
- Monthly cashflow
- —
- DSCR
- —
- Eligible?
- —
No personal income docs; deal must DSCR.
Hard money
10% down · 12.0% · 12mo
- Down + closing
- —
- Monthly P&I
- —
- Monthly cashflow
- —
- DSCR
- —
- Eligible?
- —
Short-term bridge; refi at stabilization.
Rent comps 12 comps
| Address | Beds | Baths | Sqft | Rent | $/sqft | DOM | Units | Dist |
|---|---|---|---|---|---|---|---|---|
| 2105 Friar Ct Flower Mound, TX | 4.0 | 3.0 | 2976 | $3,250 | $1.09 | 20d | 1 | 0.62mi |
| 1740 Forest Glen Dr Flower Mound, TX | 4.0 | 2.5 | 3150 | $8,000 | $2.54 | 45d | 1 | 0.64mi |
| 1012 Canongate Dr Flower Mound, TX | 4.0 | 3.0 | 3214 | $3,700 | $1.15 | 13d | 1 | 0.88mi |
| 2825 Waverly Rd Flower Mound, TX | 4.0 | 2.5 | 2796 | $11,000 | $3.93 | 45d | 1 | 0.92mi |
| 2825 Waverly Rd Unit 1060868P Flower Mound, TX | 4.0 | 2.5 | 2787 | $13,379 | $4.80 | 23d | 1 | 0.92mi |
| 2912 Shadow Oak Ct Flower Mound, TX | 4.0 | 2.5 | 3375 | $4,700 | $1.39 | 18d | 1 | 0.99mi |
| 2005 Glory Creek Cir Unit 1019636P Flower Mound, TX | 4.0 | 3.5 | 2873 | $16,001 | $5.57 | 45d | 1 | 1.11mi |
| 2005 Glory Creek Cir Flower Mound, TX | 4.0 | 3.5 | 2884 | $10,500 | $3.64 | 45d | 1 | 1.11mi |
| 1805 Southwicke Dr Flower Mound, TX | 5.0 | 3.5 | 4238 | $4,600 | $1.09 | 22d | 1 | 1.17mi |
| 2676 McPherson Ln Flower Mound, TX | 5.0 | 4.0 | 3672 | $6,750 | $1.84 | 20d | 1 | 1.23mi |
| 428 Northwood Dr Unit 428 Flower Mound, TX | 3.0 | 3.5 | 3198 | $8,950 | $2.80 | 45d | 1 | 1.37mi |
| 2400 Sweet Grass Trl Flower Mound, TX | 4.0 | 3.5 | 3140 | $4,500 | $1.43 | 7d | 1 | 1.41mi |
HOA detail
- Monthly dues
- $17 · $204/yr
Listing history 18 events
-
2026-06-21days on market $799,900 Active 32 DOM
-
2026-06-18days on market $799,900 Active 29 DOM
-
2026-06-17price $799,900 Active 28 DOM
-
2026-06-17days on market $824,999 Active 28 DOM
-
2026-06-16days on market $824,999 Active 27 DOM
-
2026-06-15days on market $824,999 Active 26 DOM
-
2026-06-13days on market $824,999 Active 24 DOM
-
2026-06-13days on market $824,999 Active 23 DOM
-
2026-06-09days on market $824,999 Active 20 DOM
-
2026-06-08days on market $824,999 Active 19 DOM
-
2026-06-07days on market $824,999 Active 18 DOM
-
2026-06-04days on market $824,999 Active 15 DOM
-
2026-06-03days on market $824,999 Active 14 DOM
-
2026-06-02pricedays on market $824,999 Active 13 DOM
-
2026-06-01days on market $849,999 Active 12 DOM
-
2026-05-31days on market $849,999 Active 11 DOM
-
2026-05-12$849,999 Active 1093-char remark
-
2007-06-27soldstatus
ⓘ Source: listings_history table (triggers on properties + properties_extension) + one-shot
backfill from property_details.listing_events for pre-trigger history.
Tax reassessment forecast TX · Resets to sale price
- Current annual tax
- $11,180 · $932/mo
- Projected year-2 tax
- $14,638 · $1,220/mo
- Expected delta
- +$3,459/yr (+$288/mo · 30.9%)
ⓘ Screening estimate from a state-policy table — verify with the county assessor before closing.
Climate risk First Street
- Flood 1/10 Low FEMA zone X (unshaded) · 0% chance over 30 yrs
- Wildfire 5/10 Major
- Heat 7/10 Severe 7 d/yr ≥109°F today · 22 d/yr by 30 yrs out
- Wind 4/10 Moderate 24% chance of damaging wind over 30 yrs
- Air quality 3/10 Moderate 3 unhealthy d/yr today · 4 by 30 yrs out
Nearby sold comps map
Loading sold comps map…
Walkable amenities ~0.75 mi
Loading nearby amenities…
Taxation est. · year 1
- Rental income
- $83,183
- − Mortgage interest
- −$44,807
- − Property taxes
- −$11,180
- − Insurance
- −$4,000
- − Repairs & maintenance
- −$6,655
- − Management
- −$6,655
- − HOA
- −$204
- − Depreciation
- −$23,270
- Taxable loss
- −$13,586
- Est. tax savings @ 24.0%
- +$3,261
- After-tax cash flow
- $3,255/yr
For passive investors: Depreciation is non-cash, so a rental often shows a tax loss while cash-flowing — sheltering income. Rental losses are passive: they offset passive income freely, and up to $25,000/yr can offset ordinary (W-2) income if you actively participate and your MAGI is under $100k (phasing out to $0 by $150k); unused losses carry forward. On sale, claimed depreciation is recaptured at up to 25%, and gains may owe capital-gains tax (a 1031 exchange can defer both). Figures are a year-1 estimate at your 24.0% rate — not tax advice; consult a CPA.
Schools (NCES district)
- District
- Lewisville ISD
- NCES district ID
- 4827300
- Math proficiency
- 49% ▼ -10.00%
- Reading proficiency
- 54% ▼ -4.00%
- Median HH income
- $82,351
- Composite
- 47.1/100
- National rank
- #2333
- State rank
- #109 of 826 in TX
Livability — Flower Mound
- Score
- 71/100
- State rank
- #317
- US rank
- #7074
Category grades
Schools grade is shown separately in the Schools card above.
Census & demographics
- Census place
- Flower Mound, TX
- County
- Denton County · 901,654 people
- City population
- 75,184
- Metro
- Dallas-Fort Worth-Arlington, TX
- Population (ZIP)
- 49,094
- Household income
- $149,436
- Rent vs Own
- Severe rent burden
- 779.0
Population outlook (Denton County) Hauer SSP2
- Today (2025)
- 1,053,010 people
- By 2030
- 1,192,269 · +13.2%
- By 2040
- 1,472,920 · +39.9%
- By 2050
- 1,746,506 · +65.9%
- By 2075
- 2,358,497 · +124.0%
- By 2100
- 2,779,183 · +163.9%
Race, ethnicity, and origin ACS 2023
- Neighborhood character
- Predominantly White (68%)
- Race & ethnicity
- White 68% Hispanic / Latino 12% Asian 12% Two or more races 10% Black 4%
- Hispanic origin (detail)
- Mexican 7%
- Common ancestry
- Romanian 3% Slovak 3% Serbian 3%
- Foreign-born
- 14% · Canada, South Korea, China
- Languages at home
- 81% English-only · Spanish 7% Other Asian/Pacific 4% Other Indo-European 3%
Political lean MEDSL · Denton
- 2024 margin
- R (+13.2) · D 42.7% · R 55.8% · Other 1.5%
- 2008→2024 swing
- +11.0pp toward D · 2008: -24.2pp · 2024: -13.2pp
- All cycles
- 2024: R+13.2 2020: R+8.1 2016: R+20.2 2012: R+31.7 2008: R+24.2
Not yet ingested
- Civics
- —
Market trends
- HPI YoY
- ▼ -107.51%
- Current HPI
- 277.7883
- Rent YoY
- ▼ -0.25%
- Metro
- Dallas-Fort Worth-Arlington, TX
- State GDP YoY
- ▲ 3.95%
- F500 in state
- 110
Industry mix (Fortune 500 HQ in TX)
| Industry | F500 HQs | Revenue |
|---|---|---|
| Energy | 16 | $1,198B |
|
||
| Technology | 5 | $198B |
|
||
| Engineering / Construction | 4 | $72B |
|
||
| Energy Services | 3 | $60B |
|
||
| Utilities | 3 | $41B |
|
||
| Healthcare | 2 | $330B |
|
||
Price history
-5.9% since first listed4 events — show timeline
- 2026-06-17 Price Changed $799,900 NTREIS
- 2026-06-02 Price Changed $824,999 NTREIS
- 2026-05-20 Listed $849,999 NTREIS
- 2007-06-27 Sold (Public Records) — Public Records
Property tax history
+3.2%/yrLatest (2025): $11,180 · +9.9% YoY. Source: county tax records.
Cash-flow waterfall
monthlySold comps — $/sqft
last 12 mo · ≤1 miLoading sold comps…