 Multi-family
28982 Skyhaven Ct · Temecula, CA
Flood risk No data
- FEMA flood zone
- —
- Chance of flooding over 30 yrs
- —
- Est. flood insurance / yr
- —
Fire risk No data
- Est. fire insurance / yr
- —
Heat risk No data
- Hot days now (above threshold)
- —
- Hot days in 30 yrs
- —
Wind risk No data
- Chance of severe wind over 30 yrs
- —
Air-quality risk No data
- Unhealthy air days now
- —
- Unhealthy air days in 30 yrs
- —
Risk factors via First Street. Map © Google.
Why this score? — see what drove the B- grade
The composite is a weighted blend of 9 inputs, each scored 0–100. Each bar is that input's sub-score; the figure is the points it added to the 100-point composite (weight × sub-score).
- Cash flow +25.2/30.0
- DSCR +8.3/10.0
- ARV discount +7.5/15.0
- 1% rule +6.6/10.0
- Schools +5.7/10.0
- Appreciation +5.1/10.0
- Rent growth +3.7/5.0
- Livability +3.6/5.0
- Condition / age +1.0/5.0
$804,010
🖨 Deal sheet 📄 Offer letter ✓ Due diligence
Listing remarks
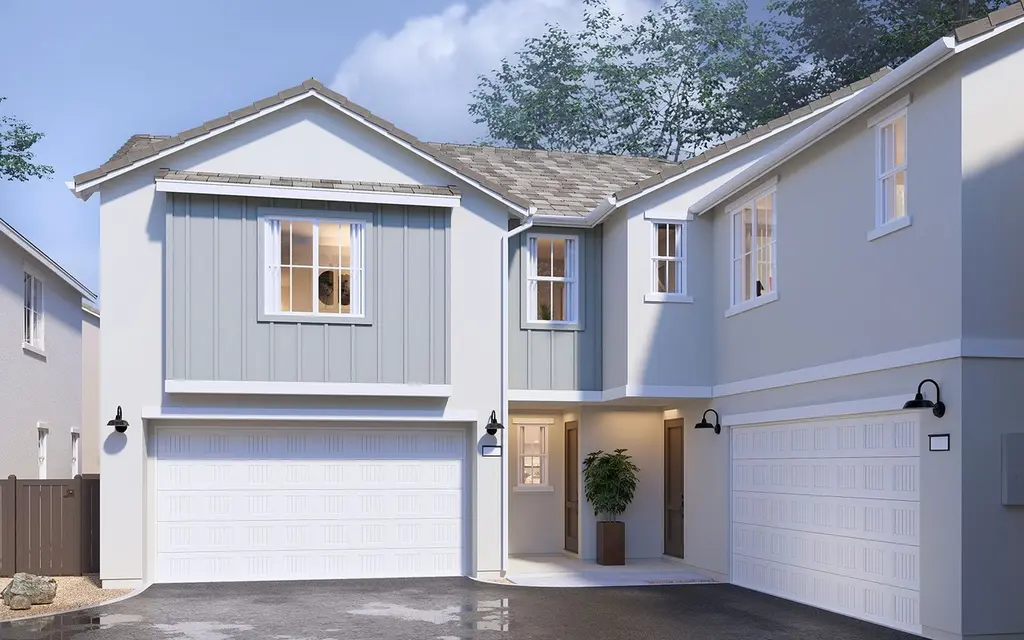
Step inside to an open-concept layout where the dining area, great room and kitchen with a spacious pantry come together with natural ease, anchored by a central island that makes everyday meals and relaxed gatherings feel effortless. Both the great room and the primary bedroom open to a private yard, creating a serene outdoor retreat. The primary bedroom offers a private escape with a spacious walk-in closet and relaxing bath, while a secondary bedroom, full bath and conveniently located laundry room round out the first floor. Upstairs there are two additional bedrooms plus a full bath and an extra spacious covered deck invites fresh air and quiet moments outside. From top to bottom, this
Key facts
- Covered deck
- Spacious pantry
- Walk-in closet
Tags
Property features AI
Finance
- Financial info: List price $804,010
Exterior
- Parking: 2 garage spaces (2 total parking spaces)
- Home design: Single-family residence
- Exterior features: 2,007 living area
Interior
- Bedrooms: 4 bedrooms
- Bathrooms: 3 full bathrooms
- Interior features: Spec home (new construction, Plan 4); Active listing
Neighborhood map
What this means for you Summary
Snapshot
- This is a 4-bed/3.0-bath multifamily listed at $804k. Condition is rated poor.
Deal economics
- At list price, monthly cash flow is $2k ($22k/yr) — positive.
- The deal already cash-flows at list — no discount required.
- Meets the 1% rule at list price ($9k rent vs $804k).
- Recommended offer: $792k (1.5% below list) — sets the bar for market timing.
- Cap rate 9.0% vs local median 2.6% in Temecula — top-decile yield for the area; either an underpriced asset or a hidden risk that comps aren't pricing in. Stress-test before assuming the spread holds.
Location & tenants
- Location reads 71/100 on livability (#225 in CA) — a middle-class / working-renter tenant base. Strengths: employment A+, housing A+, crime B+; Watch: cost of living F, health & safety F.
- Temecula Valley Unified (urban): math 55% / reading 69% proficiency, ranked #173 of 1,400 in CA (top 12%) — acceptable for families but not a draw, mixed tenant base, ~2y average lease; only 17% free/reduced lunch — higher-income household profile.
- Market conditions: Rents rising fast (+4.6%/yr); 182 active listings in the ZIP; 9 comparable units currently listed for rent nearby; rentals at typical pace (median 24d on market — plan ~3-4 weeks tenant-placement turnaround); 44% of comp listings sitting > 30 days — soft ceiling on asking rent; solid renter incomes; 9,195 units permitted in Riverside County in 2024 (1,512 in 5+ unit buildings).
- At $9,315/mo this rent would consume 131% of the median local household income ($85k/yr) (locally 130% of renters already pay >50% of income on rent) — very limited rent-growth headroom before tenants either downsize or default.
Forward outlook
- In year one you build about $7k of equity ($6k loan paydown + $1k appreciation (0.1% local appreciation)).
- Riverside County population projected at +22% by 2050 — long-run rental-demand tailwind backs the buy-and-hold thesis.
- At projected returns (0.1% appreciation + 4.6% rent growth), your $225k cash investment doubles in ~6 years — after that, you're playing with house money.
- By year 6, paydown + projected appreciation supports a ~$45k cash-out refi (75% LTV) — recoverable capital for the next deal without selling this one.
Negotiation context
- It's been on market 22 days — a 2% lower offer ($792k) is reasonable based on typical stale-listing flexibility.
Questions for the listing agent
- Have any recent inspections been done? Can we get a copy of the seller's disclosures and any deferred-maintenance estimates?
- Is there a deadline driving the sale (1031 exchange, divorce, estate, relocation)? That informs how much negotiation room exists.
- Schools are B-rated — typically a magnet for longer-tenancy family renters. What's the average tenant stay here, and is there a school-zone premium baked into asking?
- What's the average days-on-market for RENTAL listings here right now (not sales)? A rising rental-DOM trend means longer vacancies and softer asking-rent achievability than the comps imply.
- What's the recent tenant-quality profile in this submarket — average credit score on applications, eviction rate, late-payment / NSF rate, and stable-employment percentage? A property-management company in the area should have these aggregated.
- How much new apartment / multifamily construction is in the pipeline within 1–3 miles? Heavy new supply (>2% of stock underway) typically softens rents 12–24 months out; light construction supports rent growth.
Investment metrics
- 1% rule
- 1.16% ✓
- Cap rate
- 8.98%
- Cash-on-cash
- 9.61%
- DSCR
- 1.43
- GRM
- 7.2
CMA / ARV
No comps found within radius.
Projected returns pro-forma
0.13% appreciation · 4.6% rent growth · sell at horizon
- IRR
- 10.1%
- Equity multiple
- 1.50×
- Total profit
- $111,527
- Equity at exit
- $238,639
- IRR
- 16.0%
- Equity multiple
- 2.87×
- Total profit
- $421,111
- Equity at exit
- $291,021
Cash invested: $225,123 (down + closing). Projections, not guarantees.
Landlord ↔ Tenant lean methodology
- Overall (STATE)
- 18 Strongly Tenant-Friendly
- State California
- 18 Strongly Tenant-Friendly · D+13
- County
- — inherits STATE
- City
- — inherits STATE
ZIP-level market 92590
- Home prices YoY
- 0.0%
- Rents YoY
- 4.6%
- Active inventory
- 182
- Price-to-rent
- 25.6×
Monthly cashflow live
- Estimated rent
- $9,315 medium interval (Pro) →
- Mortgage (P&I)
- −$4,216
- Tax est. 1.5%
- −$1,005 /mo · $12,060/yr
- Insurance
- −$335
- HOA
- −$0
- Vacancy / Maint / Mgmt
- −$1,956
- Net cashflow
- $1,803
Break-even live
4-unit breakdown (identical units grouped — click to expand)
| Units | Beds | Baths | Est. rent |
|---|---|---|---|
| 2× units | 2 | 1 | $5,232 |
| #1 | 2 | 1 | $2,616 |
| #2 | 2 | 1 | $2,616 |
| 2× units | 1 | 1 | $4,084 |
| #3 | 1 | 1 | $2,042 |
| #4 | 1 | 1 | $2,042 |
| Total (4 units) | $9,315 | ||
UW: 25.0% down · 7.5% · 30yr · 1.5% tax · 5.0% vac · 8.0% maint · 8.0% mgmt
Financing live
Cash to close
- Down payment
- $201,002
- Closing costs
- $24,120
- Reserves months
- —
- Total cash needed
- —
Loan-product check · same deal, 3 products live
Conventional
25% down · 7.5% · 30yr
- Down + closing
- —
- Monthly P&I
- —
- Monthly cashflow
- —
- DSCR
- —
- Eligible?
- —
Personal DTI + credit; lowest rate.
DSCR
20% down · 8.5% · 30yr
- Down + closing
- —
- Monthly P&I
- —
- Monthly cashflow
- —
- DSCR
- —
- Eligible?
- —
No personal income docs; deal must DSCR.
Hard money
10% down · 12.0% · 12mo
- Down + closing
- —
- Monthly P&I
- —
- Monthly cashflow
- —
- DSCR
- —
- Eligible?
- —
Short-term bridge; refi at stabilization.
Rent comps 9 comps
| Address | Beds | Baths | Sqft | Rent | $/sqft | DOM | Units | Dist |
|---|---|---|---|---|---|---|---|---|
| 43045 Calle Cristal Temecula, CA | 3.0 | 2.5 | 1739 | $3,100 | $1.78 | 43d | 1 | 0.66mi |
| 43081 Avenida Amistad Temecula, CA | 3.0 | 2.5 | 1739 | $3,200 | $1.84 | 4d | 1 | 0.69mi |
| 42942 Avenida Amistad Temecula, CA | 3.0 | 2.5 | 1739 | $3,100 | $1.78 | 20d | 1 | 0.72mi |
| 42945 Avenida Amistad Temecula, CA | 3.0 | 2.5 | 1739 | $3,250 | $1.87 | 43d | 1 | 0.72mi |
| 29575 Pujol St Temecula, CA | 1.0–3.0 | 1.0–2.5 | 1110 | $3,444 | $3.10 | 1d | 9 | 0.88mi |
| 42744 Azure St Temecula, CA | 4.0 | 3.0 | 2014 | $3,250 | $1.61 | 12d | 1 | 1.27mi |
| 42752 Azure St Temecula, CA | 3.0 | 2.5 | 1564 | $3,095 | $1.98 | 43d | 1 | 1.27mi |
| 42720 Azure St Temecula, CA | 3.0 | 2.5 | 1974 | $5,500 | $2.79 | 24d | 1 | 1.27mi |
| 29495 Cara Way Temecula, CA | 3.0 | 3.0 | 1407 | $2,950 | $2.10 | 43d | 1 | 1.43mi |
Listing history 12 events
-
2026-06-17days on market $804,010 Active 22 DOM
-
2026-06-16days on market $804,010 Active 21 DOM
-
2026-06-15days on market $804,010 Active 20 DOM
-
2026-06-13days on market $804,010 Active 18 DOM
-
2026-06-09days on market $804,010 Active 14 DOM
-
2026-06-08days on market $804,010 Active 13 DOM
-
2026-06-07days on market $804,010 Active 12 DOM
-
2026-06-04days on market $804,010 Active 9 DOM
-
2026-06-03days on market $804,010 Active 8 DOM
-
2026-06-02days on market $804,010 Active 7 DOM
-
2026-06-01days on market $804,010 Active 6 DOM
-
2026-05-31days on market $804,010 Active 5 DOM
ⓘ Source: listings_history table (triggers on properties + properties_extension) + one-shot
backfill from property_details.listing_events for pre-trigger history.
Nearby sold comps map
Loading sold comps map…
Walkable amenities ~0.75 mi
Loading nearby amenities…
Taxation est. · year 1
- Rental income
- $111,780
- − Mortgage interest
- −$45,037
- − Property taxes
- −$12,060
- − Insurance
- −$4,020
- − Repairs & maintenance
- −$8,942
- − Management
- −$8,942
- − Depreciation
- −$23,389
- Taxable income
- $9,389
- Est. tax owed @ 24.0%
- −$2,253
- After-tax cash flow
- $19,377/yr
For passive investors: Depreciation is non-cash, so a rental often shows a tax loss while cash-flowing — sheltering income. Rental losses are passive: they offset passive income freely, and up to $25,000/yr can offset ordinary (W-2) income if you actively participate and your MAGI is under $100k (phasing out to $0 by $150k); unused losses carry forward. On sale, claimed depreciation is recaptured at up to 25%, and gains may owe capital-gains tax (a 1031 exchange can defer both). Figures are a year-1 estimate at your 24.0% rate — not tax advice; consult a CPA.
Condition & rehab AI · 2 photos
This multi-family property requires extensive repairs and maintenance, including a major roof repair, exterior siding and paint, landscaping, and fencing. Significant value can be added through these improvements, making it a good investment opportunity.
Repairs flagged
- Major roof — The independent aerial image shows extensive roof damage and missing shingles.
- Major exterior siding — The independent aerial image shows extensive damage to the exterior siding.
- Major exterior paint — The independent aerial image shows extensive damage to the exterior paint.
- Major exterior landscaping — The independent aerial image shows a lack of landscaping and overgrown vegetation.
- Major exterior fencing — The independent aerial image shows a lack of fencing and exposed property boundaries.
Value-add opportunities
- Resale repair roof — A repaired roof is essential for a home's structural integrity and will significantly increase its resale value.
- Rental landscape — A well-maintained landscape and curb appeal will attract renters and increase rental value.
- Both repair exterior siding — A repaired exterior siding will improve the home's appearance and increase both resale and rental value.
- Both paint exterior — A fresh coat of paint will enhance the home's curb appeal and increase both resale and rental value.
- Both install fencing — A properly installed fence will improve privacy and security, increasing both resale and rental value.
Renovation cost estimate screening
| Repair item | Severity | Est. cost |
|---|---|---|
| roof · The independent aerial image shows extensive roof damage and missing shingles. | Major | $15,000–50,000 |
| exterior siding · The independent aerial image shows extensive damage to the exterior siding. | Major | $15,000–50,000 |
| exterior paint · The independent aerial image shows extensive damage to the exterior paint. | Major | $15,000–50,000 |
| exterior landscaping · The independent aerial image shows a lack of landscaping and overgrown vegetation. | Major | $15,000–50,000 |
| exterior fencing · The independent aerial image shows a lack of fencing and exposed property boundaries. | Major | $15,000–50,000 |
| Total estimated repair cost · 5 items | $75,000–250,000 |
Value-add ROI direction
- Resale repair roof — A repaired roof is essential for a home's structural integrity and will significantly increase its resale value. ↑
- Rental landscape — A well-maintained landscape and curb appeal will attract renters and increase rental value. ↑
- Both repair exterior siding — A repaired exterior siding will improve the home's appearance and increase both resale and rental value. ↑
- Both paint exterior — A fresh coat of paint will enhance the home's curb appeal and increase both resale and rental value. ↑
- Both install fencing — A properly installed fence will improve privacy and security, increasing both resale and rental value. ↑
ⓘ Cost ranges are severity-bucket heuristics (US national rule-of-thumb). Get contractor quotes + a written scope before underwriting a rehab budget.
Schools (NCES district)
- District
- Temecula Valley Unified
- NCES district ID
- 0600028
- Math proficiency
- 55% ▲ 1.00%
- Reading proficiency
- 69% ▲ 1.00%
- Median HH income
- $84,032
- Composite
- 57.48/100
- National rank
- #2264
- State rank
- #173 of 1400 in CA
Livability — Temecula
- Score
- 71/100
- State rank
- #225
- US rank
- #7291
Category grades
Schools grade is shown separately in the Schools card above.
Census & demographics
- Census place
- Temecula, CA
- County
- Riverside County · 2,287,001 people
- City population
- 127,079
- Metro
- Riverside-San Bernardino-Ontario, CA
- Population (ZIP)
- 5,089
- Household income
- $85,253
- Rent vs Own
- Severe rent burden
- 130.0
Population outlook (Riverside County) Hauer SSP2
- Today (2025)
- 2,664,475 people
- By 2030
- 2,802,692 · +5.2%
- By 2040
- 3,050,904 · +14.5%
- By 2050
- 3,256,783 · +22.2%
- By 2075
- 3,655,058 · +37.2%
- By 2100
- 3,766,594 · +41.4%
Race, ethnicity, and origin ACS 2023
- Neighborhood character
- Diverse neighborhood (Simpson 0.65)
- Race & ethnicity
- White 44% Hispanic / Latino 38% Two or more races 13% Asian 8% Black 3%
- Hispanic origin (detail)
- Mexican 32% Cuban 1%
- Common ancestry
- Romanian 2% Lithuanian 2% Italian 2%
- Foreign-born
- 20% · Canada, Vietnam, China
- Languages at home
- 61% English-only · Spanish 32% Tagalog/Filipino 2% Other Indo-European 2%
Political lean MEDSL · Riverside
- 2024 margin
- Toss-up / Even · D 48.0% · R 49.3% · Other 2.6%
- 2008→2024 swing
- -3.6pp toward R · 2008: 2.3pp · 2024: -1.3pp
- All cycles
- 2024: R+1.3 2020: D+8.0 2016: D+4.3 2012: R+0.4 2008: D+2.3
Not yet ingested
- Civics
- —
Market trends
- HPI YoY
- ▲ 0.13%
- Current HPI
- 343.029
- Rent YoY
- ▲ 4.60%
- Metro
- Riverside-San Bernardino-Ontario, CA
- State GDP YoY
- ▲ 3.21%
- F500 in state
- 116
Industry mix (Fortune 500 HQ in CA)
| Industry | F500 HQs | Revenue |
|---|---|---|
| Technology | 27 | $1,492B |
|
||
| Financial Services | 3 | $174B |
|
||
| Retail | 3 | $44B |
|
||
| Insurance | 3 | $26B |
|
||
| Media / Entertainment | 2 | $115B |
|
||
| Pharmaceuticals / Biotech | 2 | $62B |
|
||
Cash-flow waterfall
monthlySold comps — $/sqft
last 12 mo · ≤1 miLoading sold comps…