4734 Hendron Rd · Hendron, KY
Flood risk 1/10 · Minimal
- FEMA flood zone
- X (unshaded)
- Chance of flooding over 30 yrs
- 0.0%
- Est. flood insurance / yr
- $507 – $1,088
Fire risk 4/10 · Minor
- Est. fire insurance / yr
- $839 – $1,559
Heat risk 6/10 · Moderate
- Hot days now (above 108°F)
- 7 days/yr
- Hot days in 30 yrs
- 20 days/yr
Wind risk 3/10 · Minor
- Chance of severe wind over 30 yrs
- 6.0%
Air-quality risk 2/10 · Minimal
- Unhealthy air days now
- 1 days/yr
- Unhealthy air days in 30 yrs
- 2 days/yr
Risk factors via First Street. Map © Google.
Why this score? — see what drove the C+ grade
The composite is a weighted blend of 9 inputs, each scored 0–100. Each bar is that input's sub-score; the figure is the points it added to the 100-point composite (weight × sub-score).
- Cash flow +26.1/30.0
- DSCR +8.8/10.0
- ARV discount +7.5/15.0
- 1% rule +6.0/10.0
- Schools +4.0/10.0
- Livability +3.3/5.0
- Rent growth +2.5/5.0
- Condition / age +2.5/5.0
- Appreciation +0.0/10.0
$142,900
🖨 Deal sheet 📄 Offer letter ✓ Due diligence
Listing remarks MLS
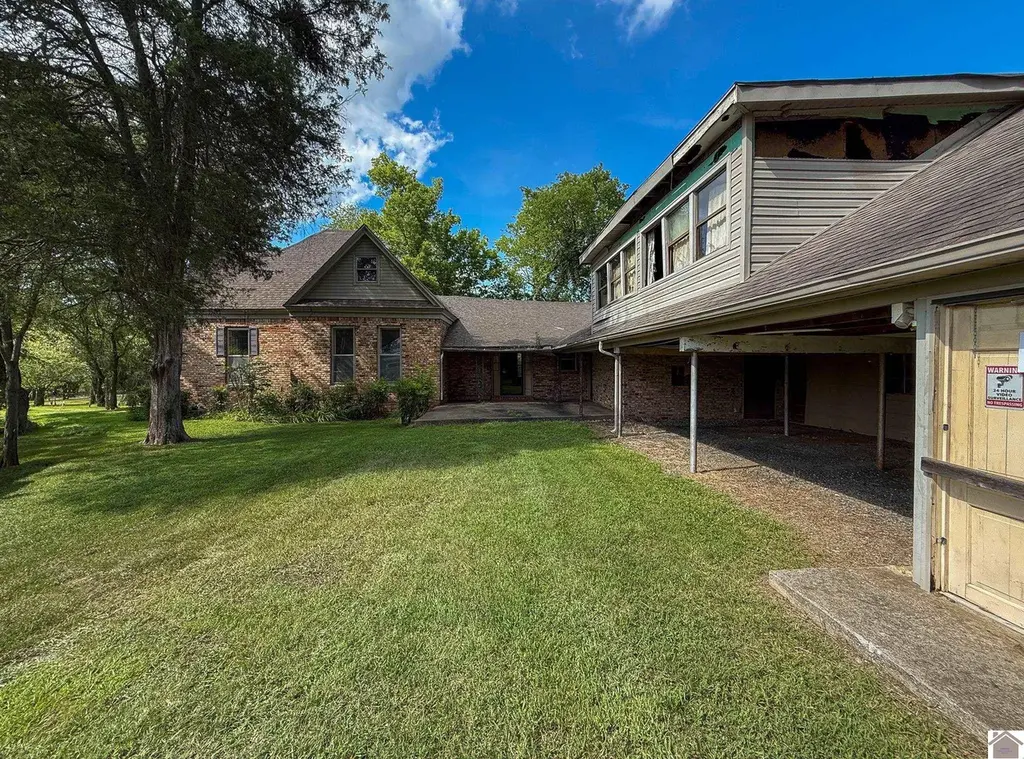
Circa 1800s Homestead on 2.61 Acres in Lone Oak - Unique Restoration Opportunity! This late 1800s homestead stands as a quiet reminder of a bygone era. Once a proud family dwelling (see family history in Assoc docs), the home has been fully gutted & now offers a blank canvas for restoration to begin. The spacious room above the 3-car carport would make a great studio apartment with a separate entrance, becoming an income-producing space. With its original bones still intact, 10' ceilings & original transom doors, this property offers a rare chance to bring history back to life with modern comforts. The surrounding acreage provides space for gardens, a mini-farm, and outbuildings, among other amenities. Restored to its former glory, or reimagine it entirely, this property is ready for a new chapter! Home & property is being sold "AS IS, " WHERE IS. "
Key facts
- 2.61 acres
- Fully gutted
- Separate entrance
Tags
Neighborhood map
What this means for you Summary
Snapshot
- This is a 4-bed/3.0-bath single-family listed at $143k.
Deal economics
- At list price, monthly cash flow is $360 ($4k/yr) — positive.
- The deal already cash-flows at list — no discount required.
- Meets the 1% rule at list price ($2k rent vs $143k).
- Recommended offer: $126k (12.0% below list) — sets the bar for market timing.
- Cap rate 9.3% vs local median 2.6% in Hendron — top-decile yield for the area; either an underpriced asset or a hidden risk that comps aren't pricing in. Stress-test before assuming the spread holds.
Location & tenants
- Location reads 66/100 on livability (#244 in KY) — a middle-class / working-renter tenant base. Strengths: crime A+, cost of living A+, housing A+; Watch: schools D, amenities F, commute F.
- Mccracken County (town): math 41% / reading 52% proficiency, ranked #16 of 165 in KY (top 10%) — families likely to look elsewhere, expect single-tenant / working-renter base with shorter leases.
- Market conditions: 268 active listings in the ZIP; 187 units permitted in McCracken County in 2024 (104 in 5+ unit buildings).
Forward outlook
- Local home prices are declining (-3.0%/yr); year-one equity from $988 of loan paydown is wiped out by about $4k of value loss. Plan a longer hold.
- McCracken County population projected to shrink 9% by 2050 — rents likely to lag national; underwrite the cash flow, not the appreciation.
Negotiation context
- It's been on market 304 days — a 12% lower offer ($126k) is reasonable based on typical stale-listing flexibility.
Risks & watch-outs
- Climate carrying-cost: extreme-heat days projected 7→20/yr by 2055 (HVAC capex compounding) — expect insurance premiums to compound above CPI over the hold.
Questions for the listing agent
- It's been on market 304 days. Have you received any prior offers? Is the seller open to a 12% concession, seller financing, or rate buy-down credit?
- Why hasn't it sold? Are there any deal-killer items the seller is aware of (foundation, flood, title, zoning, code violations)?
- Is there a deadline driving the sale (1031 exchange, divorce, estate, relocation)? That informs how much negotiation room exists.
- Schools are D-rated, which usually means shorter tenancies and higher turnover. Who's the typical renter profile here, and what's been the actual vacancy rate?
- What's the average days-on-market for RENTAL listings here right now (not sales)? A rising rental-DOM trend means longer vacancies and softer asking-rent achievability than the comps imply.
- What's the recent tenant-quality profile in this submarket — average credit score on applications, eviction rate, late-payment / NSF rate, and stable-employment percentage? A property-management company in the area should have these aggregated.
- How much new for-sale + rental construction is in the pipeline within 1–3 miles? Heavy new supply typically softens prices + rents 12–24 months out; constrained supply supports both.
Investment metrics
- 1% rule
- 1.10% ✓
- Cap rate
- 9.32%
- Cash-on-cash
- 10.81%
- DSCR
- 1.48
- GRM
- 7.6
CMA / ARV
- ARV (median comp)
- $533,817
- List price
- $142,900
- Delta
- -73.23%
- Verdict
- UNDERPRICED
- Comps
- 20 within 1.0 mi
Show comp detail 7 sales within ~0.75 mi
| Address | Dist | Beds/Ba | Sqft | Sold | Price | $/sf | Match |
|---|---|---|---|---|---|---|---|
| 160 Overlook Dr | 0.20mi | 4/4.0 | 3,646 (+1%) | 1mo | $780,000 | $214 | 84 |
| 475 Forest Rdg | 0.25mi | 4/3.0 | 3,527 (-2%) | 6mo | $575,000 | $163 | 80 |
| 1067 Lakeview Dr | 0.71mi | 4/3.0 | 3,377 (-6%) | 8mo | $425,000 | $126 | 50 |
| 170 Spring Valley Cv | 0.64mi | 3/2.5 (-1) | 3,473 (-4%) | 12mo | $480,000 | $138 | 47 |
| 1165 Bleich Rd | 0.34mi | 5/2.0 (+1) | 3,068 (-15%) | 8mo | $112,000 | $37 | 44 |
| 135 Spring Vly | 0.63mi | 4/3.5 | 3,361 (-7%) | 18mo | $460,000 | $137 | 42 |
| 1055 Lakeview Dr | 0.73mi | 3/3.0 (-1) | 3,300 (-8%) | 12mo | $399,900 | $121 | 37 |
Match score weights: distance 35% · size 25% · config 20% · recency 20%. Top-matched comps best support the ARV.
Projected returns pro-forma
-3.0% appreciation · 3.0% rent growth · sell at horizon
- IRR
- -0.2%
- Equity multiple
- 0.99×
- Total profit
- $-252
- Equity at exit
- $21,307
- IRR
- 9.5%
- Equity multiple
- 1.73×
- Total profit
- $29,151
- Equity at exit
- $12,355
Cash invested: $40,012 (down + closing). Projections, not guarantees.
Landlord ↔ Tenant lean methodology
- Overall (STATE)
- 83 Strongly Landlord-Friendly
- State Kentucky
- 83 Strongly Landlord-Friendly · R+16
- County
- — inherits STATE
- City
- — inherits STATE
ZIP-level market 42003
- Home prices YoY
- -19.8%
- Active inventory
- 268
- Price-to-rent
- 7.6×
Monthly cashflow live
- Estimated rent
- $1,567 medium interval (Pro) →
- Mortgage (P&I)
- −$749
- Tax from tax record
- −$69 /mo · $823/yr
- Insurance
- −$60
- HOA
- −$0
- Vacancy / Maint / Mgmt
- −$329
- Net cashflow
- $360
Break-even live
UW: 25.0% down · 7.5% · 30yr · 1.5% tax · 5.0% vac · 8.0% maint · 8.0% mgmt
Financing live
Cash to close
- Down payment
- $35,725
- Closing costs
- $4,287
- Reserves months
- —
- Total cash needed
- —
Loan-product check · same deal, 3 products live
Conventional
25% down · 7.5% · 30yr
- Down + closing
- —
- Monthly P&I
- —
- Monthly cashflow
- —
- DSCR
- —
- Eligible?
- —
Personal DTI + credit; lowest rate.
DSCR
20% down · 8.5% · 30yr
- Down + closing
- —
- Monthly P&I
- —
- Monthly cashflow
- —
- DSCR
- —
- Eligible?
- —
No personal income docs; deal must DSCR.
Hard money
10% down · 12.0% · 12mo
- Down + closing
- —
- Monthly P&I
- —
- Monthly cashflow
- —
- DSCR
- —
- Eligible?
- —
Short-term bridge; refi at stabilization.
Listing history 19 events
-
2026-06-19days on market $142,900 Active 304 DOM
-
2026-06-18days on market $142,900 Active 303 DOM
-
2026-06-17days on market $142,900 Active 302 DOM
-
2026-06-16days on market $142,900 Active 301 DOM
-
2026-06-15days on market $142,900 Active 300 DOM
-
2026-06-14days on market $142,900 Active 298 DOM
-
2026-06-12days on market $142,900 Active 297 DOM
-
2026-06-09days on market $142,900 Active 294 DOM
-
2026-06-08days on market $142,900 Active 293 DOM
-
2026-06-07days on market $142,900 Active 292 DOM
-
2026-06-05days on market $142,900 Active 289 DOM
-
2026-06-03days on market $142,900 Active 288 DOM
-
2026-06-03price $142,900 Active 287 DOM
-
2026-06-02days on market $149,900 Active 287 DOM
-
2026-06-01days on market $149,900 Active 286 DOM
-
2026-05-31days on market $149,900 Active 285 DOM
-
2026-05-30days on market $149,900 Active 284 DOM
-
2025-12-24price $149,900 894-char remark
Show marketing remark (894 chars)
Circa 1800s Homestead on 2.61 Acres in Lone Oak - Unique Restoration Opportunity! This late 1800s homestead stands as a quiet reminder of a bygone era. Once a proud family dwelling (see family history in Assoc docs), the home has been fully gutted & now offers a blank canvas for restoration to begin. The spacious room above the 3-car carport would make a great studio apartment with a separate entrance, becoming an income-producing space. With its original bones still intact, 10' ceilings & original transom doors, this property offers a rare chance to bring history back to life with modern comforts. The surrounding acreage provides space for gardens, a mini-farm, and outbuildings, among other amenities. Restored to its former glory, or reimagine it entirely, this property is ready for a new chapter! Home & property is being sold "AS IS, " WHERE IS. "
-
2025-08-19$169,000 Active 894-char remark
Show marketing remark (894 chars)
Circa 1800s Homestead on 2.61 Acres in Lone Oak - Unique Restoration Opportunity! This late 1800s homestead stands as a quiet reminder of a bygone era. Once a proud family dwelling (see family history in Assoc docs), the home has been fully gutted & now offers a blank canvas for restoration to begin. The spacious room above the 3-car carport would make a great studio apartment with a separate entrance, becoming an income-producing space. With its original bones still intact, 10' ceilings & original transom doors, this property offers a rare chance to bring history back to life with modern comforts. The surrounding acreage provides space for gardens, a mini-farm, and outbuildings, among other amenities. Restored to its former glory, or reimagine it entirely, this property is ready for a new chapter! Home & property is being sold "AS IS, " WHERE IS. "
ⓘ Source: listings_history table (triggers on properties + properties_extension) + one-shot
backfill from property_details.listing_events for pre-trigger history.
Tax reassessment forecast KY · Resets to sale price
- Current annual tax
- $823 · $69/mo
- Projected year-2 tax
- $1,229 · $102/mo
- Expected delta
- +$406/yr (+$34/mo · 49.4%)
ⓘ Screening estimate from a state-policy table — verify with the county assessor before closing.
Climate risk First Street
- Flood 1/10 Low FEMA zone X (unshaded) · 0% chance over 30 yrs
- Wildfire 4/10 Moderate
- Heat 6/10 Major 7 d/yr ≥108°F today · 20 d/yr by 30 yrs out
- Wind 3/10 Moderate 6% chance of damaging wind over 30 yrs
- Air quality 2/10 Low 1 unhealthy d/yr today · 2 by 30 yrs out
Nearby sold comps map
Loading sold comps map…
Walkable amenities ~0.75 mi
Loading nearby amenities…
Taxation est. · year 1
- Rental income
- $18,802
- − Mortgage interest
- −$8,005
- − Property taxes
- −$823
- − Insurance
- −$714
- − Repairs & maintenance
- −$1,504
- − Management
- −$1,504
- − Depreciation
- −$4,157
- Taxable income
- $2,095
- Est. tax owed @ 24.0%
- −$503
- After-tax cash flow
- $3,821/yr
For passive investors: Depreciation is non-cash, so a rental often shows a tax loss while cash-flowing — sheltering income. Rental losses are passive: they offset passive income freely, and up to $25,000/yr can offset ordinary (W-2) income if you actively participate and your MAGI is under $100k (phasing out to $0 by $150k); unused losses carry forward. On sale, claimed depreciation is recaptured at up to 25%, and gains may owe capital-gains tax (a 1031 exchange can defer both). Figures are a year-1 estimate at your 24.0% rate — not tax advice; consult a CPA.
Schools (NCES district)
- District
- Mccracken County
- NCES district ID
- 2103960
- Math proficiency
- 41% ▼ -15.00%
- Reading proficiency
- 52% ▼ -15.00%
- Median HH income
- $49,976
- Composite
- 39.84/100
- National rank
- #3871
- State rank
- #16 of 165 in KY
Livability — Hendron
- Score
- 66/100
- State rank
- #244
- US rank
- #12105
Category grades
Schools grade is shown separately in the Schools card above.
Census & demographics
- Population (ZIP)
- 29,384
Population outlook (McCracken County) Hauer SSP2
- Today (2025)
- 64,237 people
- By 2030
- 63,468 · -1.2%
- By 2040
- 61,221 · -4.7%
- By 2050
- 58,432 · -9.0%
- By 2075
- 52,668 · -18.0%
- By 2100
- 44,517 · -30.7%
Race, ethnicity, and origin ACS 2023
- Neighborhood character
- Predominantly White (83%)
- Race & ethnicity
- White 83% Black 9% Two or more races 5% Hispanic / Latino 4%
- Common ancestry
- Slovak 2% Lithuanian 1% Serbian 1%
- Foreign-born
- 2% · Canada
- Languages at home
- 97% English-only · Spanish 1% Other Asian/Pacific 1%
Political lean MEDSL · McCracken
- 2024 margin
- Solid R (+34.9) · D 31.9% · R 66.8% · Other 1.2%
- 2008→2024 swing
- -9.7pp toward R · 2008: -25.2pp · 2024: -34.9pp
- All cycles
- 2024: R+34.9 2020: R+31.7 2016: R+37.2 2012: R+32.5 2008: R+25.2
Not yet ingested
- Civics
- —
Market trends
- HPI YoY
- ▼ -58.31%
- Current HPI
- 236.3013
- Rent YoY
- —
- Metro
- —
- State GDP YoY
- ▲ 1.81%
- F500 in state
- 4
Industry mix (Fortune 500 HQ in KY)
| Industry | F500 HQs | Revenue |
|---|---|---|
| Healthcare | 1 | $118B |
|
||
| Food / Beverage | 1 | $7B |
|
||
Price history
-11.3% since first listed2 events — show timeline
- 2025-12-24 Price Changed $149,900 WKRMLS
- 2025-08-19 Listed $169,000 WKRMLS
Property tax history
+1.7%/yrLatest (2025): $823 · -1.8% YoY. Source: county tax records.
Cash-flow waterfall
monthlySold comps — $/sqft
last 12 mo · ≤1 miLoading sold comps…