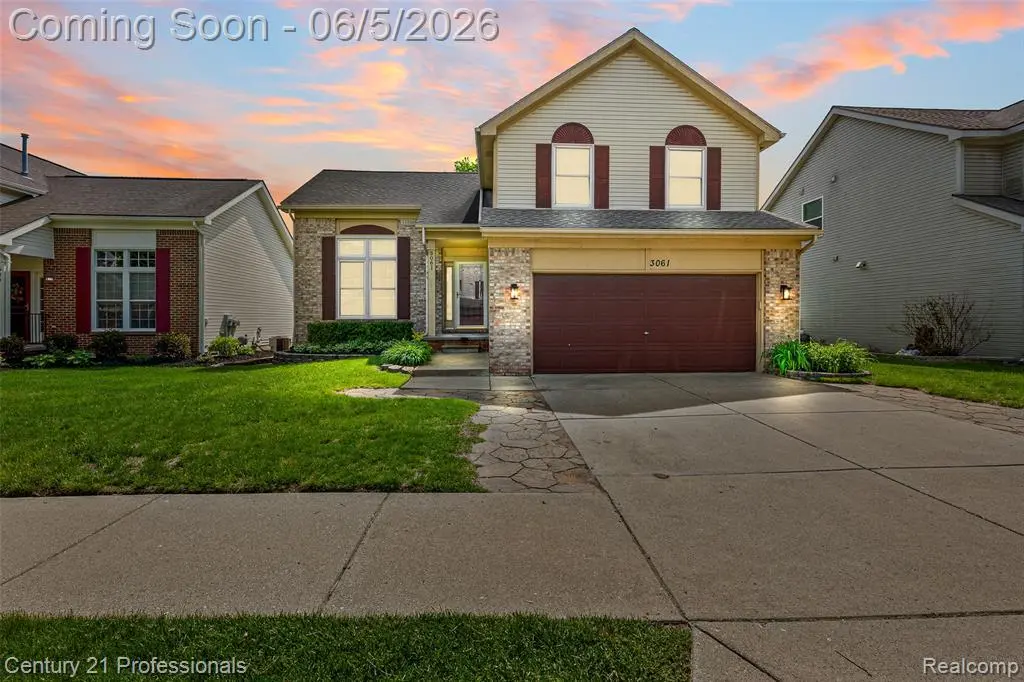
3061 Talon Cir · Auburn Hills, MI
Flood risk 1/10 · Minimal
- FEMA flood zone
- X (unshaded)
- Chance of flooding over 30 yrs
- 0.0%
- Est. flood insurance / yr
- $473 – $860
Fire risk 1/10 · Minimal
- Est. fire insurance / yr
- $784 – $1,456
Heat risk 2/10 · Minimal
- Hot days now (above 96°F)
- 7 days/yr
- Hot days in 30 yrs
- 15 days/yr
Wind risk 2/10 · Minimal
- Chance of severe wind over 30 yrs
- —
Air-quality risk 3/10 · Minor
- Unhealthy air days now
- 2 days/yr
- Unhealthy air days in 30 yrs
- 5 days/yr
Risk factors via First Street. Map © Google.
Why this score? — see what drove the D grade
The composite is a weighted blend of 9 inputs, each scored 0–100. Each bar is that input's sub-score; the figure is the points it added to the 100-point composite (weight × sub-score).
- Cash flow +11.5/30.0
- ARV discount +7.5/15.0
- Schools +5.1/10.0
- 1% rule +3.9/10.0
- Livability +3.8/5.0
- DSCR +3.4/10.0
- Rent growth +2.5/5.0
- Condition / age +2.5/5.0
- Appreciation +0.0/10.0
$370,000
🖨 Deal sheet 📄 Offer letter ✓ Due diligence
Listing remarks MLS
Contemporary Flair with Arched windows & Vaulted ceilings, Open and softly flowing throughout this entire home! - Great size Kitchen with pantry, ample cupboards and additional counter top seating. Dining room overlooks Large Family Room walk out with centered gas fireplace affording warmth and comfort on those cold winter nights. Separate Living Room area offers additional entertaining for those Family gatherings. Master Suite complete with full bath, walk in closet, and separate dressing table area. Over 32,000 of recent improvements to include Roof, Windows Central Air, Gas Fireplace, Carpeting, Stainless Appliances & Garage Door Opener. Good sized Fenced Yard. Mature Tree lined sidewalks throughout subdivision for those evening Family walks. Bald Mountain Recreation surrounding this area affording the feel of your short vacation getaway! You will be proud to call this home!
Key facts
- 6,098 sq ft lot
- 2 garage spots
- Built 1997
Property features AI
Finance
- Other: Pets allowed; Subdivision: Orion Woods Condo; Property located on the east side of the street in Orion Township (Lake Orion mail city)
- HOA & community: Homeowners association with a monthly fee of $80; Association phone available
Exterior
- Parking: Attached 2-car garage (approx. 21 x 20)
- Utilities: Public water; Natural gas supply; Gas water heater; Public paved street access
- Home design: Residential site condo; 2-story structure; Built in 1997
- Construction: Vinyl siding; Basement foundation
- Exterior features: Fenced yard; Patio; Porch
Interior
- Kitchen: Kitchen at entry level (approx. 12 x 11) with laminate flooring; Appliances included: Dishwasher, Disposal, Microwave, Range/Oven, Refrigerator
- Bedrooms: Primary bedroom on the second floor (approx. 15 x 13) with carpet; Second bedroom on the second floor (approx. 12 x 12) with carpet; Third bedroom on the second floor (approx. 18 wide) with carpet
- Flooring: Carpet in bedrooms; Laminate in dining room, kitchen, family room, living room and laundry; Ceramic flooring in bathrooms and lavatory
- Bathrooms: Two full bathrooms; One half bathroom (total of three baths/lavatories); Main second-floor bathroom approx. 11 x 6 with ceramic flooring; Second bathroom approx. 11 x 5 with ceramic flooring; Entry-level lavatory approx. 4 x 5 with ceramic flooring
- Heating & cooling: Forced air heating (natural gas); Central air conditioning; Ceiling fan(s)
- Interior features: Fireplace (family room) — gas; Total of 11 rooms; Unfinished basement
- Laundry & utility: Laundry room at entry level (approx. 8 x 7) with laminate flooring; Washer and Dryer included; Gas water heater
Neighborhood map
What this means for you Summary
Snapshot
- This is a 3-bed/2.5-bath condo listed at $370k.
Deal economics
- At list price, monthly cash flow is $-122 ($-1k/yr) — negative.
- To cash-flow at today's rent, offer at most $348k (5.8% below list).
- To meet the 1% rule (rent ≥ 1% of price), the offer needs to be $330k (10.7% below list).
- Recommended offer: $330k (10.7% below list) — sets the bar for 1% rule.
- Cap rate 5.9% vs local median 4.3% in Auburn Hills — top-decile yield for the area; either an underpriced asset or a hidden risk that comps aren't pricing in. Stress-test before assuming the spread holds.
Location & tenants
- Location reads 76/100 on livability (#151 in MI, #3,766 nationally) — a middle-class / working-renter tenant base. Strengths: commute A+, cost of living A+, housing A+; Watch: crime D+, schools D, amenities F.
- Lake Orion Community Schools (suburban): math 49% / reading 64% proficiency, ranked #45 of 540 in MI (top 8%) — acceptable for families but not a draw, mixed tenant base, ~2y average lease; only 16% free/reduced lunch — higher-income household profile.
- Market conditions: 82 active listings in the ZIP; 2 comparable units currently listed for rent nearby; 2,614 units permitted in Oakland County in 2024 (721 in 5+ unit buildings).
Forward outlook
- Local home prices are declining (-3.0%/yr); year-one equity from $3k of loan paydown is wiped out by about $11k of value loss. Plan a longer hold.
- Oakland County population projected at +10% by 2050 — modest demand growth; plan on rents tracking national, not racing it.
Negotiation context
- Only 4 days on market — expect competitive offers; lowballing is unlikely to land.
- 5 sale attempts since 14y ago; this cycle's ask is 15645% above the opening price — seller raised mid-cycle; expect resistance to lowballs.
- Current owner paid $246k; list at $370k implies a 50% gain — meaningful room to come down on a strong offer.
Questions for the listing agent
- What do current leases actually rent for vs. the listed asking? Can we see a recent rent roll and the last 12 months of T-12 income?
- What does the HOA fee cover, when was the last increase, and are there any pending special assessments or reserve-fund shortfalls?
- Any open or pending special assessments — roof, HVAC, plumbing, elevator, façade? What's the per-unit balance and payoff schedule, and is the seller paying it off at close or rolling it to the buyer?
- Is there a deadline driving the sale (1031 exchange, divorce, estate, relocation)? That informs how much negotiation room exists.
- Schools are D-rated, which usually means shorter tenancies and higher turnover. Who's the typical renter profile here, and what's been the actual vacancy rate?
- Crime grade is D in this area — have there been break-ins, vandalism, or insurance claims at this property in the last 3 years? What carrier currently insures it and at what premium?
- The area grade is low — what's the realistic commute time and amenity access for the typical tenant pool here? Any planned neighborhood developments (good or bad) we should know about?
- What's the average days-on-market for RENTAL listings here right now (not sales)? A rising rental-DOM trend means longer vacancies and softer asking-rent achievability than the comps imply.
- What's the recent tenant-quality profile in this submarket — average credit score on applications, eviction rate, late-payment / NSF rate, and stable-employment percentage? A property-management company in the area should have these aggregated.
- How much new apartment / multifamily construction is in the pipeline within 1–3 miles? Heavy new supply (>2% of stock underway) typically softens rents 12–24 months out; light construction supports rent growth.
Investment metrics
- 1% rule
- 0.89% ✗
- Cap rate
- 5.90%
- Cash-on-cash
- -1.41%
- DSCR
- 0.94
- GRM
- 9.3
CMA / ARV
No comps found within radius.
Projected returns pro-forma
-3.0% appreciation · 3.0% rent growth · sell at horizon
- IRR
- -18.6%
- Equity multiple
- 0.35×
- Total profit
- $-67,552
- Equity at exit
- $55,168
- IRR
- -10.9%
- Equity multiple
- 0.34×
- Total profit
- $-68,168
- Equity at exit
- $31,991
Cash invested: $103,600 (down + closing). Projections, not guarantees.
Landlord ↔ Tenant lean methodology
- Overall (STATE)
- 62 Landlord-Friendly
- State Michigan
- 62 Landlord-Friendly · EVEN
- County
- — inherits STATE
- City
- — inherits STATE
ZIP-level market 48360
- Active inventory
- 82
- Price-to-rent
- 9.3×
Monthly cashflow live
- Estimated rent
- $3,304 medium interval (Pro) →
- Mortgage (P&I)
- −$1,940
- Tax from tax record
- −$557 /mo · $6,690/yr
- Insurance
- −$154
- HOA
- −$80
- Vacancy / Maint / Mgmt
- −$694
- Net cashflow
- $-122
Break-even live
UW: 25.0% down · 7.5% · 30yr · 1.5% tax · 5.0% vac · 8.0% maint · 8.0% mgmt
Financing live
Cash to close
- Down payment
- $92,500
- Closing costs
- $11,100
- Reserves months
- —
- Total cash needed
- —
Loan-product check · same deal, 3 products live
Conventional
25% down · 7.5% · 30yr
- Down + closing
- —
- Monthly P&I
- —
- Monthly cashflow
- —
- DSCR
- —
- Eligible?
- —
Personal DTI + credit; lowest rate.
DSCR
20% down · 8.5% · 30yr
- Down + closing
- —
- Monthly P&I
- —
- Monthly cashflow
- —
- DSCR
- —
- Eligible?
- —
No personal income docs; deal must DSCR.
Hard money
10% down · 12.0% · 12mo
- Down + closing
- —
- Monthly P&I
- —
- Monthly cashflow
- —
- DSCR
- —
- Eligible?
- —
Short-term bridge; refi at stabilization.
Rent comps 2 comps
| Address | Beds | Baths | Sqft | Rent | $/sqft | DOM | Units | Dist |
|---|---|---|---|---|---|---|---|---|
| 4100 Heron Springs Blvd Orion Twp, MI | 2.0–3.0 | 2.0–2.5 | 1914 | $3,535 | $1.85 | 1d | 8 | 0.91mi |
| 1113 Lark St Unit 41 Lake Orion, MI | 2.0 | 2.0 | 1730 | $3,000 | $1.73 | 1d | 1 | 1.26mi |
HOA detail condo
- Monthly dues
- $80 · $960/yr
- Likely covers
- gas
- Assessments
- None detected in remarks — confirm with the listing agent.
Listing history 5 events
-
2026-06-08statusdays on market $370,000 Pending 4 DOM
-
2026-06-07statusdays on market $370,000 Active 3 DOM
-
2026-06-04days on market $370,000 Coming Soon 2 DOM
-
2026-06-03remarks 699-char remark
-
2026-06-03$370,000 Coming Soon 1 DOM
ⓘ Source: listings_history table (triggers on properties + properties_extension) + one-shot
backfill from property_details.listing_events for pre-trigger history.
Tax reassessment forecast MI · Partial reset (capped growth)
- Current annual tax
- $6,690 · $557/mo
- Projected year-2 tax
- $6,690 · $557/mo
- Expected delta
- $0/yr ($0/mo · 0.0%)
ⓘ Screening estimate from a state-policy table — verify with the county assessor before closing.
Climate risk First Street
- Flood 1/10 Low FEMA zone X (unshaded) · 0% chance over 30 yrs
- Wildfire 1/10 Low
- Heat 2/10 Low 7 d/yr ≥96°F today · 15 d/yr by 30 yrs out
- Wind 2/10 Low
- Air quality 3/10 Moderate 2 unhealthy d/yr today · 5 by 30 yrs out
Nearby sold comps map
Loading sold comps map…
Walkable amenities ~0.75 mi
Loading nearby amenities…
Taxation est. · year 1
- Rental income
- $39,649
- − Mortgage interest
- −$20,726
- − Property taxes
- −$6,690
- − Insurance
- −$1,850
- − Repairs & maintenance
- −$3,172
- − Management
- −$3,172
- − HOA
- −$960
- − Depreciation
- −$10,764
- Taxable loss
- −$7,684
- Est. tax savings @ 24.0%
- +$1,844
- After-tax cash flow
- $383/yr
For passive investors: Depreciation is non-cash, so a rental often shows a tax loss while cash-flowing — sheltering income. Rental losses are passive: they offset passive income freely, and up to $25,000/yr can offset ordinary (W-2) income if you actively participate and your MAGI is under $100k (phasing out to $0 by $150k); unused losses carry forward. On sale, claimed depreciation is recaptured at up to 25%, and gains may owe capital-gains tax (a 1031 exchange can defer both). Figures are a year-1 estimate at your 24.0% rate — not tax advice; consult a CPA.
Schools (NCES district)
- District
- Lake Orion Community Schools
- NCES district ID
- 2620730
- Math proficiency
- 49% ▼ -10.00%
- Reading proficiency
- 64% ▼ -10.00%
- Median HH income
- $82,396
- Composite
- 51.21/100
- National rank
- #1755
- State rank
- #45 of 540 in MI
Livability — Auburn Hills
- Score
- 76/100
- State rank
- #151
- US rank
- #3766
Category grades
Schools grade is shown separately in the Schools card above.
Census & demographics
- City population
- 24,514
- Population (ZIP)
- 12,250
Population outlook (Oakland County) Hauer SSP2
- Today (2025)
- 1,335,747 people
- By 2030
- 1,375,100 · +2.9%
- By 2040
- 1,435,385 · +7.5%
- By 2050
- 1,469,250 · +10.0%
- By 2075
- 1,531,946 · +14.7%
- By 2100
- 1,450,485 · +8.6%
Race, ethnicity, and origin ACS 2023
- Neighborhood character
- Predominantly White (78%)
- Race & ethnicity
- White 78% Two or more races 8% Hispanic / Latino 8% Asian 8% Black 1%
- Hispanic origin (detail)
- Mexican 3% Puerto Rican 4%
- Common ancestry
- Romanian 12% Lithuanian 4% Slovak 4%
- Foreign-born
- 11% · Canada, China
- Languages at home
- 88% English-only · Other Asian/Pacific 3% Other Indo-European 3% Spanish 3%
Political lean MEDSL · Oakland
- 2024 margin
- D (+10.6) · D 54.4% · R 43.8% · Other 1.9%
- 2008→2024 swing
- -3.9pp toward R · 2008: 14.5pp · 2024: 10.6pp
- All cycles
- 2024: D+10.6 2020: D+14.1 2016: D+8.1 2012: D+8.1 2008: D+14.5
Not yet ingested
- Civics
- —
Market trends
- HPI YoY
- ▼ -226.18%
- Current HPI
- 180.3844
- Rent YoY
- —
- Metro
- —
- State GDP YoY
- ▲ 1.37%
- F500 in state
- 28
Industry mix (Fortune 500 HQ in MI)
| Industry | F500 HQs | Revenue |
|---|---|---|
| Automotive Parts | 3 | $48B |
|
||
| Automotive | 2 | $372B |
|
||
| Chemicals | 1 | $45B |
|
||
| Automotive Retail | 1 | $29B |
|
||
| Healthcare / Medical Devices | 1 | $23B |
|
||
| Automotive Technology | 1 | $20B |
|
||
Price history
+124.4% since first listed16 events — show timeline
- 2026-06-03 Coming Soon $370,000 MiRealSource-MiMLS
- 2024-12-22 Rental Removed $2,350 TURBOTENANT
- 2024-12-03 Listed for Rent $2,350 TURBOTENANT
- 2019-04-17 Sold (Public Records) $246,000 Public Records
- 2019-04-11 Sold (MLS) $246,000 MiRealSource-MiMLS
- 2019-04-11 Sold (MLS) $246,000 REALCOMP
- 2019-02-18 Pending — MiRealSource-MiMLS
- 2019-02-18 Pending — REALCOMP
- 2019-02-15 Listed $249,900 MiRealSource-MiMLS
- 2019-02-15 Listed $249,900 REALCOMP
- 2012-11-09 Sold (MLS) $164,500 REALCOMP
- 2012-11-09 Sold (MLS) $164,500 MiRealSource-MiMLS
- 2012-09-27 Listing Removed — REALCOMP
- 2012-09-27 Listing Removed — MiRealSource-MiMLS
- 2012-09-23 Listed $164,900 REALCOMP
- 2012-09-22 Listed $164,900 MiRealSource-MiMLS
Property tax history
+10.6%/yrLatest (2025): $6,690 · +54.6% YoY. Source: county tax records.
Cash-flow waterfall
monthlySold comps — $/sqft
last 12 mo · ≤1 miLoading sold comps…