 5-Plex
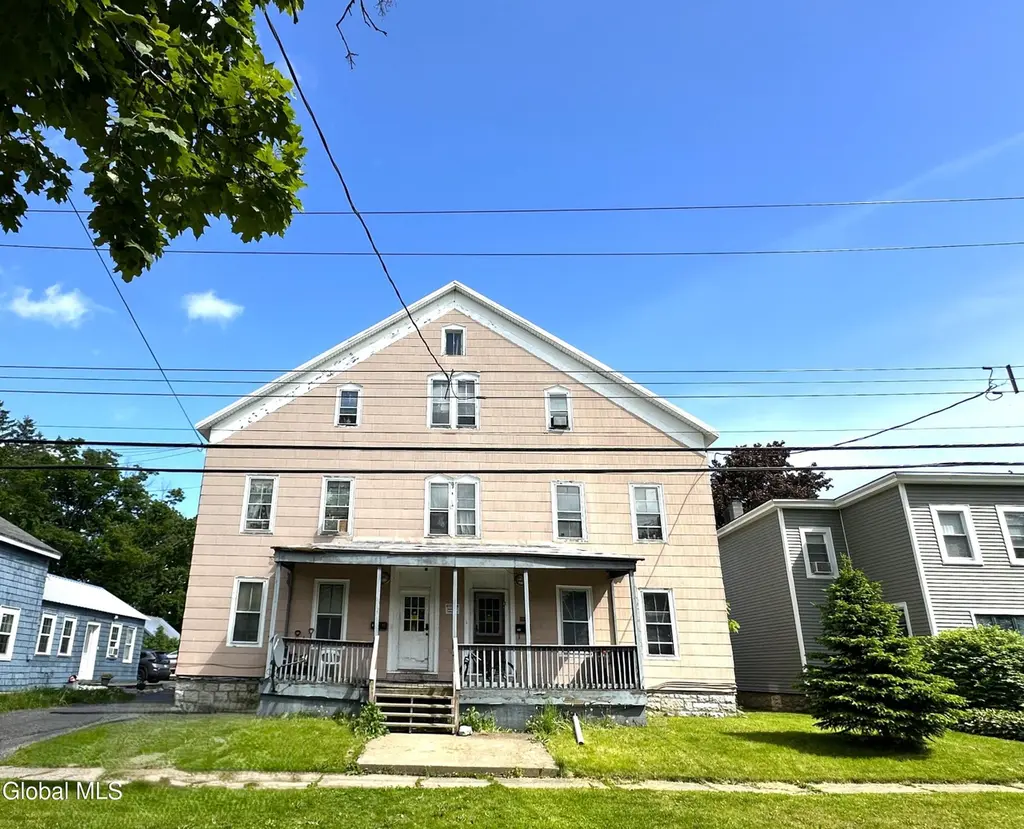
71 Walnut St · Canajoharie, NY
Flood risk 1/10 · Minimal
- FEMA flood zone
- X (unshaded)
- Chance of flooding over 30 yrs
- 0.0%
- Est. flood insurance / yr
- $473 – $860
Fire risk 1/10 · Minimal
- Est. fire insurance / yr
- $691 – $1,283
Heat risk 3/10 · Minor
- Hot days now (above 96°F)
- 7 days/yr
- Hot days in 30 yrs
- 16 days/yr
Wind risk 2/10 · Minimal
- Chance of severe wind over 30 yrs
- 2.0%
Air-quality risk 1/10 · Minimal
- Unhealthy air days now
- 0 days/yr
- Unhealthy air days in 30 yrs
- 0 days/yr
Risk factors via First Street. Map © Google.
Why this score? — see what drove the B+ grade
The composite is a weighted blend of 9 inputs, each scored 0–100. Each bar is that input's sub-score; the figure is the points it added to the 100-point composite (weight × sub-score).
- Cash flow +30.0/30.0
- 1% rule +10.0/10.0
- DSCR +10.0/10.0
- Appreciation +9.7/10.0
- ARV discount +7.5/15.0
- Schools +4.1/10.0
- Livability +3.5/5.0
- Rent growth +2.5/5.0
- Condition / age +2.5/5.0
$150,000
🖨 Deal sheet (PDF) 📄 Offer letter ✓ Due diligence
Multi-family units
County records classify this as Multi-Family (2-4 Unit). Listing-text estimate: 5 units. estimate disagrees with records
Listing remarks
Opportunity awaits with this large 15-room approved SRO (single room occupancy) property located on a residential street in the Village of Canajoharie. Offering strong income potential, the property currently generates weekly and monthly rental income with opportunity for increased returns. The property includes five bathrooms, two kitchens and two laundry areas with washers and dryers, providing convenience and functionality for residents. Situated within walking distance to downtown shops, restaurants, and everyday amenities, the home offers both accessibility and a neighborhood setting. Off-street parking adds additional appeal, while the size and configuration create flexibility for inv
Key facts
- Two kitchens
- Two laundry areas
- Off-street parking
Tags
Property features AI
Finance
- Financial info: Annual taxes reported
Exterior
- Parking: Total parking for 6 vehicles
- Utilities: Public water; Public sewer
- Home design: Multi-family property
- Construction: Asbestos construction material
- Exterior features: Lot approximately 0.19 acre
Interior
- Bedrooms: Fifteen 1-bedroom units (each unit listed as 1 bedroom)
- Bathrooms: Five full bathrooms
- Heating & cooling: Forced air heating; Natural gas heating
- Interior features: Full basement
Neighborhood map
What this means for you Summary
Snapshot
- This is a 5 × 3-bed/?-bath units multifamily listed at $150k.
Deal economics
- At list price, monthly cash flow is $3k ($31k/yr) — positive. Per door: $516/mo.
- The deal already cash-flows at list — no discount required.
- Meets the 1% rule at list price ($5k rent vs $150k).
- Recommended offer: $148k (1.5% below list) — sets the bar for market timing.
Location & tenants
- Location reads 69/100 on livability (#510 in NY) — a middle-class / working-renter tenant base. Strengths: cost of living A+, health & safety A+, crime A-; Watch: amenities F, commute F, employment F.
- Canajoharie Central School District (town): math 38% / reading 59% proficiency, ranked #414 of 590 in NY (top 70%) — families likely to look elsewhere, expect single-tenant / working-renter base with shorter leases.
- Market conditions: 31 active listings in the ZIP; 210 units permitted in Montgomery County in 2024 (168 in 5+ unit buildings).
Forward outlook
- In year one you build about $15k of equity ($1k loan paydown + $14k appreciation (9.5% local appreciation)).
- Montgomery County population projected at -11% by 2050 — secular population decline; favor cash flow + early exit over multi-decade hold.
- At projected returns (9.5% appreciation + 3.0% rent growth), your $42k cash investment doubles in ~1 year — after that, you're playing with house money.
- By year 3, paydown + projected appreciation supports a ~$39k cash-out refi (75% LTV) — recoverable capital for the next deal without selling this one.
Negotiation context
- It's been on market 26 days — a 2% lower offer ($148k) is reasonable based on typical stale-listing flexibility.
- 5 sale attempts since 23y ago; this cycle's ask has dropped $45k (23%) from the opening price — seller is motivated, your offer sets the floor, not the list.
- Current owner paid $90k; list at $150k implies a 67% gain — meaningful room to come down on a strong offer.
Risks & watch-outs
- Watch-outs: property tax is 4.3% of price; built in 1900 — expect roof / HVAC / electrical / plumbing capex.
Questions for the listing agent
- Can we see the unit-by-unit rent roll, current vacancy, and any below-market leases? What's the average tenancy length?
- What capital expenditures (roof, boiler, parking lot, exteriors) have been made in the last 5 years, and what's planned in the next 2?
- Built in 1900 — when were the roof, HVAC, electrical panel, plumbing, and water heater last replaced?
- Property tax is high relative to price — has the assessment been appealed recently, and will the sale trigger a re-assessment?
- Is there a deadline driving the sale (1031 exchange, divorce, estate, relocation)? That informs how much negotiation room exists.
- What's the average days-on-market for RENTAL listings here right now (not sales)? A rising rental-DOM trend means longer vacancies and softer asking-rent achievability than the comps imply.
- What's the recent tenant-quality profile in this submarket — average credit score on applications, eviction rate, late-payment / NSF rate, and stable-employment percentage? A property-management company in the area should have these aggregated.
- How much new apartment / multifamily construction is in the pipeline within 1–3 miles? Heavy new supply (>2% of stock underway) typically softens rents 12–24 months out; light construction supports rent growth.
Investment metrics
- 1% rule
- 3.34% ✓
- Cap rate
- 26.92%
- Cash-on-cash
- 73.66%
- DSCR
- 4.28
- GRM
- 2.5
CMA / ARV
No comps found within radius.
Projected returns pro-forma
9.48% appreciation · 3.0% rent growth · sell at horizon
- IRR
- 83.8%
- Equity multiple
- 6.74×
- Total profit
- $240,922
- Equity at exit
- $129,530
- IRR
- 78.7%
- Equity multiple
- 14.80×
- Total profit
- $579,660
- Equity at exit
- $273,581
Cash invested: $42,000 (down + closing). Projections, not guarantees.
Landlord ↔ Tenant lean methodology
- Overall (STATE)
- 15 Strongly Tenant-Friendly
- State New York
- 15 Strongly Tenant-Friendly · D+10
- County
- — inherits STATE
- City
- — inherits STATE
ZIP-level market 13317
- Home prices YoY
- 3.2%
- Active inventory
- 31
- Price-to-rent
- 12.5×
Monthly cashflow live
- Estimated rent
- $5,013 medium interval (Pro) →
- Mortgage (P&I)
- −$787
- Tax from tax record
- −$533 /mo · $6,396/yr
- Insurance
- −$62
- HOA
- −$0
- Vacancy / Maint / Mgmt
- −$1,053
- Net cashflow
- $2,578
Break-even live
Sensitivity live
| Price | -10% $2,663 | -5% $2,621 | +0% $2,578 | +5% $2,536 | +10% $2,493 |
|---|---|---|---|---|---|
| Rent | -10% $2,182 | -5% $2,380 | +0% $2,578 | +5% $2,776 | +10% $2,974 |
| Rate | -1.0pp $2,654 | -0.5pp $2,616 | base $2,578 | +0.5pp $2,539 | +1.0pp $2,500 |
5-unit breakdown (identical units grouped — click to expand)
| Units | Beds | Baths | Est. rent |
|---|---|---|---|
| 5× units | 3 | — | $5,015 |
| #1 | 3 | — | $1,003 |
| #2 | 3 | — | $1,003 |
| #3 | 3 | — | $1,003 |
| #4 | 3 | — | $1,003 |
| #5 | 3 | — | $1,003 |
| Total (5 units) | $5,013 | ||
UW: 25.0% down · 7.5% · 30yr · 1.5% tax · 5.0% vac · 8.0% maint · 8.0% mgmt
Financing live
Cash to close
- Down payment
- $37,500
- Closing costs
- $4,500
- Reserves months
- —
- Total cash needed
- —
Loan-product check · same deal, 3 products live
Conventional
25% down · 7.5% · 30yr
- Down + closing
- —
- Monthly P&I
- —
- Monthly cashflow
- —
- DSCR
- —
- Eligible?
- —
Personal DTI + credit; lowest rate.
DSCR
20% down · 8.5% · 30yr
- Down + closing
- —
- Monthly P&I
- —
- Monthly cashflow
- —
- DSCR
- —
- Eligible?
- —
No personal income docs; deal must DSCR.
Hard money
10% down · 12.0% · 12mo
- Down + closing
- —
- Monthly P&I
- —
- Monthly cashflow
- —
- DSCR
- —
- Eligible?
- —
Short-term bridge; refi at stabilization.
Listing history 28 events
-
2026-06-21pricedays on market $150,000 Active 26 DOM
-
2026-06-18days on market $195,000 Active 24 DOM
-
2026-06-17days on market $195,000 Active 23 DOM
-
2026-06-16days on market $195,000 Active 22 DOM
-
2026-06-15days on market $195,000 Active 21 DOM
-
2026-06-13days on market $195,000 Active 19 DOM
-
2026-06-12days on market $195,000 Active 18 DOM
-
2026-06-09days on market $195,000 Active 15 DOM
-
2026-06-08days on market $195,000 Active 14 DOM
-
2026-06-07days on market $195,000 Active 13 DOM
-
2026-06-07days on market $195,000 Active 12 DOM
-
2026-06-04days on market $195,000 Active 9 DOM
-
2026-06-02days on market $195,000 Active 8 DOM
-
2026-06-01days on market $195,000 Active 7 DOM
-
2026-05-31days on market $195,000 Active 6 DOM
-
2026-05-24$195,000 Active
-
2022-12-21historical
-
2022-09-13price $140,000
-
2022-07-15$150,000 Active
-
2016-08-25historical
-
2016-04-15$75,000 New
-
2010-10-15historical
-
2009-11-10$69,000
-
2006-09-28soldstatus $90,000
-
2003-10-24soldstatus $19,500
-
2003-10-19historical
-
2003-08-06soldstatus $34,000
-
2003-06-12$19,500
ⓘ Source: listings_history table (triggers on properties + properties_extension) + one-shot
backfill from property_details.listing_events for pre-trigger history.
Tax reassessment forecast NY · Partial reset (capped growth)
- Current annual tax
- $6,396 · $533/mo
- Projected year-2 tax
- $6,396 · $533/mo
- Expected delta
- $0/yr ($0/mo · 0.0%)
ⓘ Screening estimate from a state-policy table — verify with the county assessor before closing.
Climate risk First Street
- Flood 1/10 Low FEMA zone X (unshaded) · 0% chance over 30 yrs
- Wildfire 1/10 Low
- Heat 3/10 Moderate 7 d/yr ≥96°F today · 16 d/yr by 30 yrs out
- Wind 2/10 Low 2% chance of damaging wind over 30 yrs
- Air quality 1/10 Low 0 unhealthy d/yr today · 0 by 30 yrs out
Nearby sold comps map
Loading sold comps map…
Walkable amenities ~0.75 mi
Loading nearby amenities…
Taxation est. · year 1
- Rental income
- $60,156
- − Mortgage interest
- −$8,402
- − Property taxes
- −$6,396
- − Insurance
- −$750
- − Repairs & maintenance
- −$4,812
- − Management
- −$4,812
- − Depreciation
- −$4,364
- Taxable income
- $30,620
- Est. tax owed @ 24.0%
- −$7,349
- After-tax cash flow
- $23,590/yr
For passive investors: Depreciation is non-cash, so a rental often shows a tax loss while cash-flowing — sheltering income. Rental losses are passive: they offset passive income freely, and up to $25,000/yr can offset ordinary (W-2) income if you actively participate and your MAGI is under $100k (phasing out to $0 by $150k); unused losses carry forward. On sale, claimed depreciation is recaptured at up to 25%, and gains may owe capital-gains tax (a 1031 exchange can defer both). Figures are a year-1 estimate at your 24.0% rate — not tax advice; consult a CPA.
Schools (NCES district)
- District
- Canajoharie Central School District
- NCES district ID
- 3606300
- Math proficiency
- 38% ▼ -12.00%
- Reading proficiency
- 59% ▲ 10.00%
- Median HH income
- $49,296
- Composite
- 41.39/100
- National rank
- #3482
- State rank
- #414 of 590 in NY
Livability — Canajoharie
- Score
- 69/100
- State rank
- #510
- US rank
- #9061
Category grades
Schools grade is shown separately in the Schools card above.
Census & demographics
- Census place
- Canajoharie, NY
- Population (ZIP)
- 3,970
Population outlook (Montgomery County) Hauer SSP2
- Today (2025)
- 48,683 people
- By 2030
- 47,785 · -1.8%
- By 2040
- 45,492 · -6.6%
- By 2050
- 43,161 · -11.3%
- By 2075
- 38,134 · -21.7%
- By 2100
- 32,337 · -33.6%
Race, ethnicity, and origin ACS 2023
- Neighborhood character
- Predominantly White (95%)
- Race & ethnicity
- White 95% Two or more races 3% Hispanic / Latino 2%
- Common ancestry
- Iranian 5% Romanian 3% Lithuanian 3%
- Foreign-born
- 1% · Canada
- Languages at home
- 79% English-only · German/W. Germanic 19% Spanish 1% French/Haitian/Cajun 1%
Political lean MEDSL · Montgomery
- 2024 margin
- Strong R (+28.7) · D 35.6% · R 64.4%
- 2008→2024 swing
- -20.6pp toward R · 2008: -8.1pp · 2024: -28.7pp
- All cycles
- 2024: R+28.7 2020: R+22.6 2016: R+26.5 2012: R+4.4 2008: R+8.1
Not yet ingested
- Civics
- —
Market trends
- HPI YoY
- ▲ 9.48%
- Current HPI
- 303.1499
- Rent YoY
- —
- Metro
- —
- State GDP YoY
- ▲ 2.60%
- F500 in state
- 92
Industry mix (Fortune 500 HQ in NY)
| Industry | F500 HQs | Revenue |
|---|---|---|
| Financial Services | 10 | $950B |
|
||
| Consumer Goods | 9 | $162B |
|
||
| Insurance | 4 | $225B |
|
||
| Telecommunications | 2 | $144B |
|
||
| Pharmaceuticals | 2 | $112B |
|
||
| Media / Entertainment | 2 | $69B |
|
||
Price history
+900.0% since first listed13 events — show timeline
- 2026-05-24 Listed $195,000 Global MLS
- 2022-12-21 Listing Removed — Global MLS
- 2022-09-13 Price Changed $140,000 Global MLS
- 2022-07-15 Listed $150,000 Global MLS
- 2016-08-25 Listing Removed — Global MLS
- 2016-04-15 Listed $75,000 Global MLS
- 2010-10-15 Listing Removed — Global MLS
- 2009-11-10 Listed $69,000 Global MLS
- 2006-09-28 Sold (Public Records) $90,000 Public Records
- 2003-10-24 Sold (MLS) $19,500 Global MLS
- 2003-10-19 Listing Removed — Global MLS
- 2003-08-06 Sold (Public Records) $34,000 Public Records
- 2003-06-12 Listed $19,500 Global MLS
Property tax history
+4.4%/yrLatest (2025): $6,396 · +18.3% YoY. Source: county tax records.
Cash-flow waterfall
monthlySold comps — $/sqft
last 12 mo · ≤1 miLoading sold comps…