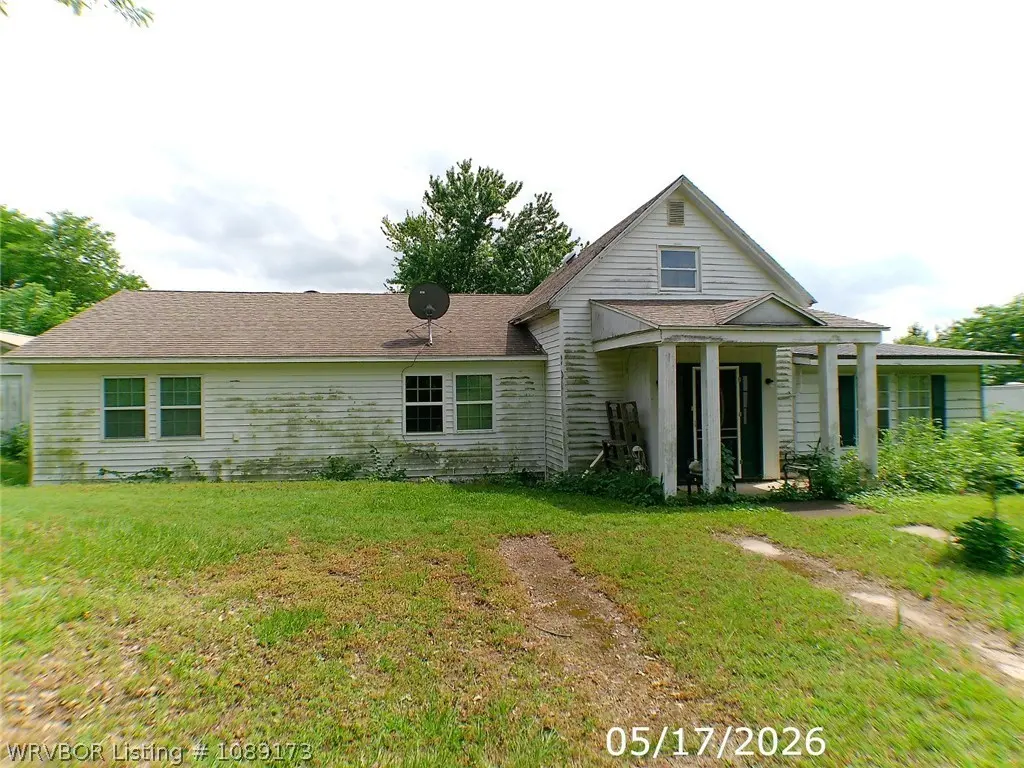
409 Baxter St · Altus, AR
Flood risk 1/10 · Minimal
- FEMA flood zone
- X (unshaded)
- Chance of flooding over 30 yrs
- 0.0%
- Est. flood insurance / yr
- $507 – $1,088
Fire risk 6/10 · Moderate
- Est. fire insurance / yr
- $1,499 – $2,785
Heat risk 6/10 · Moderate
- Hot days now (above 112°F)
- 7 days/yr
- Hot days in 30 yrs
- 20 days/yr
Wind risk 2/10 · Minimal
- Chance of severe wind over 30 yrs
- 1.0%
Air-quality risk 1/10 · Minimal
- Unhealthy air days now
- 0 days/yr
- Unhealthy air days in 30 yrs
- 0 days/yr
Risk factors via First Street. Map © Google.
Why this score? — see what drove the C grade
The composite is a weighted blend of 9 inputs, each scored 0–100. Each bar is that input's sub-score; the figure is the points it added to the 100-point composite (weight × sub-score).
- Cash flow +19.7/30.0
- ARV discount +7.5/15.0
- Appreciation +7.0/10.0
- DSCR +6.2/10.0
- 1% rule +5.2/10.0
- Livability +3.7/5.0
- Schools +3.2/10.0
- Rent growth +2.5/5.0
- Condition / age +2.5/5.0
$125,000
🖨 Deal sheet 📄 Offer letter ✓ Due diligence
Listing remarks
Older home in need of updating and maintenance. Large sq footage on large lot. Lots of trees. Lots of potential. Storm cellar with access in house
Key facts
- Lots of trees
- Large lot
- Storm cellar
Tags
Property features AI
Exterior
- Parking: Detached garage; 2 covered parking spaces; Aggregate driveway
- Utilities: Public water; Electricity available; Sewer available; Water available
- Home design: Single-family house; Two stories
- Construction: Vinyl siding; Asphalt shingle roof; Slab foundation; Built as a house
- Exterior features: Partial fencing; City lot
Interior
- Kitchen: Dishwasher; Microwave; Range
- Flooring: Wood flooring
- Bathrooms: 3 full bathrooms
- Heating & cooling: Central heating; Central air conditioning
- Interior features: Dishwasher; Electric water heater; Microwave; Range
- Laundry & utility: Electric dryer hookup
Neighborhood map
What this means for you Summary
Snapshot
- This is a 4-bed/2.5-bath single-family listed at $125k.
Deal economics
- At list price, monthly cash flow is $147 ($2k/yr) — positive.
- The deal already cash-flows at list — no discount required.
- Meets the 1% rule at list price ($1k rent vs $125k).
Location & tenants
- Location reads 74/100 on livability (#18 in AR, #4,703 nationally) — a middle-class / working-renter tenant base. Strengths: crime A+, cost of living A+, health & safety A+; Watch: commute D, employment D, amenities F.
- Ozark School District (town): math 41% / reading 38% proficiency, ranked #80 of 238 in AR (top 34%) — families likely to look elsewhere, expect single-tenant / working-renter base with shorter leases.
- Zoned schools: Ozark Upper Elementary School (math 40% / reading 31%, grade F, #250 of 454 statewide, top 55%, 267 students, 57% FRL); Ozark Middle School (math 57% / reading 41%, grade C-, #37 of 201 statewide, top 18%, 234 students, 56% FRL); Ozark High School (math 22% / reading 39%, grade F, #134 of 292 statewide, top 47%, 700 students, 46% FRL) — zoned schools at 53% FRL track the district average.
- Market conditions: 17 active listings in the ZIP; 23 units permitted in Franklin County in 2024 (0 in 5+ unit buildings).
Forward outlook
- In year one you build about $6k of equity ($864 loan paydown + $5k appreciation (4.0% local appreciation)).
- Franklin County population projected at -16% by 2050 — secular population decline; favor cash flow + early exit over multi-decade hold.
- At projected returns (4.0% appreciation + 3.0% rent growth), your $35k cash investment doubles in ~5 years — after that, you're playing with house money.
- By year 6, paydown + projected appreciation supports a ~$31k cash-out refi (75% LTV) — recoverable capital for the next deal without selling this one.
Negotiation context
- Only 7 days on market — expect competitive offers; lowballing is unlikely to land.
- Current owner paid $15k; list at $125k implies a 733% gain — meaningful room to come down on a strong offer.
Risks & watch-outs
- Climate carrying-cost: major wildfire risk; extreme-heat days projected 7→20/yr by 2055 (HVAC capex compounding) — expect insurance premiums to compound above CPI over the hold.
Questions for the listing agent
- Built in 1971 — when were the roof, HVAC, electrical panel, plumbing, and water heater last replaced?
- Is there a deadline driving the sale (1031 exchange, divorce, estate, relocation)? That informs how much negotiation room exists.
- Schools are D-rated, which usually means shorter tenancies and higher turnover. Who's the typical renter profile here, and what's been the actual vacancy rate?
- What's the average days-on-market for RENTAL listings here right now (not sales)? A rising rental-DOM trend means longer vacancies and softer asking-rent achievability than the comps imply.
- What's the recent tenant-quality profile in this submarket — average credit score on applications, eviction rate, late-payment / NSF rate, and stable-employment percentage? A property-management company in the area should have these aggregated.
- How much new for-sale + rental construction is in the pipeline within 1–3 miles? Heavy new supply typically softens prices + rents 12–24 months out; constrained supply supports both.
Investment metrics
- 1% rule
- 1.02% ✓
- Cap rate
- 7.70%
- Cash-on-cash
- 5.03%
- DSCR
- 1.22
- GRM
- 8.1
CMA / ARV
No comps found within radius.
Projected returns pro-forma
4.0% appreciation · 3.0% rent growth · sell at horizon
- IRR
- 14.8%
- Equity multiple
- 1.89×
- Total profit
- $31,184
- Equity at exit
- $63,405
- IRR
- 15.9%
- Equity multiple
- 3.57×
- Total profit
- $89,959
- Equity at exit
- $103,726
Cash invested: $35,000 (down + closing). Projections, not guarantees.
Landlord ↔ Tenant lean methodology
- Overall (STATE)
- 92 Strongly Landlord-Friendly
- State Arkansas
- 92 Strongly Landlord-Friendly · R+14
- County
- — inherits STATE
- City
- — inherits STATE
ZIP-level market 72821
- Home prices YoY
- 2.5%
- Active inventory
- 17
- Price-to-rent
- 8.1×
Monthly cashflow live
- Estimated rent
- $1,279 medium interval (Pro) →
- Mortgage (P&I)
- −$656
- Tax est. 1.5%
- −$156 /mo · $1,875/yr
- Insurance
- −$52
- HOA
- −$0
- Vacancy / Maint / Mgmt
- −$269
- Net cashflow
- $147
Break-even live
UW: 25.0% down · 7.5% · 30yr · 1.5% tax · 5.0% vac · 8.0% maint · 8.0% mgmt
Financing live
Cash to close
- Down payment
- $31,250
- Closing costs
- $3,750
- Reserves months
- —
- Total cash needed
- —
Loan-product check · same deal, 3 products live
Conventional
25% down · 7.5% · 30yr
- Down + closing
- —
- Monthly P&I
- —
- Monthly cashflow
- —
- DSCR
- —
- Eligible?
- —
Personal DTI + credit; lowest rate.
DSCR
20% down · 8.5% · 30yr
- Down + closing
- —
- Monthly P&I
- —
- Monthly cashflow
- —
- DSCR
- —
- Eligible?
- —
No personal income docs; deal must DSCR.
Hard money
10% down · 12.0% · 12mo
- Down + closing
- —
- Monthly P&I
- —
- Monthly cashflow
- —
- DSCR
- —
- Eligible?
- —
Short-term bridge; refi at stabilization.
Listing history 2 events
-
2026-05-18$125,000 Active
-
2009-10-05soldstatus $15,000
ⓘ Source: listings_history table (triggers on properties + properties_extension) + one-shot
backfill from property_details.listing_events for pre-trigger history.
Climate risk First Street
- Flood 1/10 Low FEMA zone X (unshaded) · 0% chance over 30 yrs
- Wildfire 6/10 Major
- Heat 6/10 Major 7 d/yr ≥112°F today · 20 d/yr by 30 yrs out
- Wind 2/10 Low 100% chance of damaging wind over 30 yrs
- Air quality 1/10 Low 0 unhealthy d/yr today · 0 by 30 yrs out
Nearby sold comps map
Loading sold comps map…
Walkable amenities ~0.75 mi
Loading nearby amenities…
Taxation est. · year 1
- Rental income
- $15,349
- − Mortgage interest
- −$7,002
- − Property taxes
- −$1,875
- − Insurance
- −$625
- − Repairs & maintenance
- −$1,228
- − Management
- −$1,228
- − Depreciation
- −$3,636
- Taxable loss
- −$245
- Est. tax savings @ 24.0%
- +$59
- After-tax cash flow
- $1,818/yr
For passive investors: Depreciation is non-cash, so a rental often shows a tax loss while cash-flowing — sheltering income. Rental losses are passive: they offset passive income freely, and up to $25,000/yr can offset ordinary (W-2) income if you actively participate and your MAGI is under $100k (phasing out to $0 by $150k); unused losses carry forward. On sale, claimed depreciation is recaptured at up to 25%, and gains may owe capital-gains tax (a 1031 exchange can defer both). Figures are a year-1 estimate at your 24.0% rate — not tax advice; consult a CPA.
Schools (NCES district)
- District
- Ozark School District
- NCES district ID
- 0511010
- Math proficiency
- 41% ▼ -9.00%
- Reading proficiency
- 38% ▼ -8.00%
- Median HH income
- $33,306
- Composite
- 32.5/100
- National rank
- #5703
- State rank
- #80 of 238 in AR
Livability — Altus
- Score
- 74/100
- State rank
- #18
- US rank
- #4703
Category grades
Schools grade is shown separately in the Schools card above.
Census & demographics
- Census place
- Altus, AR
- Population (ZIP)
- 2,022
Population outlook (Franklin County) Hauer SSP2
- Today (2025)
- 16,946 people
- By 2030
- 16,403 · -3.2%
- By 2040
- 15,303 · -9.7%
- By 2050
- 14,243 · -16.0%
- By 2075
- 12,136 · -28.4%
- By 2100
- 10,443 · -38.4%
Race, ethnicity, and origin ACS 2023
- Neighborhood character
- Predominantly White (91%)
- Race & ethnicity
- White 91% Two or more races 9% Hispanic / Latino 3%
- Common ancestry
- Romanian 1% Lithuanian 1%
- Foreign-born
- 0%
- Languages at home
- 96% English-only · Spanish 3% German/W. Germanic 1%
Political lean MEDSL · Franklin
- 2024 margin
- Solid R (+62.4) · D 17.7% · R 80.1% · Other 2.2%
- 2008→2024 swing
- -23.1pp toward R · 2008: -39.3pp · 2024: -62.4pp
- All cycles
- 2024: R+62.4 2020: R+61.4 2016: R+54.6 2012: R+44.4 2008: R+39.3
Not yet ingested
- Civics
- —
Market trends
- HPI YoY
- ▲ 4.00%
- Current HPI
- 163.2381
- Rent YoY
- —
- Metro
- —
- State GDP YoY
- ▲ 3.80%
- F500 in state
- 10
Industry mix (Fortune 500 HQ in AR)
| Industry | F500 HQs | Revenue |
|---|---|---|
| Retail | 1 | $681B |
|
||
| Food / Agriculture | 1 | $53B |
|
||
| Retail / Energy | 1 | $22B |
|
||
| Transportation / Logistics | 1 | $12B |
|
||
| Energy | 1 | $4B |
|
||
Price history
+733.3% since first listed2 events — show timeline
- 2026-05-18 Listed $125,000 WRVBOR
- 2009-10-05 Sold (Public Records) $15,000 Public Records
Property tax history
+0.3%/yrLatest (2025): $77 · -56.5% YoY. Source: county tax records.
Cash-flow waterfall
monthlySold comps — $/sqft
last 12 mo · ≤1 miLoading sold comps…