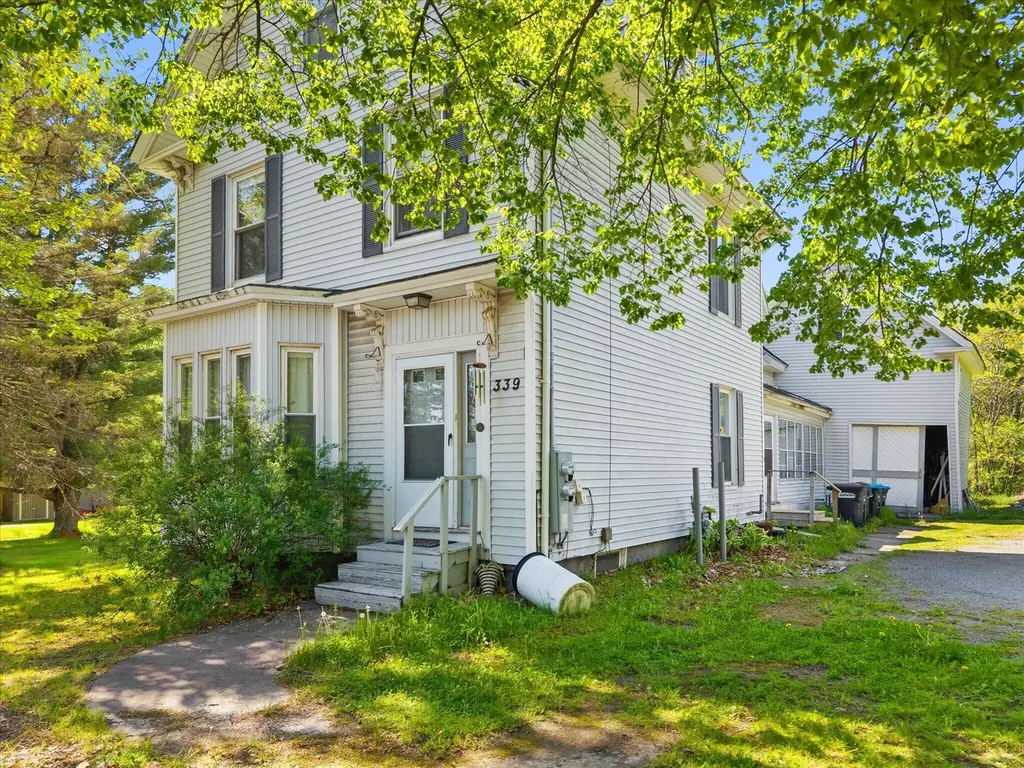
339 Stillwater Ave · Old Town, ME
Flood risk 1/10 · Minimal
- FEMA flood zone
- X (unshaded)
- Chance of flooding over 30 yrs
- 0.0%
- Est. flood insurance / yr
- $473 – $860
Fire risk 3/10 · Minor
- Est. fire insurance / yr
- $669 – $1,243
Heat risk 2/10 · Minimal
- Hot days now (above 92°F)
- 7 days/yr
- Hot days in 30 yrs
- 15 days/yr
Wind risk 6/10 · Moderate
- Chance of severe wind over 30 yrs
- 27.0%
Air-quality risk 1/10 · Minimal
- Unhealthy air days now
- 0 days/yr
- Unhealthy air days in 30 yrs
- 0 days/yr
Risk factors via First Street. Map © Google.
Why this score? — see what drove the C- grade
The composite is a weighted blend of 9 inputs, each scored 0–100. Each bar is that input's sub-score; the figure is the points it added to the 100-point composite (weight × sub-score).
- Cash flow +16.1/30.0
- ARV discount +11.1/15.0
- Schools +6.8/10.0
- DSCR +5.0/10.0
- 1% rule +4.4/10.0
- Livability +3.8/5.0
- Rent growth +2.5/5.0
- Condition / age +2.5/5.0
- Appreciation +2.4/10.0
$277,000
🖨 Deal sheet (PDF) 📄 Offer letter ✓ Due diligence
Listing remarks MLS
Calling all investors who are looking for the perfect rental property near The University of Maine and right in the heart of Old Town!! This grand colonial style duplex features character throughout! Unit 1 includes 3 bedrooms, 1.5 bathroom, a spacious kitchen and living room, and rents for $1,200/month. Unit 2 features 2 bedrooms, 1 bathroom, and will be vacant by end of June- easy to show! Both units have their own washer and dryer. Nestled on a spacious 1.25 acre in town lot, enjoy beautiful open land and wooded backyard views. Natural gas recently installed and newer boiler! Act fast, this won't last long!
Key facts
- Large back deck
- Open yard
- Wooded views
Tags
Property features AI
Finance
- Financial info: Two-unit building; Gross income: $30,960; Operating expenses: $14,206; Unit 1 actual rent: $1,380; Unit 2 actual rent: $1,200
Exterior
- Parking: Gravel parking with 5–10 spaces
- Utilities: Public water; Public sewer; Circuit breaker electrical service; Oil water heater; Utilities currently on
- Home design: Multi-family property with 2 units; Built in 1900; R1 zoning
- Construction: Wood frame construction with vinyl siding; Metal and shingle roof; Full, unfinished basement with interior entry
- Exterior features: Deck; Glassed-in porch; Level lot; Intown location near shopping and turnpike/interstate
Interior
- Kitchen: Refrigerators included in both units
- Bedrooms: One 3-bedroom unit (first level); One 2-bedroom unit (first level)
- Flooring: Laminate flooring; Wood flooring
- Bathrooms: 2 full bathrooms (total)
- Heating & cooling: Baseboard heat; Forced air; Hot water heating
- Interior features: Bathtub and shower; In-unit storage
- Laundry & utility: Main-level laundry; Dedicated water heaters for each unit
Neighborhood map
What this means for you Summary
Snapshot
- This is a 5-bed/2.0-bath single-family listed at $277k.
Deal economics
- At list price, monthly cash flow is $143 ($2k/yr) — positive.
- The deal already cash-flows at list — no discount required.
- To meet the 1% rule (rent ≥ 1% of price), the offer needs to be $262k (5.6% below list).
- Recommended offer: $262k (5.6% below list) — sets the bar for 1% rule.
Location & tenants
- Location reads 75/100 on livability (#38 in ME, #3,905 nationally) — a middle-class / working-renter tenant base. Strengths: crime A+, cost of living A+, housing A+; Watch: employment D, amenities F, commute F.
- RSU 34 (suburban): math 81% / reading 83% proficiency, ranked #80 of 112 in ME (top 71%) — strong family-tenant draw, lease renewals of 3-5y typical.
- Zoned schools: Old Town Elementary School (math 83% / reading 83%, grade A+, #151 of 294 statewide, top 52%, 427 students, 57% FRL); Leonard Middle School (math 80% / reading 80%, grade A+, #59 of 85 statewide, top 71%, 306 students, 49% FRL); Old Town High School (math 87% / reading 98%, grade A+, #26 of 108 statewide, top 23%, 536 students, 46% FRL).
- Market conditions: 46 active listings in the ZIP; 440 units permitted in Penobscot County in 2024 (40 in 5+ unit buildings).
- At $2,616/mo this rent would consume 56% of the median local household income ($56k/yr) (locally 334% of renters already pay >50% of income on rent) — very limited rent-growth headroom before tenants either downsize or default.
Forward outlook
- Local home prices are declining (-3.0%/yr); year-one equity from $2k of loan paydown is wiped out by about $8k of value loss. Plan a longer hold.
- Penobscot County population projected at -17% by 2050 — secular population decline; favor cash flow + early exit over multi-decade hold.
Negotiation context
- Only 6 days on market — expect competitive offers; lowballing is unlikely to land.
- 3 sale attempts since 7y ago with the ask held roughly flat each time — persistent listings suggest the price (not the market) is what's stuck; bring a comps-based counter.
- Current owner paid $168k; list at $277k implies a 65% gain — meaningful room to come down on a strong offer.
Risks & watch-outs
- Watch-outs: built in 1900 — expect roof / HVAC / electrical / plumbing capex.
- Climate carrying-cost: major wind risk, 27% chance of damaging wind over 30y — expect insurance premiums to compound above CPI over the hold.
Questions for the listing agent
- Built in 1900 — when were the roof, HVAC, electrical panel, plumbing, and water heater last replaced?
- Is there a deadline driving the sale (1031 exchange, divorce, estate, relocation)? That informs how much negotiation room exists.
- Schools are D-rated, which usually means shorter tenancies and higher turnover. Who's the typical renter profile here, and what's been the actual vacancy rate?
- What's the average days-on-market for RENTAL listings here right now (not sales)? A rising rental-DOM trend means longer vacancies and softer asking-rent achievability than the comps imply.
- What's the recent tenant-quality profile in this submarket — average credit score on applications, eviction rate, late-payment / NSF rate, and stable-employment percentage? A property-management company in the area should have these aggregated.
- How much new for-sale + rental construction is in the pipeline within 1–3 miles? Heavy new supply typically softens prices + rents 12–24 months out; constrained supply supports both.
Investment metrics
- 1% rule
- 0.94% ✗
- Cap rate
- 6.91%
- Cash-on-cash
- 2.21%
- DSCR
- 1.10
- GRM
- 8.8
CMA / ARV
- ARV (on-the-fly)
- $301,324
- Comps found
- 4
Show comp detail 4 sales within ~0.75 mi
| Address | Dist | Beds/Ba | Sqft | Sold | Price | $/sf | Match |
|---|---|---|---|---|---|---|---|
| 130 Stillwater Ave | 0.50mi | 5/1.5 | 2,028 (-4%) | 1mo | $349,900 | $173 | 66 |
| 149 Middle St St | 0.43mi | 4/2.0 (-1) | 2,187 (+3%) | 16mo | $310,000 | $142 | 56 |
| 260 Center St | 0.45mi | 4/1.5 (-1) | 2,057 (-3%) | 23mo | $244,000 | $119 | 48 |
| 98 6th St | 0.53mi | 4/1.0 (-1) | 1,947 (-8%) | 22mo | $275,000 | $141 | 34 |
Match score weights: distance 35% · size 25% · config 20% · recency 20%. Top-matched comps best support the ARV.
Projected returns pro-forma
-3.0% appreciation · 3.0% rent growth · sell at horizon
- IRR
- -12.8%
- Equity multiple
- 0.54×
- Total profit
- $-35,758
- Equity at exit
- $41,302
- IRR
- -3.7%
- Equity multiple
- 0.75×
- Total profit
- $-19,259
- Equity at exit
- $23,950
Cash invested: $77,560 (down + closing). Projections, not guarantees.
Landlord ↔ Tenant lean methodology
- Overall (STATE)
- 41 Moderately Tenant-Leaning
- State Maine
- 41 Moderately Tenant-Leaning · D+2
- County
- — inherits STATE
- City
- — inherits STATE
ZIP-level market 04468
- Home prices YoY
- -1.8%
- Active inventory
- 46
- Price-to-rent
- 8.8×
Monthly cashflow live
- Estimated rent
- $2,616 medium interval (Pro) →
- Mortgage (P&I)
- −$1,453
- Tax from tax record
- −$356 /mo · $4,270/yr
- Insurance
- −$115
- HOA
- −$0
- Vacancy / Maint / Mgmt
- −$549
- Net cashflow
- $143
Break-even live
Sensitivity live
| Price | -10% $299 | -5% $221 | +0% $143 | +5% $64 | +10% $-14 |
|---|---|---|---|---|---|
| Rent | -10% $-64 | -5% $39 | +0% $143 | +5% $246 | +10% $349 |
| Rate | -1.0pp $282 | -0.5pp $213 | base $143 | +0.5pp $71 | +1.0pp $-2 |
UW: 25.0% down · 7.5% · 30yr · 1.5% tax · 5.0% vac · 8.0% maint · 8.0% mgmt
Financing live
Cash to close
- Down payment
- $69,250
- Closing costs
- $8,310
- Reserves months
- —
- Total cash needed
- —
Loan-product check · same deal, 3 products live
Conventional
25% down · 7.5% · 30yr
- Down + closing
- —
- Monthly P&I
- —
- Monthly cashflow
- —
- DSCR
- —
- Eligible?
- —
Personal DTI + credit; lowest rate.
DSCR
20% down · 8.5% · 30yr
- Down + closing
- —
- Monthly P&I
- —
- Monthly cashflow
- —
- DSCR
- —
- Eligible?
- —
No personal income docs; deal must DSCR.
Hard money
10% down · 12.0% · 12mo
- Down + closing
- —
- Monthly P&I
- —
- Monthly cashflow
- —
- DSCR
- —
- Eligible?
- —
Short-term bridge; refi at stabilization.
Listing history 6 events
-
2026-06-13status $277,000 Pending 6 DOM
-
2026-06-10days on market $277,000 Active 6 DOM
-
2026-06-09days on market $277,000 Active 5 DOM
-
2026-06-08days on market $277,000 Active 4 DOM
-
2026-06-07remarks 699-char remark
-
2026-06-07$277,000 Active 3 DOM
ⓘ Source: listings_history table (triggers on properties + properties_extension) + one-shot
backfill from property_details.listing_events for pre-trigger history.
Tax reassessment forecast ME · Partial reset (capped growth)
- Current annual tax
- $4,270 · $356/mo
- Projected year-2 tax
- $4,270 · $356/mo
- Expected delta
- $0/yr ($0/mo · 0.0%)
ⓘ Screening estimate from a state-policy table — verify with the county assessor before closing.
Climate risk First Street
- Flood 1/10 Low FEMA zone X (unshaded) · 0% chance over 30 yrs
- Wildfire 3/10 Moderate
- Heat 2/10 Low 7 d/yr ≥92°F today · 15 d/yr by 30 yrs out
- Wind 6/10 Major 27% chance of damaging wind over 30 yrs
- Air quality 1/10 Low 0 unhealthy d/yr today · 0 by 30 yrs out
Nearby sold comps map
Loading sold comps map…
Walkable amenities ~0.75 mi
Loading nearby amenities…
Taxation est. · year 1
- Rental income
- $31,389
- − Mortgage interest
- −$15,516
- − Property taxes
- −$4,270
- − Insurance
- −$1,385
- − Repairs & maintenance
- −$2,511
- − Management
- −$2,511
- − Depreciation
- −$8,058
- Taxable loss
- −$2,862
- Est. tax savings @ 24.0%
- +$687
- After-tax cash flow
- $2,398/yr
For passive investors: Depreciation is non-cash, so a rental often shows a tax loss while cash-flowing — sheltering income. Rental losses are passive: they offset passive income freely, and up to $25,000/yr can offset ordinary (W-2) income if you actively participate and your MAGI is under $100k (phasing out to $0 by $150k); unused losses carry forward. On sale, claimed depreciation is recaptured at up to 25%, and gains may owe capital-gains tax (a 1031 exchange can defer both). Figures are a year-1 estimate at your 24.0% rate — not tax advice; consult a CPA.
Schools (NCES district)
- District
- RSU 34
- NCES district ID
- 2314782
- Math proficiency
- 81% ▲ 48.00%
- Reading proficiency
- 83% ▲ 31.00%
- Median HH income
- $39,466
- Composite
- 68.31/100
- National rank
- #351
- State rank
- #80 of 112 in ME
Livability — Old Town
- Score
- 75/100
- State rank
- #38
- US rank
- #3905
Category grades
Schools grade is shown separately in the Schools card above.
Census & demographics
- Census place
- Old Town, ME
- County
- Penobscot County · 81,539 people
- City population
- 9,291
- Metro
- Bangor, ME
- Population (ZIP)
- 9,291
- Household income
- $56,358
- Rent vs Own
- Severe rent burden
- 334.0
Population outlook (Penobscot County) Hauer SSP2
- Today (2025)
- 149,928 people
- By 2030
- 146,386 · -2.4%
- By 2040
- 135,952 · -9.3%
- By 2050
- 123,864 · -17.4%
- By 2075
- 97,825 · -34.8%
- By 2100
- 77,196 · -48.5%
Race, ethnicity, and origin ACS 2023
- Neighborhood character
- Predominantly White (88%)
- Race & ethnicity
- White 88% Native American 6% Two or more races 3% Hispanic / Latino 2%
- Common ancestry
- Lithuanian 18% Slovak 4% Romanian 1%
- Foreign-born
- 2% · Canada
- Languages at home
- 96% English-only · French/Haitian/Cajun 1% Other Indo-European 1%
Political lean MEDSL · Penobscot
- 2024 margin
- R (+10.9) · D 43.6% · R 54.5% · Other 1.9%
- 2008→2024 swing
- -15.9pp toward R · 2008: 5.0pp · 2024: -10.9pp
- All cycles
- 2024: R+10.9 2020: R+8.3 2016: R+10.9 2012: D+2.9 2008: D+5.0
Not yet ingested
- Civics
- —
Market trends
- HPI YoY
- ▼ -5.29%
- Current HPI
- 285.3183
- Rent YoY
- —
- Metro
- Bangor, ME
- State GDP YoY
- —
- F500 in state
- 0
Price history
+84.7% since first listed10 events — show timeline
- 2026-06-04 Listed $277,000 MREIS
- 2020-07-21 Sold (MLS) $168,000 MREIS
- 2020-06-07 Pending — MREIS
- 2020-06-05 Listed $169,900 MREIS
- 2019-12-10 Delisted — MREIS
- 2019-10-17 Price Changed $166,900 MREIS
- 2019-08-09 Price Changed $169,987 MREIS
- 2019-07-02 Price Changed $174,987 MREIS
- 2019-05-30 Listed $179,987 MREIS
- 2013-07-31 Sold (MLS) $150,000 MREIS
Property tax history
+3.5%/yrLatest (2025): $4,270 · +12.9% YoY. Source: county tax records.
Cash-flow waterfall
monthlySold comps — $/sqft
last 12 mo · ≤1 miLoading sold comps…