 🏗️ New Construction
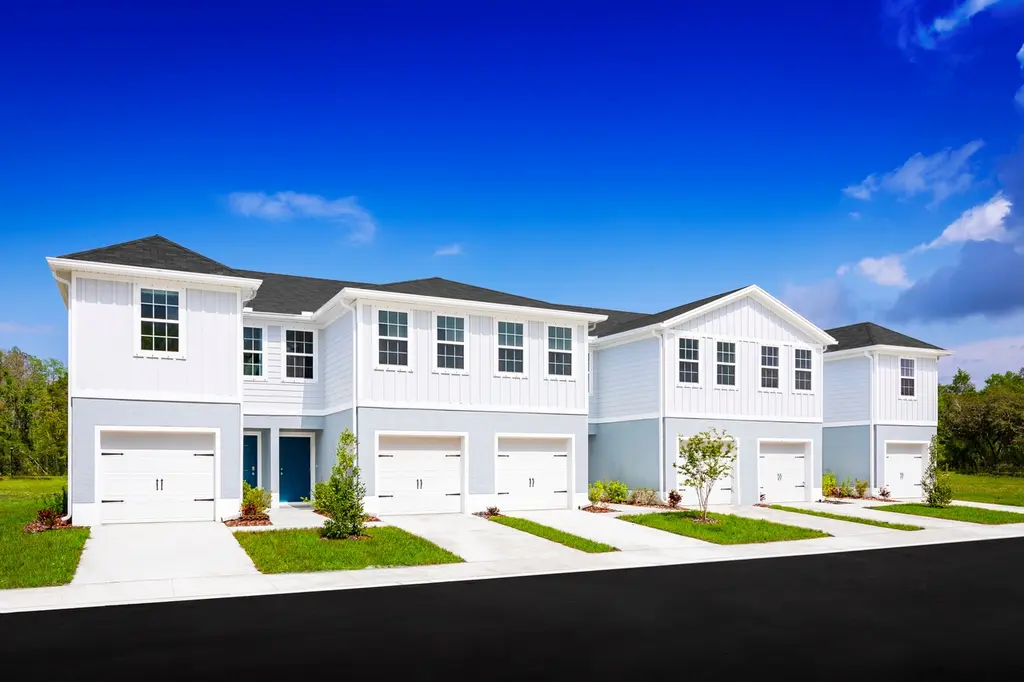
Flamingo Plan · Fort Pierce, FL
Flood risk No data
- FEMA flood zone
- —
- Chance of flooding over 30 yrs
- —
- Est. flood insurance / yr
- —
Fire risk No data
- Est. fire insurance / yr
- —
Heat risk No data
- Hot days now (above threshold)
- —
- Hot days in 30 yrs
- —
Wind risk No data
- Chance of severe wind over 30 yrs
- —
Air-quality risk No data
- Unhealthy air days now
- —
- Unhealthy air days in 30 yrs
- —
Risk factors via First Street. Map © Google.
Why this score? — see what drove the D grade
The composite is a weighted blend of 9 inputs, each scored 0–100. Each bar is that input's sub-score; the figure is the points it added to the 100-point composite (weight × sub-score).
- Cash flow +12.8/30.0
- ARV discount +7.5/15.0
- Rent growth +4.4/5.0
- 1% rule +4.3/10.0
- Condition / age +4.0/5.0
- DSCR +3.8/10.0
- Livability +3.8/5.0
- Schools +3.7/10.0
- Appreciation +0.0/10.0
$229,990
🖨 Deal sheet (PDF) 📄 Offer letter ✓ Due diligence
Listing remarks
Discover all the style you desire inside The Flamingo floor plan. A convenient one-car garage opens to a welcoming foyer, from which you can see all this gorgeous home has to offer. The formal dining space is ideal for family dinners. In the gourmet kitchen, an optional island provides extra cooking space. Relax either in the spacious great room or outside on the scenic lanai. Upstairs, two bedrooms and a full bath provide comfort for family or guests. Your luxurious owner's suite includes a stunning dual vanity bath and a huge walk-in closet. See how you can have it all inside the Flamingo.
Key facts
- One car garage
- Spacious great room
- Formal dining space
Tags
Property features AI
Finance
- Other: Living area approximately 1440 (listed); Address: Flamingo Plan, Fort Pierce, FL 34982; List price indicated (listing status Active)
- HOA & community: Monthly association fee of $112
Exterior
- Parking: 1 garage space (1 total parking space)
- Utilities: Central air (cooling)
- Home design: Single-family plan named "Flamingo" (Plan inventory)
Interior
- Bedrooms: 3 bedrooms
- Bathrooms: 2 full bathrooms and 1 half bathroom (2.5 total)
- Heating & cooling: Central Air
- Interior features: Central air conditioning
Neighborhood map
What this means for you Summary
Snapshot
- This is a 3-bed/2.5-bath townhouse listed at $230k. Condition is rated good.
Deal economics
- At list price, monthly cash flow is $-22 ($-258/yr) — negative.
- To cash-flow at today's rent, offer at most $219k (4.9% below list).
- To meet the 1% rule (rent ≥ 1% of price), the offer needs to be $205k (10.7% below list).
- Recommended offer: $205k (10.7% below list) — sets the bar for 1% rule.
- Cap rate 6.2% vs local median 3.7% in Fort Pierce — top-decile yield for the area; either an underpriced asset or a hidden risk that comps aren't pricing in. Stress-test before assuming the spread holds.
Location & tenants
- Location reads 76/100 on livability (#226 in FL, #3,360 nationally) — a middle-class / working-renter tenant base. Strengths: commute A+, cost of living A+, housing A+; Watch: crime D+, amenities F, employment F.
- St. Lucie (urban): math 40% / reading 48% proficiency, ranked #51 of 73 in FL (top 70%) — families likely to look elsewhere, expect single-tenant / working-renter base with shorter leases.
- Zoned schools: Manatee Academy K-8 (math 53% / reading 51%, grade C-, #990 of 2,144 statewide, top 48%, 1,664 students, 65% FRL); Southern Oaks Middle School (math 39% / reading 43%, grade F, #353 of 571 statewide, top 63%, 894 students, 76% FRL); Fort Pierce Central High School (math 15% / reading 45%, grade F, #441 of 667 statewide, top 67%, 3,091 students, 62% FRL).
- Market conditions: Rents rising fast (+7.4%/yr); 336 active listings in the ZIP; 20 comparable units currently listed for rent nearby; rentals at typical pace (median 25d on market — plan ~3-4 weeks tenant-placement turnaround); 4,868 units permitted in St. Lucie County in 2024 (268 in 5+ unit buildings).
- At $2,054/mo this rent would consume 46% of the median local household income ($54k/yr) (locally 1086% of renters already pay >50% of income on rent) — very limited rent-growth headroom before tenants either downsize or default.
Forward outlook
- Local home prices are declining (-3.0%/yr); year-one equity from $2k of loan paydown is wiped out by about $7k of value loss. Plan a longer hold.
- St. Lucie County population projected at +20% by 2050 — long-run rental-demand tailwind backs the buy-and-hold thesis.
Negotiation context
- It's been on market 49 days — a 3% lower offer ($223k) is reasonable based on typical stale-listing flexibility.
Questions for the listing agent
- What do current leases actually rent for vs. the listed asking? Can we see a recent rent roll and the last 12 months of T-12 income?
- It's been on market 49 days. Have you received any prior offers? Is the seller open to a 11% concession, seller financing, or rate buy-down credit?
- What does the HOA fee cover, when was the last increase, and are there any pending special assessments or reserve-fund shortfalls?
- Is there a deadline driving the sale (1031 exchange, divorce, estate, relocation)? That informs how much negotiation room exists.
- Schools are D-rated, which usually means shorter tenancies and higher turnover. Who's the typical renter profile here, and what's been the actual vacancy rate?
- Crime grade is D in this area — have there been break-ins, vandalism, or insurance claims at this property in the last 3 years? What carrier currently insures it and at what premium?
- The area grade is low — what's the realistic commute time and amenity access for the typical tenant pool here? Any planned neighborhood developments (good or bad) we should know about?
- What's the average days-on-market for RENTAL listings here right now (not sales)? A rising rental-DOM trend means longer vacancies and softer asking-rent achievability than the comps imply.
- What's the recent tenant-quality profile in this submarket — average credit score on applications, eviction rate, late-payment / NSF rate, and stable-employment percentage? A property-management company in the area should have these aggregated.
- How much new for-sale + rental construction is in the pipeline within 1–3 miles? Heavy new supply typically softens prices + rents 12–24 months out; constrained supply supports both.
Investment metrics
- 1% rule
- 0.93% ✗
- Cap rate
- 6.18%
- Cash-on-cash
- -0.42%
- DSCR
- 0.98
- GRM
- 9.0
CMA / ARV
- ARV (on-the-fly)
- $221,760
- Comps found
- 8
Show comp detail 8 sales within ~0.75 mi
| Address | Dist | Beds/Ba | Sqft | Sold | Price | $/sf | Match |
|---|---|---|---|---|---|---|---|
| 4190 Gator Greens Way #25 | 0.57mi | 3/2.5 | 1,463 (+2%) | 10mo | $260,000 | $178 | 62 |
| 1840 S Dovetail Dr | 0.60mi | 2/2.0 (-1) | 1,437 (-0%) | 9mo | $187,000 | $130 | 57 |
| 120 Lakes End Dr #0 | 0.30mi | 2/2.0 (-1) | 1,296 (-10%) | 16mo | $129,000 | $100 | 49 |
| 1738 W Sanderling Ln #4 | 0.61mi | 2/2.0 (-1) | 1,396 (-3%) | 15mo | $160,000 | $115 | 47 |
| 1794 Sandhill Crane Dr Unit A1 | 0.57mi | 2/2.0 (-1) | 1,335 (-7%) | 9mo | $205,000 | $154 | 46 |
| 828 Timberview Dr Unit D | 0.52mi | 2/2.0 (-1) | 1,280 (-11%) | 10mo | $170,000 | $133 | 42 |
| 1820 Pelican Dr #1 | 0.60mi | 2/2.0 (-1) | 1,335 (-7%) | 21mo | $260,000 | $195 | 35 |
| 1870 S Dovetail A2 Dr #2 | 0.64mi | 2/2.0 (-1) | 1,335 (-7%) | 21mo | $245,000 | $184 | 33 |
Match score weights: distance 35% · size 25% · config 20% · recency 20%. Top-matched comps best support the ARV.
Projected returns pro-forma
-3.0% appreciation · 7.42% rent growth · sell at horizon
- IRR
- -11.8%
- Equity multiple
- 0.55×
- Total profit
- $-27,663
- Equity at exit
- $33,065
- IRR
- 3.2%
- Equity multiple
- 1.28×
- Total profit
- $17,459
- Equity at exit
- $19,174
Cash invested: $62,093 (down + closing). Projections, not guarantees.
Landlord ↔ Tenant lean methodology
- Overall (STATE)
- 87 Strongly Landlord-Friendly
- State Florida
- 87 Strongly Landlord-Friendly · R+3
- County
- — inherits STATE
- City
- — inherits STATE
ZIP-level market 34982
- Home prices YoY
- -33.4%
- Rents YoY
- 7.4%
- Active inventory
- 336
- Price-to-rent
- 9.3×
Monthly cashflow live
- Estimated rent
- $2,054 high interval (Pro) →
- Mortgage (P&I)
- −$1,163
- Tax est. 1.5%
- −$277 /mo · $3,326/yr
- Insurance
- −$92
- HOA
- −$112
- Vacancy / Maint / Mgmt
- −$431
- Net cashflow
- $-22
Break-even live
Sensitivity live
| Price | -10% $132 | -5% $55 | +0% $-22 | +5% $-98 | +10% $-175 |
|---|---|---|---|---|---|
| Rent | -10% $-184 | -5% $-103 | +0% $-22 | +5% $60 | +10% $141 |
| Rate | -1.0pp $90 | -0.5pp $35 | base $-22 | +0.5pp $-79 | +1.0pp $-137 |
UW: 25.0% down · 7.5% · 30yr · 1.5% tax · 5.0% vac · 8.0% maint · 8.0% mgmt
Financing live
Cash to close
- Down payment
- $55,440
- Closing costs
- $6,653
- Reserves months
- —
- Total cash needed
- —
Loan-product check · same deal, 3 products live
Conventional
25% down · 7.5% · 30yr
- Down + closing
- —
- Monthly P&I
- —
- Monthly cashflow
- —
- DSCR
- —
- Eligible?
- —
Personal DTI + credit; lowest rate.
DSCR
20% down · 8.5% · 30yr
- Down + closing
- —
- Monthly P&I
- —
- Monthly cashflow
- —
- DSCR
- —
- Eligible?
- —
No personal income docs; deal must DSCR.
Hard money
10% down · 12.0% · 12mo
- Down + closing
- —
- Monthly P&I
- —
- Monthly cashflow
- —
- DSCR
- —
- Eligible?
- —
Short-term bridge; refi at stabilization.
Rent comps 20 comps
| Address | Beds | Baths | Sqft | Rent | $/sqft | DOM | Units | Dist |
|---|---|---|---|---|---|---|---|---|
| 1219 S Lakes End Dr Unit 2 Fort Pierce, FL | 2.0 | 2.0 | 1186 | $1,500 | $1.26 | 15d | 1 | 0.36mi |
| 928 Fra Mar Pl Fort Pierce, FL | 3.0 | 1.0 | 1440 | $2,000 | $1.39 | 25d | 1 | 0.58mi |
| 916 Savannas Point Dr Fort Pierce, FL | 2.0 | 2.0 | 1120 | $2,100 | $1.88 | 15d | 1 | 0.61mi |
| 4166 Gator Trace Villas Cir Unit B Fort Pierce, FL | 3.0 | 2.0 | 1336 | $2,200 | $1.65 | 25d | 1 | 0.61mi |
| 1829 Sandhill Crane Dr Unit B2 Fort Pierce, FL | 2.0 | 2.0 | 1334 | $2,000 | $1.50 | 25d | 1 | 0.63mi |
| 802 N Lake Dr Unit B Fort Pierce, FL | 2.0 | 1.0 | 1000 | $1,550 | $1.55 | 25d | 1 | 0.69mi |
| 4215 Gator Trace Ave Unit G Fort Pierce, FL | 2.0 | 2.0 | 1200 | $2,200 | $1.83 | 25d | 1 | 0.72mi |
| 1739 N Dovetail Dr Fort Pierce, FL | 2.0 | 2.0 | 1230 | $1,750 | $1.42 | 25d | 1 | 0.77mi |
| 1747 N Dovetail Dr Unit A Fort Pierce, FL | 2.0 | 2.0 | 1286 | $2,100 | $1.63 | 25d | 1 | 0.79mi |
| 1804 Blue Heron Ln Unit C Fort Pierce, FL | 2.0 | 2.0 | 1286 | $1,900 | $1.48 | 25d | 1 | 0.81mi |
| 1772 N Dovetail Dr Unit C Fort Pierce, FL | 2.0 | 2.0 | 1230 | $2,100 | $1.71 | 25d | 1 | 0.84mi |
| 4003 Oleander Ave Fort Pierce, FL | 3.0–4.0 | 2.0 | 1765 | $2,748 | $1.56 | 15d | 1 | 0.92mi |
| 800 Kanner Dr Unit B Fort Pierce, FL | 2.0 | 1.0 | 900 | $1,550 | $1.72 | 15d | 1 | 0.92mi |
| 3200 S US Highway 1 Fort Pierce, FL | 2.0–3.0 | 1.0–2.0 | 1144 | $1,945 | $1.70 | 15d | 1 | 0.92mi |
| 3030 S US Highway 1 Fort Pierce, FL | 3.0 | 2.0 | 1184 | $1,774 | $1.50 | 15d | 1 | 1.05mi |
| 4210 Gator Trace Cir Fort Pierce, FL | 2.0 | 2.0 | 1316 | $2,100 | $1.60 | 15d | 1 | 1.13mi |
| 4220 Sunrise Blvd Fort Pierce, FL | 3.0 | 2.0 | 1870 | $10,000 | $5.35 | 25d | 1 | 1.16mi |
| 699 W Weatherbee Rd Fort Pierce, FL | 2.0 | 1.5 | 1100 | $1,875 | $1.70 | 25d | 1 | 1.17mi |
| 3343 Liberty Square Way #104 Fort Pierce, FL | 3.0 | 2.5 | 1638 | $2,300 | $1.40 | 25d | 1 | 1.30mi |
| 2902 Oleander Blvd Fort Pierce, FL | 3.0 | 2.0 | 1276 | $2,700 | $2.12 | 25d | 1 | 1.37mi |
HOA detail
- Monthly dues
- $112 · $1,344/yr
Listing history 17 events
-
2026-06-21days on market $229,990 Active 49 DOM
-
2026-06-18days on market $229,990 Active 46 DOM
-
2026-06-17days on market $229,990 Active 45 DOM
-
2026-06-16days on market $229,990 Active 44 DOM
-
2026-06-15days on market $229,990 Active 43 DOM
-
2026-06-14days on market $229,990 Active 41 DOM
-
2026-06-13days on market $229,990 Active 40 DOM
-
2026-06-10days on market $229,990 Active 38 DOM
-
2026-06-09days on market $229,990 Active 37 DOM
-
2026-06-08days on market $229,990 Active 36 DOM
-
2026-06-07days on market $229,990 Active 35 DOM
-
2026-06-05pricedays on market $229,990 Active 32 DOM
-
2026-06-03days on market $239,990 Active 31 DOM
-
2026-06-02days on market $239,990 Active 30 DOM
-
2026-06-01days on market $239,990 Active 29 DOM
-
2026-05-31days on market $239,990 Active 28 DOM
-
2026-05-30days on market $239,990 Active 27 DOM
ⓘ Source: listings_history table (triggers on properties + properties_extension) + one-shot
backfill from property_details.listing_events for pre-trigger history.
Nearby sold comps map
Loading sold comps map…
Walkable amenities ~0.75 mi
Loading nearby amenities…
Taxation est. · year 1
- Rental income
- $24,653
- − Mortgage interest
- −$12,422
- − Property taxes
- −$3,326
- − Insurance
- −$1,109
- − Repairs & maintenance
- −$1,972
- − Management
- −$1,972
- − HOA
- −$1,344
- − Depreciation
- −$6,451
- Taxable loss
- −$3,944
- Est. tax savings @ 24.0%
- +$946
- After-tax cash flow
- $688/yr
For passive investors: Depreciation is non-cash, so a rental often shows a tax loss while cash-flowing — sheltering income. Rental losses are passive: they offset passive income freely, and up to $25,000/yr can offset ordinary (W-2) income if you actively participate and your MAGI is under $100k (phasing out to $0 by $150k); unused losses carry forward. On sale, claimed depreciation is recaptured at up to 25%, and gains may owe capital-gains tax (a 1031 exchange can defer both). Figures are a year-1 estimate at your 24.0% rate — not tax advice; consult a CPA.
Condition & rehab AI · 6 photos
This Flamingo plan townhouse is in good condition with a fresh exterior and modern interior. It offers a good starting point for potential buyers or renters, with minor updates that can significantly enhance its value.
Value-add opportunities
- Resale Paint exterior siding — Fresh paint can enhance curb appeal and home value.
- Both Replace carpet with hardwood flooring — Hardwood flooring is more durable and can increase both resale and rental value.
- Both Install smart home automation — Smart home features can increase both resale and rental appeal by adding modern conveniences.
Renovation cost estimate screening
Value-add ROI direction
- Resale Paint exterior siding — Fresh paint can enhance curb appeal and home value. ↑
- Both Replace carpet with hardwood flooring — Hardwood flooring is more durable and can increase both resale and rental value. ↑
- Both Install smart home automation — Smart home features can increase both resale and rental appeal by adding modern conveniences. ↑
ⓘ Cost ranges are severity-bucket heuristics (US national rule-of-thumb). Get contractor quotes + a written scope before underwriting a rehab budget.
Schools (NCES district)
- District
- St. Lucie
- NCES district ID
- 1201770
- Math proficiency
- 40% ▼ -11.00%
- Reading proficiency
- 48% ▼ -4.00%
- Median HH income
- $44,737
- Composite
- 37.28/100
- National rank
- #4449
- State rank
- #51 of 73 in FL
Livability — Fort Pierce
- Score
- 76/100
- State rank
- #226
- US rank
- #3360
Category grades
Schools grade is shown separately in the Schools card above.
Census & demographics
- Census place
- Fort Pierce, FL
- County
- Saint Lucie County · 337,150 people
- City population
- 78,556
- Metro
- Port St. Lucie, FL
- Population (ZIP)
- 31,143
- Household income
- $54,082
- Rent vs Own
- Severe rent burden
- 1086.0
Population outlook (St. Lucie County) Hauer SSP2
- Today (2025)
- 338,016 people
- By 2030
- 355,687 · +5.2%
- By 2040
- 385,521 · +14.1%
- By 2050
- 406,106 · +20.1%
- By 2075
- 441,054 · +30.5%
- By 2100
- 436,885 · +29.2%
Race, ethnicity, and origin ACS 2023
- Neighborhood character
- Majority White (62%)
- Race & ethnicity
- White 62% Hispanic / Latino 22% Two or more races 12% Black 12%
- Hispanic origin (detail)
- Mexican 10% Puerto Rican 3% Cuban 3%
- Common ancestry
- Italian 7% Hispanic 2% Lithuanian 1%
- Foreign-born
- 12% · Canada
- Languages at home
- 80% English-only · Spanish 16% French/Haitian/Cajun 3%
Political lean MEDSL · St. Lucie
- 2024 margin
- Lean R (+9.1) · D 45.1% · R 54.2%
- 2008→2024 swing
- -21.2pp toward R · 2008: 12.1pp · 2024: -9.1pp
- All cycles
- 2024: R+9.1 2020: R+1.6 2016: R+2.5 2012: D+7.9 2008: D+12.1
Not yet ingested
- Civics
- —
Market trends
- HPI YoY
- ▼ -199.47%
- Current HPI
- 397.2649
- Rent YoY
- ▲ 7.42%
- Metro
- Port St. Lucie, FL
- State GDP YoY
- ▲ 3.28%
- F500 in state
- 36
Industry mix (Fortune 500 HQ in FL)
| Industry | F500 HQs | Revenue |
|---|---|---|
| Industrial Technology | 2 | $29B |
|
||
| Insurance | 2 | $17B |
|
||
| Retail | 1 | $60B |
|
||
| Technology Distribution | 1 | $58B |
|
||
| Homebuilding | 1 | $35B |
|
||
| Technology Manufacturing | 1 | $35B |
|
||
Cash-flow waterfall
monthlySold comps — $/sqft
last 12 mo · ≤1 miLoading sold comps…