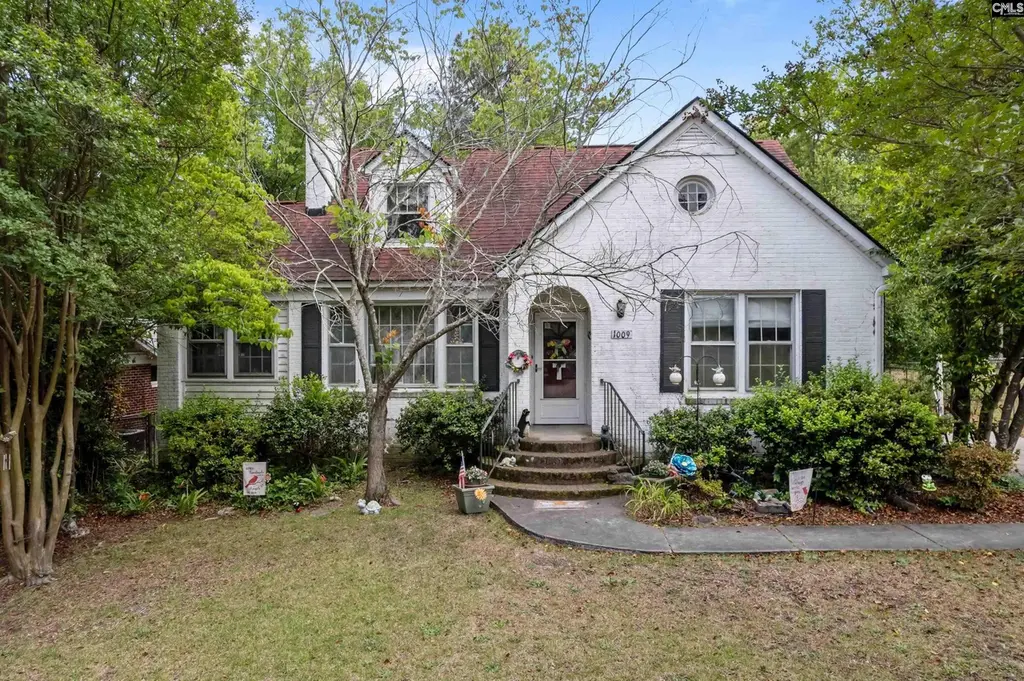
1009 Lafayette Ave · Cayce, SC
Flood risk 1/10 · Minimal
- FEMA flood zone
- X (unshaded)
- Chance of flooding over 30 yrs
- 0.0%
- Est. flood insurance / yr
- $507 – $1,088
Fire risk 1/10 · Minimal
- Est. fire insurance / yr
- $783 – $1,453
Heat risk 7/10 · Major
- Hot days now (above 108°F)
- 7 days/yr
- Hot days in 30 yrs
- 16 days/yr
Wind risk 6/10 · Moderate
- Chance of severe wind over 30 yrs
- 67.0%
Air-quality risk 3/10 · Minor
- Unhealthy air days now
- 2 days/yr
- Unhealthy air days in 30 yrs
- 2 days/yr
Risk factors via First Street. Map © Google.
Why this score? — see what drove the D grade
The composite is a weighted blend of 9 inputs, each scored 0–100. Each bar is that input's sub-score; the figure is the points it added to the 100-point composite (weight × sub-score).
- Cash flow +15.8/30.0
- ARV discount +7.5/15.0
- DSCR +4.9/10.0
- Livability +3.6/5.0
- 1% rule +3.0/10.0
- Rent growth +3.0/5.0
- Schools +2.9/10.0
- Condition / age +2.5/5.0
- Appreciation +0.0/10.0
$300,000
🖨 Deal sheet (PDF) 📄 Offer letter ✓ Due diligence
Listing remarks
Nestled in the heart of The Avenues, this charming 4-bedroom, 2-bath home at 1009 Lafayette Avenue offers timeless character and endless potential. Filled with original charm, the home features a formal dining room, a spacious living room with built-in bookcases and a cozy fireplace, and a bright sunroom perfect for relaxing or entertaining. The primary bedroom is conveniently located on the main floor along with a second bedroom, while upstairs offers additional two bedrooms along with a versatile sitting area ideal for a reading nook, office, or play space. From the classic details to the inviting layout, this home is ready for you to make it your own. Enjoy an unbeatable location just mi
Key facts
- Formal dining room
- Built-in bookcases
- Cozy fireplace
Tags
Property features AI
Finance
- Other:
- Financial info:
- HOA & community:
Exterior
- Parking:
- Security:
- Utilities: Public water; Public sewer
- Home design: Brick exterior above foundation
- Construction: Crawlspace foundation
- Exterior features: Shed; Partial yard fencing; Paved road access
Interior
- Kitchen: Counter cooktop; Microwave above stove; Refrigerator; Dishwasher
- Bedrooms: Master bedroom on main level with ceiling fan and hardwood floors; Second bedroom on main level with ceiling fan and hardwood floors; Third bedroom on second level with ceiling fan and parquet floors; Fourth bedroom on second level with ceiling fan and parquet floors
- Flooring: Hardwood floors in primary living areas and some bedrooms; Parquet flooring in upper-level bedrooms; Tile flooring in kitchen
- Bathrooms: Two full bathrooms, including one full main-level bath
- Heating & cooling: Central heating; Central air conditioning
- Interior features: Bookshelves in living room; Fireplace with natural gas log; Eat-in kitchen with Formica countertops and tile floor; Florida room; Loft
- Laundry & utility: Washer and dryer; Laundry located in closet off kitchen
Neighborhood map
What this means for you Summary
Snapshot
- This is a 4-bed/2.0-bath single-family listed at $300k.
Deal economics
- At list price, monthly cash flow is $138 ($2k/yr) — positive.
- The deal already cash-flows at list — no discount required.
- To meet the 1% rule (rent ≥ 1% of price), the offer needs to be $240k (20.1% below list).
- Recommended offer: $240k (20.1% below list) — sets the bar for 1% rule.
Location & tenants
- Location reads 71/100 on livability (#55 in SC) — a middle-class / working-renter tenant base. Strengths: cost of living A+, housing A+, health & safety A+; Watch: employment D+, crime F, commute F.
- Lexington 02 (suburban): math 30% / reading 38% proficiency, ranked #45 of 80 in SC (top 56%) — families likely to look elsewhere, expect single-tenant / working-renter base with shorter leases.
- Zoned schools: Cayce Elementary (math 24% / reading 22%, grade F, #469 of 597 statewide, top 79%, 998 students, 100% FRL); Cyril B. Busbee Creative Arts Academy (math 24% / reading 28%, grade F, #159 of 229 statewide, top 70%, 420 students, 100% FRL); Brookland-Cayce High (math 32% / reading 77%, grade C-, #130 of 196 statewide, top 69%, 1,171 students, 100% FRL) — zoned schools average 100% FRL vs 59% district-wide (41 pts higher); higher-poverty schools than district average — tighter screening recommended.
- Market conditions: Rents rising (+2.0%/yr); 77 active listings in the ZIP; 6 comparable units currently listed for rent nearby; rentals at typical pace (median 25d on market — plan ~3-4 weeks tenant-placement turnaround); 1,712 units permitted in Lexington County in 2024 (0 in 5+ unit buildings).
- At $2,398/mo this rent would consume 47% of the median local household income ($61k/yr) (locally 425% of renters already pay >50% of income on rent) — very limited rent-growth headroom before tenants either downsize or default.
Forward outlook
- Local home prices are declining (-3.0%/yr); year-one equity from $2k of loan paydown is wiped out by about $9k of value loss. Plan a longer hold.
- Lexington County population projected at +26% by 2050 — long-run rental-demand tailwind backs the buy-and-hold thesis.
Negotiation context
- It's been on market 34 days — a 3% lower offer ($291k) is reasonable based on typical stale-listing flexibility.
- Current owner paid $95k; list at $300k implies a 216% gain — meaningful room to come down on a strong offer.
Risks & watch-outs
- Watch-outs: built in 1950 — expect roof / HVAC / electrical / plumbing capex.
- Climate carrying-cost: major wind risk, 67% chance of damaging wind over 30y; extreme-heat days projected 7→16/yr by 2055 (HVAC capex compounding) — expect insurance premiums to compound above CPI over the hold.
Questions for the listing agent
- It's been on market 34 days. Have you received any prior offers? Is the seller open to a 20% concession, seller financing, or rate buy-down credit?
- Built in 1950 — when were the roof, HVAC, electrical panel, plumbing, and water heater last replaced?
- Is there a deadline driving the sale (1031 exchange, divorce, estate, relocation)? That informs how much negotiation room exists.
- Schools are D-rated, which usually means shorter tenancies and higher turnover. Who's the typical renter profile here, and what's been the actual vacancy rate?
- Crime grade is F in this area — have there been break-ins, vandalism, or insurance claims at this property in the last 3 years? What carrier currently insures it and at what premium?
- The area grade is low — what's the realistic commute time and amenity access for the typical tenant pool here? Any planned neighborhood developments (good or bad) we should know about?
- What's the average days-on-market for RENTAL listings here right now (not sales)? A rising rental-DOM trend means longer vacancies and softer asking-rent achievability than the comps imply.
- What's the recent tenant-quality profile in this submarket — average credit score on applications, eviction rate, late-payment / NSF rate, and stable-employment percentage? A property-management company in the area should have these aggregated.
- How much new for-sale + rental construction is in the pipeline within 1–3 miles? Heavy new supply typically softens prices + rents 12–24 months out; constrained supply supports both.
Investment metrics
- 1% rule
- 0.80% ✗
- Cap rate
- 6.85%
- Cash-on-cash
- 1.98%
- DSCR
- 1.09
- GRM
- 10.4
CMA / ARV
No comps found within radius.
Projected returns pro-forma
-3.0% appreciation · 2.04% rent growth · sell at horizon
- IRR
- -14.2%
- Equity multiple
- 0.50×
- Total profit
- $-42,248
- Equity at exit
- $44,731
- IRR
- -6.9%
- Equity multiple
- 0.58×
- Total profit
- $-35,313
- Equity at exit
- $25,939
Cash invested: $84,000 (down + closing). Projections, not guarantees.
Landlord ↔ Tenant lean methodology
- Overall (STATE)
- 90 Strongly Landlord-Friendly
- State South Carolina
- 90 Strongly Landlord-Friendly · R+6
- County
- — inherits STATE
- City
- — inherits STATE
ZIP-level market 29033
- Home prices YoY
- -12.2%
- Rents YoY
- 2.0%
- Active inventory
- 77
- Price-to-rent
- 10.4×
Monthly cashflow live
- Estimated rent
- $2,398 high interval (Pro) →
- Mortgage (P&I)
- −$1,573
- Tax from tax record
- −$58 /mo · $695/yr
- Insurance
- −$125
- HOA
- −$0
- Vacancy / Maint / Mgmt
- −$504
- Net cashflow
- $138
Break-even live
Sensitivity live
| Price | -10% $308 | -5% $223 | +0% $138 | +5% $54 | +10% $-31 |
|---|---|---|---|---|---|
| Rent | -10% $-51 | -5% $44 | +0% $138 | +5% $233 | +10% $328 |
| Rate | -1.0pp $290 | -0.5pp $215 | base $138 | +0.5pp $61 | +1.0pp $-18 |
UW: 25.0% down · 7.5% · 30yr · 1.5% tax · 5.0% vac · 8.0% maint · 8.0% mgmt
Financing live
Cash to close
- Down payment
- $75,000
- Closing costs
- $9,000
- Reserves months
- —
- Total cash needed
- —
Loan-product check · same deal, 3 products live
Conventional
25% down · 7.5% · 30yr
- Down + closing
- —
- Monthly P&I
- —
- Monthly cashflow
- —
- DSCR
- —
- Eligible?
- —
Personal DTI + credit; lowest rate.
DSCR
20% down · 8.5% · 30yr
- Down + closing
- —
- Monthly P&I
- —
- Monthly cashflow
- —
- DSCR
- —
- Eligible?
- —
No personal income docs; deal must DSCR.
Hard money
10% down · 12.0% · 12mo
- Down + closing
- —
- Monthly P&I
- —
- Monthly cashflow
- —
- DSCR
- —
- Eligible?
- —
Short-term bridge; refi at stabilization.
Rent comps 6 comps
| Address | Beds | Baths | Sqft | Rent | $/sqft | DOM | Units | Dist |
|---|---|---|---|---|---|---|---|---|
| 941 Evergreen Ave Cayce, SC | 4.0 | 2.0 | 1652 | $2,200 | $1.33 | 16d | 1 | 0.48mi |
| 901 Center St West Columbia, SC | 3.0 | 1.0 | 1348 | $1,795 | $1.33 | 25d | 1 | 0.84mi |
| 1110 Slann Dr Cayce, SC | 5.0 | 3.0 | 1904 | $3,749 | $1.97 | 25d | 1 | 0.85mi |
| 609 Center St West Columbia, SC | 4.0 | 2.0 | 1600 | $2,800 | $1.75 | 25d | 1 | 0.98mi |
| 2307 Vine St Cayce, SC | 3.0 | 2.0 | 1636 | $1,950 | $1.19 | 4d | 1 | 0.99mi |
| 2307 Vine St Cayce, SC | 3.0 | 2.0 | 1636 | $1,950 | $1.19 | 13d | 1 | 0.99mi |
Listing history 11 events
-
2026-06-21days on market $300,000 Active 34 DOM
-
2026-06-18days on market $300,000 Active 31 DOM
-
2026-06-17days on market $300,000 Active 30 DOM
-
2026-06-16days on market $300,000 Active 29 DOM
-
2026-06-15days on market $300,000 Active 28 DOM
-
2026-06-14days on market $300,000 Active 26 DOM
-
2026-06-13days on market $300,000 Active 25 DOM
-
2026-06-10statusdays on market $300,000 Active 23 DOM
-
2026-05-14historical Active - Contingent
-
2026-05-07$300,000 Active
-
1995-06-01soldstatus $95,000
ⓘ Source: listings_history table (triggers on properties + properties_extension) + one-shot
backfill from property_details.listing_events for pre-trigger history.
Tax reassessment forecast SC · Resets to sale price
- Current annual tax
- $695 · $58/mo
- Projected year-2 tax
- $1,710 · $142/mo
- Expected delta
- +$1,015/yr (+$85/mo · 146.0%)
ⓘ Screening estimate from a state-policy table — verify with the county assessor before closing.
Climate risk First Street
- Flood 1/10 Low FEMA zone X (unshaded) · 0% chance over 30 yrs
- Wildfire 1/10 Low
- Heat 7/10 Severe 7 d/yr ≥108°F today · 16 d/yr by 30 yrs out
- Wind 6/10 Major 67% chance of damaging wind over 30 yrs
- Air quality 3/10 Moderate 2 unhealthy d/yr today · 2 by 30 yrs out
Nearby sold comps map
Loading sold comps map…
Walkable amenities ~0.75 mi
Loading nearby amenities…
Taxation est. · year 1
- Rental income
- $28,779
- − Mortgage interest
- −$16,805
- − Property taxes
- −$695
- − Insurance
- −$1,500
- − Repairs & maintenance
- −$2,302
- − Management
- −$2,302
- − Depreciation
- −$8,727
- Taxable loss
- −$3,553
- Est. tax savings @ 24.0%
- +$853
- After-tax cash flow
- $2,514/yr
For passive investors: Depreciation is non-cash, so a rental often shows a tax loss while cash-flowing — sheltering income. Rental losses are passive: they offset passive income freely, and up to $25,000/yr can offset ordinary (W-2) income if you actively participate and your MAGI is under $100k (phasing out to $0 by $150k); unused losses carry forward. On sale, claimed depreciation is recaptured at up to 25%, and gains may owe capital-gains tax (a 1031 exchange can defer both). Figures are a year-1 estimate at your 24.0% rate — not tax advice; consult a CPA.
Schools (NCES district)
- District
- Lexington 02
- NCES district ID
- 4502730
- Math proficiency
- 30% ▼ -6.00%
- Reading proficiency
- 38% ▬ 0.00%
- Median HH income
- $42,532
- Composite
- 28.78/100
- National rank
- #6669
- State rank
- #45 of 80 in SC
Livability — Cayce
- Score
- 71/100
- State rank
- #55
- US rank
- #7173
Category grades
Schools grade is shown separately in the Schools card above.
Census & demographics
- Census place
- Cayce, SC
- County
- Lexington County · 232,571 people
- City population
- 12,837
- Metro
- Columbia, SC
- Population (ZIP)
- 12,837
- Household income
- $61,237
- Rent vs Own
- Severe rent burden
- 425.0
Population outlook (Lexington County) Hauer SSP2
- Today (2025)
- 322,999 people
- By 2030
- 342,356 · +6.0%
- By 2040
- 377,715 · +16.9%
- By 2050
- 406,984 · +26.0%
- By 2075
- 465,447 · +44.1%
- By 2100
- 485,674 · +50.4%
Race, ethnicity, and origin ACS 2023
- Neighborhood character
- Diverse neighborhood (Simpson 0.59)
- Race & ethnicity
- White 57% Black 28% Hispanic / Latino 10% Two or more races 9% Asian 3%
- Hispanic origin (detail)
- Mexican 4%
- Common ancestry
- Serbian 3% Iranian 2% Italian 2%
- Foreign-born
- 6% · Canada, China, South Korea
- Languages at home
- 91% English-only · Spanish 6% Other Indo-European 1%
Political lean MEDSL · Lexington
- 2024 margin
- Solid R (+33.5) · D 32.5% · R 66.0% · Other 1.4%
- 2008→2024 swing
- +4.6pp toward D · 2008: -38.0pp · 2024: -33.5pp
- All cycles
- 2024: R+33.5 2020: R+30.1 2016: R+36.7 2012: R+37.8 2008: R+38.0
Not yet ingested
- Civics
- —
Market trends
- HPI YoY
- ▼ -39.93%
- Current HPI
- 288.7749
- Rent YoY
- ▲ 2.04%
- Metro
- Columbia, SC
- State GDP YoY
- ▲ 4.51%
- F500 in state
- 2
Industry mix (Fortune 500 HQ in SC)
| Industry | F500 HQs | Revenue |
|---|---|---|
| Packaging | 1 | $7B |
|
||
Price history
+215.8% since first listed3 events — show timeline
- 2026-05-14 Contingent — Consolidated MLS
- 2026-05-07 Listed $300,000 Consolidated MLS
- 1995-06-01 Sold (Public Records) $95,000 Public Records
Property tax history
-9.3%/yrLatest (2024): $695 · +7.3% YoY. Source: county tax records.
Cash-flow waterfall
monthlySold comps — $/sqft
last 12 mo · ≤1 miLoading sold comps…