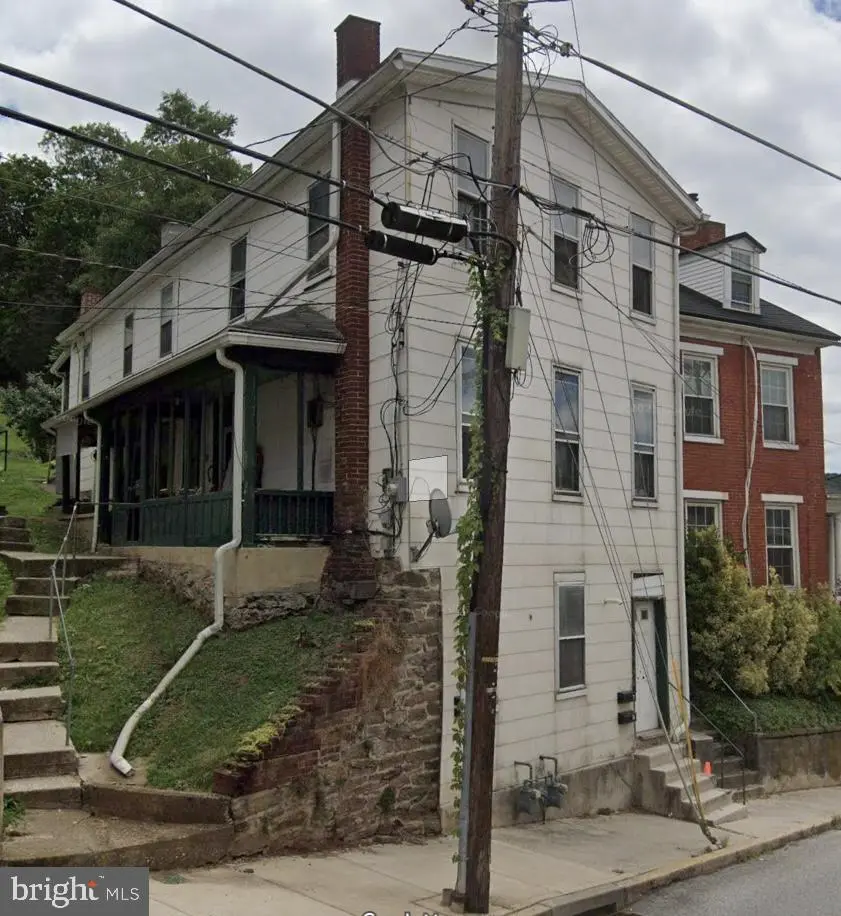
7 Church St · Glen Rock, PA
Flood risk 9/10 · Severe
- FEMA flood zone
- X (unshaded)
- Chance of flooding over 30 yrs
- 0.99%
- Est. flood insurance / yr
- $473 – $860
Fire risk 3/10 · Minor
- Est. fire insurance / yr
- $511 – $949
Heat risk 6/10 · Moderate
- Hot days now (above 100°F)
- 7 days/yr
- Hot days in 30 yrs
- 16 days/yr
Wind risk 4/10 · Minor
- Chance of severe wind over 30 yrs
- 11.0%
Air-quality risk 3/10 · Minor
- Unhealthy air days now
- 2 days/yr
- Unhealthy air days in 30 yrs
- 4 days/yr
Risk factors via First Street. Map © Google.
Why this score? — see what drove the C grade
The composite is a weighted blend of 9 inputs, each scored 0–100. Each bar is that input's sub-score; the figure is the points it added to the 100-point composite (weight × sub-score).
- Cash flow +18.7/30.0
- ARV discount +12.6/15.0
- DSCR +5.9/10.0
- 1% rule +5.2/10.0
- Schools +4.3/10.0
- Livability +3.5/5.0
- Rent growth +2.5/5.0
- Condition / age +2.5/5.0
- Appreciation +0.0/10.0
$175,000
🖨 Deal sheet (PDF) 📄 Offer letter ✓ Due diligence
Listing remarks MLS
Rare opportunity for investors! With the right vision, this property could be transformed into a 2- or 3-unit rental, unlocking strong rental income potential. Most materials needed to complete the renovation are included in the sale and already in the home, making this a solid option for investors seeking their next profitable project.
Key facts
- Built 1920
- Listed 156 days
Neighborhood map
What this means for you Summary
Snapshot
- This is a 5-bed/2.0-bath townhouse listed at $175k.
Deal economics
- At list price, monthly cash flow is $116 ($1k/yr) — positive.
- The deal already cash-flows at list — no discount required.
- Meets the 1% rule at list price ($2k rent vs $175k).
- Recommended offer: $154k (12.0% below list) — sets the bar for market timing.
Location & tenants
- Location reads 70/100 on livability (#765 in PA) — a middle-class / working-renter tenant base. Strengths: crime A+, cost of living A+, housing A+; Watch: amenities F, commute F, employment D-.
- Southern York County SD (rural): math 39% / reading 58% proficiency, ranked #168 of 539 in PA (top 31%) — families likely to look elsewhere, expect single-tenant / working-renter base with shorter leases; only 18% free/reduced lunch — higher-income household profile.
- Zoned schools: Friendship El Sch (math 32% / reading 52%, grade F, #883 of 1,518 statewide, top 61%, 408 students, 36% FRL); Southern Ms (math 20% / reading 54%, grade F, #298 of 512 statewide, top 60%, 441 students, 26% FRL); Susquehannock Hs (math 69% / reading 24%, grade D-, #173 of 437 statewide, top 40%, 928 students, 23% FRL).
- Market conditions: 44 active listings in the ZIP; 1,328 units permitted in York County in 2024 (338 in 5+ unit buildings).
Forward outlook
- Local home prices are declining (-3.0%/yr); year-one equity from $1k of loan paydown is wiped out by about $5k of value loss. Plan a longer hold.
Negotiation context
- It's been on market 156 days — a 12% lower offer ($154k) is reasonable based on typical stale-listing flexibility.
- 2 sale attempts with the ask held roughly flat each time — persistent listings suggest the price (not the market) is what's stuck; bring a comps-based counter.
- Current owner paid $25k; list at $175k implies a 600% gain — meaningful room to come down on a strong offer.
Risks & watch-outs
- Watch-outs: flood insurance adds $56/mo; built in 1920 — expect roof / HVAC / electrical / plumbing capex.
- Climate carrying-cost: severe flood risk; extreme-heat days projected 7→16/yr by 2055 (HVAC capex compounding) — expect insurance premiums to compound above CPI over the hold.
Questions for the listing agent
- It's been on market 156 days. Have you received any prior offers? Is the seller open to a 12% concession, seller financing, or rate buy-down credit?
- Built in 1920 — when were the roof, HVAC, electrical panel, plumbing, and water heater last replaced?
- What's the actual annual flood-insurance premium (NFIP or private), and is the property in a SFHA with mandatory coverage?
- Why hasn't it sold? Are there any deal-killer items the seller is aware of (foundation, flood, title, zoning, code violations)?
- Is there a deadline driving the sale (1031 exchange, divorce, estate, relocation)? That informs how much negotiation room exists.
- Schools are B-rated — typically a magnet for longer-tenancy family renters. What's the average tenant stay here, and is there a school-zone premium baked into asking?
- What's the average days-on-market for RENTAL listings here right now (not sales)? A rising rental-DOM trend means longer vacancies and softer asking-rent achievability than the comps imply.
- What's the recent tenant-quality profile in this submarket — average credit score on applications, eviction rate, late-payment / NSF rate, and stable-employment percentage? A property-management company in the area should have these aggregated.
- How much new for-sale + rental construction is in the pipeline within 1–3 miles? Heavy new supply typically softens prices + rents 12–24 months out; constrained supply supports both.
Investment metrics
- 1% rule
- 1.02% ✓
- Cap rate
- 7.47%
- Cash-on-cash
- 4.20%
- DSCR
- 1.19
- GRM
- 8.2
CMA / ARV
- ARV (median comp)
- $197,505
- List price
- $175,000
- Delta
- -11.39%
- Verdict
- UNDERPRICED
- Comps
- 3 within 1.0 mi
Show comp detail 1 sale within ~0.75 mi
| Address | Dist | Beds/Ba | Sqft | Sold | Price | $/sf | Match |
|---|---|---|---|---|---|---|---|
| 5 Church St | 0.01mi | 4/2.5 (-1) | 2,218 (-7%) | 3mo | $290,000 | $131 | 78 |
Match score weights: distance 35% · size 25% · config 20% · recency 20%. Top-matched comps best support the ARV.
Projected returns pro-forma
-3.0% appreciation · 3.0% rent growth · sell at horizon
- IRR
- -11.8%
- Equity multiple
- 0.57×
- Total profit
- $-20,903
- Equity at exit
- $26,093
- IRR
- -2.5%
- Equity multiple
- 0.83×
- Total profit
- $-8,388
- Equity at exit
- $15,131
Cash invested: $49,000 (down + closing). Projections, not guarantees.
Landlord ↔ Tenant lean methodology
- Overall (STATE)
- 62 Landlord-Friendly
- State Pennsylvania
- 62 Landlord-Friendly · EVEN
- County
- — inherits STATE
- City
- — inherits STATE
ZIP-level market 17327
- Home prices YoY
- -4.9%
- Active inventory
- 44
- Price-to-rent
- 8.2×
Monthly cashflow live
- Estimated rent
- $1,781 medium interval (Pro) →
- Mortgage (P&I)
- −$918
- Tax from tax record
- −$245 /mo · $2,941/yr
- Insurance
- −$73
- Flood insurance flood zone
- −$56 /mo · $666/yr
- HOA
- −$0
- Lot rent
- −$0
- Vacancy / Maint / Mgmt
- −$374
- Net cashflow
- $116
Break-even live
Sensitivity live
| Price | -10% $215 | -5% $165 | +0% $116 | +5% $66 | +10% $17 |
|---|---|---|---|---|---|
| Rent | -10% $-25 | -5% $45 | +0% $116 | +5% $186 | +10% $257 |
| Rate | -1.0pp $204 | -0.5pp $160 | base $116 | +0.5pp $70 | +1.0pp $24 |
UW: 25.0% down · 7.5% · 30yr · 1.5% tax · 5.0% vac · 8.0% maint · 8.0% mgmt
Financing live
Cash to close
- Down payment
- $43,750
- Closing costs
- $5,250
- Reserves months
- —
- Total cash needed
- —
Loan-product check · same deal, 3 products live
Conventional
25% down · 7.5% · 30yr
- Down + closing
- —
- Monthly P&I
- —
- Monthly cashflow
- —
- DSCR
- —
- Eligible?
- —
Personal DTI + credit; lowest rate.
DSCR
20% down · 8.5% · 30yr
- Down + closing
- —
- Monthly P&I
- —
- Monthly cashflow
- —
- DSCR
- —
- Eligible?
- —
No personal income docs; deal must DSCR.
Hard money
10% down · 12.0% · 12mo
- Down + closing
- —
- Monthly P&I
- —
- Monthly cashflow
- —
- DSCR
- —
- Eligible?
- —
Short-term bridge; refi at stabilization.
Listing history 20 events
-
2026-06-22days on market $175,000 Active 156 DOM
-
2026-06-18days on market $175,000 Active 153 DOM
-
2026-06-17days on market $175,000 Active 152 DOM
-
2026-06-16days on market $175,000 Active 151 DOM
-
2026-06-15days on market $175,000 Active 150 DOM
-
2026-06-14days on market $175,000 Active 148 DOM
-
2026-06-13days on market $175,000 Active 147 DOM
-
2026-06-10days on market $175,000 Active 145 DOM
-
2026-06-09days on market $175,000 Active 144 DOM
-
2026-06-08days on market $175,000 Active 143 DOM
-
2026-06-07days on market $175,000 Active 142 DOM
-
2026-06-03days on market $175,000 Active 138 DOM
-
2026-06-02days on market $175,000 Active 137 DOM
-
2026-06-01days on market $175,000 Active 136 DOM
-
2026-05-31days on market $175,000 Active 135 DOM
-
2026-05-30days on market $175,000 Active 134 DOM
-
2026-01-16$175,000 Active 338-char remark
Show marketing remark (338 chars)
Rare opportunity for investors! With the right vision, this property could be transformed into a 2- or 3-unit rental, unlocking strong rental income potential. Most materials needed to complete the renovation are included in the sale and already in the home, making this a solid option for investors seeking their next profitable project.
-
2026-01-03historical
-
2025-12-07$175,000 Active
-
1983-09-01soldstatus $25,000
ⓘ Source: listings_history table (triggers on properties + properties_extension) + one-shot
backfill from property_details.listing_events for pre-trigger history.
Tax reassessment forecast PA · Partial reset (capped growth)
- Current annual tax
- $2,941 · $245/mo
- Projected year-2 tax
- $2,941 · $245/mo
- Expected delta
- $0/yr ($0/mo · 0.0%)
ⓘ Screening estimate from a state-policy table — verify with the county assessor before closing.
Climate risk First Street
- Flood 9/10 Extreme FEMA zone X (unshaded) · 99% chance over 30 yrs
- Wildfire 3/10 Moderate
- Heat 6/10 Major 7 d/yr ≥100°F today · 16 d/yr by 30 yrs out
- Wind 4/10 Moderate 11% chance of damaging wind over 30 yrs
- Air quality 3/10 Moderate 2 unhealthy d/yr today · 4 by 30 yrs out
Nearby sold comps map
Loading sold comps map…
Walkable amenities ~0.75 mi
Loading nearby amenities…
Taxation est. · year 1
- Rental income
- $21,374
- − Mortgage interest
- −$9,803
- − Property taxes
- −$2,941
- − Insurance
- −$1,542
- − Repairs & maintenance
- −$1,710
- − Management
- −$1,710
- − Depreciation
- −$5,091
- Taxable loss
- −$1,422
- Est. tax savings @ 24.0%
- +$341
- After-tax cash flow
- $1,731/yr
For passive investors: Depreciation is non-cash, so a rental often shows a tax loss while cash-flowing — sheltering income. Rental losses are passive: they offset passive income freely, and up to $25,000/yr can offset ordinary (W-2) income if you actively participate and your MAGI is under $100k (phasing out to $0 by $150k); unused losses carry forward. On sale, claimed depreciation is recaptured at up to 25%, and gains may owe capital-gains tax (a 1031 exchange can defer both). Figures are a year-1 estimate at your 24.0% rate — not tax advice; consult a CPA.
Schools (NCES district)
- District
- Southern York County SD
- NCES district ID
- 4222380
- Math proficiency
- 39% ▼ -15.00%
- Reading proficiency
- 58% ▼ -15.00%
- Median HH income
- $70,881
- Composite
- 43.46/100
- National rank
- #3005
- State rank
- #168 of 539 in PA
Livability — Glen Rock
- Score
- 70/100
- State rank
- #765
- US rank
- #7663
Category grades
Schools grade is shown separately in the Schools card above.
Census & demographics
- Census place
- Glen Rock, PA
- Population (ZIP)
- 8,228
Population outlook (York County) Hauer SSP2
- Today (2025)
- 454,205 people
- By 2030
- 457,407 · +0.7%
- By 2040
- 457,529 · +0.7%
- By 2050
- 448,261 · -1.3%
- By 2075
- 427,388 · -5.9%
- By 2100
- 384,218 · -15.4%
Race, ethnicity, and origin ACS 2023
- Neighborhood character
- Predominantly White (92%)
- Race & ethnicity
- White 92% Two or more races 6% Hispanic / Latino 5%
- Common ancestry
- Lithuanian 2% Slovak 2% Romanian 2%
- Foreign-born
- 2% · Canada
- Languages at home
- 97% English-only · Spanish 1% Tagalog/Filipino 1% Other Indo-European 1%
Political lean MEDSL · York
- 2024 margin
- Strong R (+25.3) · D 36.9% · R 62.1%
- 2008→2024 swing
- -11.7pp toward R · 2008: -13.6pp · 2024: -25.3pp
- All cycles
- 2024: R+25.3 2020: R+24.6 2016: R+29.3 2012: R+21.2 2008: R+13.6
Not yet ingested
- Civics
- —
Market trends
- HPI YoY
- ▼ -13.22%
- Current HPI
- 257.102
- Rent YoY
- —
- Metro
- —
- State GDP YoY
- ▲ 1.68%
- F500 in state
- 34
Industry mix (Fortune 500 HQ in PA)
| Industry | F500 HQs | Revenue |
|---|---|---|
| Healthcare | 2 | $309B |
|
||
| Insurance | 2 | $27B |
|
||
| Telecommunications / Media | 1 | $124B |
|
||
| Industrial Distribution | 1 | $22B |
|
||
| Financial Services | 1 | $20B |
|
||
| Chemicals / Materials | 1 | $18B |
|
||
Price history
+600.0% since first listed4 events — show timeline
- 2026-01-16 Listed $175,000 BRIGHT MLS
- 2026-01-03 Listing Removed — BRIGHT MLS
- 2025-12-07 Listed $175,000 BRIGHT MLS
- 1983-09-01 Sold (Public Records) $25,000 Public Records
Property tax history
+1.5%/yrLatest (2025): $2,941 · +0.0% YoY. Source: county tax records.
Cash-flow waterfall
monthlySold comps — $/sqft
last 12 mo · ≤1 miLoading sold comps…