9049 El Cajon Way · Rosemont, CA
Flood risk 1/10 · Minimal
- FEMA flood zone
- X
- Chance of flooding over 30 yrs
- 0.0%
- Est. flood insurance / yr
- $507 – $1,088
Fire risk 4/10 · Minor
- Est. fire insurance / yr
- $659 – $1,223
Heat risk 7/10 · Major
- Hot days now (above 102°F)
- 7 days/yr
- Hot days in 30 yrs
- 15 days/yr
Wind risk 1/10 · Minimal
- Chance of severe wind over 30 yrs
- —
Air-quality risk 10/10 · Severe
- Unhealthy air days now
- 33 days/yr
- Unhealthy air days in 30 yrs
- 38 days/yr
Risk factors via First Street. Map © Google.
Why this score? — see what drove the D grade
The composite is a weighted blend of 9 inputs, each scored 0–100. Each bar is that input's sub-score; the figure is the points it added to the 100-point composite (weight × sub-score).
- Cash flow +16.2/30.0
- ARV discount +7.5/15.0
- DSCR +5.0/10.0
- 1% rule +4.4/10.0
- Schools +3.5/10.0
- Livability +3.4/5.0
- Rent growth +2.4/5.0
- Condition / age +2.2/5.0
- Appreciation +0.0/10.0
$210,000
🖨 Deal sheet 📄 Offer letter ✓ Due diligence
Listing remarks MLS
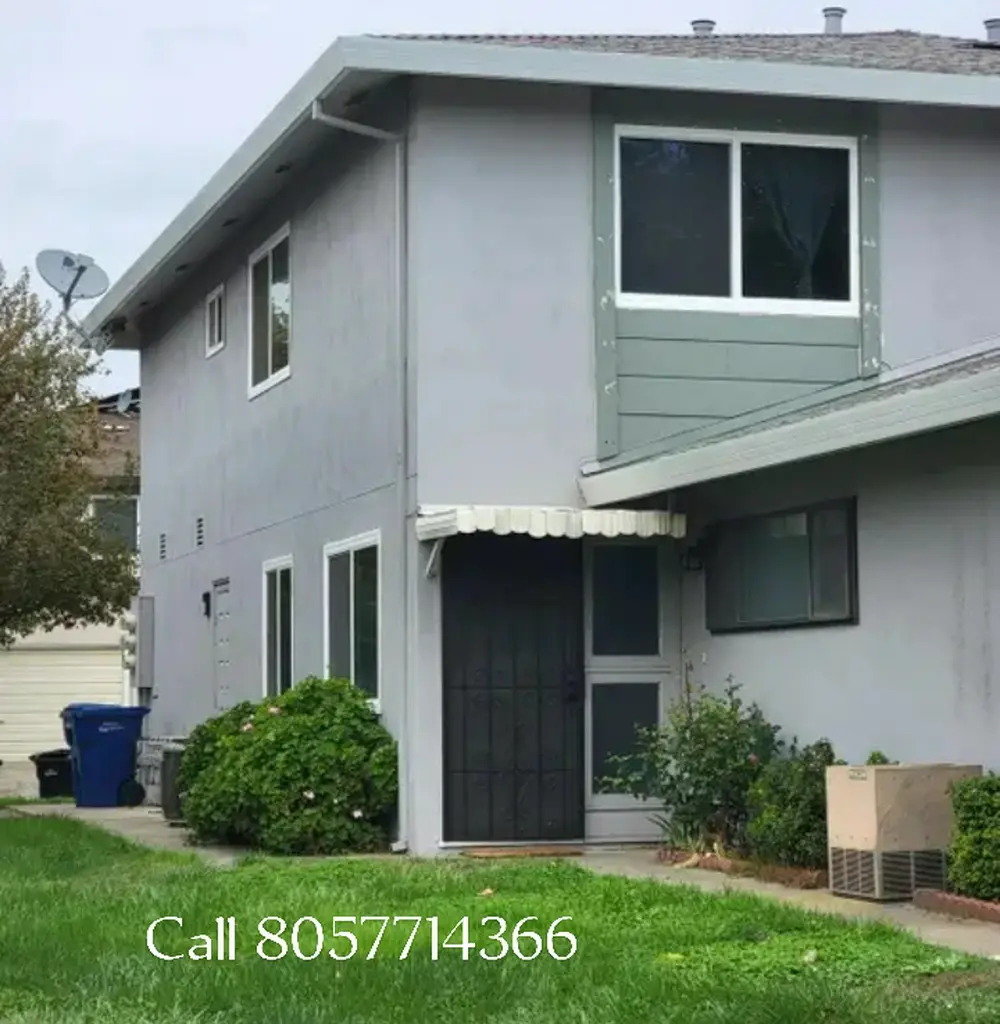
Whether you're a first-time buyer or simply looking for something quaint and low-maintenance, this charming 2-bedroom, 1-bath unit is the perfect find. A beautiful real-brick accent wall adds a stylish, loft-like feel, complimented by updated carpet and newer windows. The home is filled with wonderful natural light throughout. Enjoy the convenience of garage parking in a shared two-car garage, complete with ample storage space. The complex is surrounded by lush green space and mature trees, offering a peaceful, park-like setting. All of this in a fantastic location close to restaurants, shopping, and easy freeway access.
Key facts
- Updated carpet
- Natural light
- Newer windows
Tags
Neighborhood map
What this means for you Summary
Snapshot
- This is a 2-bed/1.0-bath condo listed at $210k. Condition is rated fair.
Deal economics
- At list price, monthly cash flow is $112 ($1k/yr) — positive.
- The deal already cash-flows at list — no discount required.
- To meet the 1% rule (rent ≥ 1% of price), the offer needs to be $198k (5.8% below list).
- Recommended offer: $185k (12.0% below list) — sets the bar for market timing.
- Cap rate 6.9% vs local median 3.6% in Rosemont — top-decile yield for the area; either an underpriced asset or a hidden risk that comps aren't pricing in. Stress-test before assuming the spread holds.
Location & tenants
- Location reads 67/100 on livability (#317 in CA) — a middle-class / working-renter tenant base. Strengths: schools A+, housing A+, employment A; Watch: crime F, amenities F, commute F.
- Sacramento City Unified (urban): math 32% / reading 43% proficiency, ranked #804 of 1,400 in CA (top 57%) — families likely to look elsewhere, expect single-tenant / working-renter base with shorter leases; 63% free/reduced lunch — lower-income household profile, screen leases tightly.
- Market conditions: Rents soft (-0.3%/yr); 123 active listings in the ZIP; solid renter incomes; 6,825 units permitted in Sacramento County in 2024 (1,752 in 5+ unit buildings).
Forward outlook
- Local home prices are declining (-3.0%/yr); year-one equity from $1k of loan paydown is wiped out by about $6k of value loss. Plan a longer hold.
- Sacramento County population projected at +17% by 2050 — long-run rental-demand tailwind backs the buy-and-hold thesis.
Negotiation context
- It's been on market 208 days — a 12% lower offer ($185k) is reasonable based on typical stale-listing flexibility.
- 2 sale attempts since 2y ago with the ask held roughly flat each time — persistent listings suggest the price (not the market) is what's stuck; bring a comps-based counter.
Risks & watch-outs
- Climate carrying-cost: extreme-heat days projected 7→15/yr by 2055 (HVAC capex compounding) — expect insurance premiums to compound above CPI over the hold.
Questions for the listing agent
- It's been on market 208 days. Have you received any prior offers? Is the seller open to a 12% concession, seller financing, or rate buy-down credit?
- Have any recent inspections been done? Can we get a copy of the seller's disclosures and any deferred-maintenance estimates?
- Any open or pending special assessments — roof, HVAC, plumbing, elevator, façade? What's the per-unit balance and payoff schedule, and is the seller paying it off at close or rolling it to the buyer?
- Why hasn't it sold? Are there any deal-killer items the seller is aware of (foundation, flood, title, zoning, code violations)?
- Is there a deadline driving the sale (1031 exchange, divorce, estate, relocation)? That informs how much negotiation room exists.
- Schools are A-rated — typically a magnet for longer-tenancy family renters. What's the average tenant stay here, and is there a school-zone premium baked into asking?
- Crime grade is F in this area — have there been break-ins, vandalism, or insurance claims at this property in the last 3 years? What carrier currently insures it and at what premium?
- The area grade is low — what's the realistic commute time and amenity access for the typical tenant pool here? Any planned neighborhood developments (good or bad) we should know about?
- What's the average days-on-market for RENTAL listings here right now (not sales)? A rising rental-DOM trend means longer vacancies and softer asking-rent achievability than the comps imply.
- What's the recent tenant-quality profile in this submarket — average credit score on applications, eviction rate, late-payment / NSF rate, and stable-employment percentage? A property-management company in the area should have these aggregated.
- How much new apartment / multifamily construction is in the pipeline within 1–3 miles? Heavy new supply (>2% of stock underway) typically softens rents 12–24 months out; light construction supports rent growth.
Investment metrics
- 1% rule
- 0.94% ✗
- Cap rate
- 6.93%
- Cash-on-cash
- 2.28%
- DSCR
- 1.10
- GRM
- 8.8
CMA / ARV
- ARV (median comp)
- $1,017,102
- List price
- $210,000
- Delta
- -79.35%
- Verdict
- UNDERPRICED
- Comps
- 20 within 2.0 mi
Projected returns pro-forma
-3.0% appreciation · 0.0% rent growth · sell at horizon
- IRR
- -16.1%
- Equity multiple
- 0.44×
- Total profit
- $-32,682
- Equity at exit
- $31,312
- IRR
- -14.2%
- Equity multiple
- 0.29×
- Total profit
- $-41,583
- Equity at exit
- $18,157
Cash invested: $58,800 (down + closing). Projections, not guarantees.
Landlord ↔ Tenant lean methodology
- Overall (STATE)
- 18 Strongly Tenant-Friendly
- State California
- 18 Strongly Tenant-Friendly · D+13
- County
- — inherits STATE
- City
- — inherits STATE
ZIP-level market 95826
- Rents YoY
- -0.3%
- Active inventory
- 123
- Price-to-rent
- 8.8×
Monthly cashflow live
- Estimated rent
- $1,978 medium interval (Pro) →
- Mortgage (P&I)
- −$1,101
- Tax est. 1.5%
- −$262 /mo · $3,150/yr
- Insurance
- −$88
- HOA
- −$0
- Vacancy / Maint / Mgmt
- −$415
- Net cashflow
- $112
Break-even live
UW: 25.0% down · 7.5% · 30yr · 1.5% tax · 5.0% vac · 8.0% maint · 8.0% mgmt
Financing live
Cash to close
- Down payment
- $52,500
- Closing costs
- $6,300
- Reserves months
- —
- Total cash needed
- —
Loan-product check · same deal, 3 products live
Conventional
25% down · 7.5% · 30yr
- Down + closing
- —
- Monthly P&I
- —
- Monthly cashflow
- —
- DSCR
- —
- Eligible?
- —
Personal DTI + credit; lowest rate.
DSCR
20% down · 8.5% · 30yr
- Down + closing
- —
- Monthly P&I
- —
- Monthly cashflow
- —
- DSCR
- —
- Eligible?
- —
No personal income docs; deal must DSCR.
Hard money
10% down · 12.0% · 12mo
- Down + closing
- —
- Monthly P&I
- —
- Monthly cashflow
- —
- DSCR
- —
- Eligible?
- —
Short-term bridge; refi at stabilization.
HOA detail condo
- Monthly dues
- $0 · $0/yr
- Assessments
- None detected in remarks — confirm with the listing agent.
Listing history 19 events
-
2026-06-18days on market $210,000 Active 208 DOM
-
2026-06-17days on market $210,000 Active 207 DOM
-
2026-06-16days on market $210,000 Active 206 DOM
-
2026-06-15days on market $210,000 Active 205 DOM
-
2026-06-13days on market $210,000 Active 203 DOM
-
2026-06-13days on market $210,000 Active 202 DOM
-
2026-06-09days on market $210,000 Active 199 DOM
-
2026-06-08days on market $210,000 Active 198 DOM
-
2026-06-07days on market $210,000 Active 197 DOM
-
2026-06-05days on market $210,000 Active 194 DOM
-
2026-06-03days on market $210,000 Active 193 DOM
-
2026-06-02days on market $210,000 Active 192 DOM
-
2026-06-01days on market $210,000 Active 191 DOM
-
2026-05-31days on market $210,000 Active 190 DOM
-
2025-11-22$210,000 Active 628-char remark
Show marketing remark (628 chars)
Whether you're a first-time buyer or simply looking for something quaint and low-maintenance, this charming 2-bedroom, 1-bath unit is the perfect find. A beautiful real-brick accent wall adds a stylish, loft-like feel, complimented by updated carpet and newer windows. The home is filled with wonderful natural light throughout. Enjoy the convenience of garage parking in a shared two-car garage, complete with ample storage space. The complex is surrounded by lush green space and mature trees, offering a peaceful, park-like setting. All of this in a fantastic location close to restaurants, shopping, and easy freeway access.
-
2024-11-01historical $1,500
-
2024-10-17price $1,500
-
2024-10-03price $1,600
-
2024-09-25$1,800
ⓘ Source: listings_history table (triggers on properties + properties_extension) + one-shot
backfill from property_details.listing_events for pre-trigger history.
Climate risk First Street
- Flood 1/10 Low FEMA zone X · 0% chance over 30 yrs
- Wildfire 4/10 Moderate
- Heat 7/10 Severe 7 d/yr ≥102°F today · 15 d/yr by 30 yrs out
- Wind 1/10 Low
- Air quality 10/10 Extreme 33 unhealthy d/yr today · 38 by 30 yrs out
Nearby sold comps map
Loading sold comps map…
Walkable amenities ~0.75 mi
Loading nearby amenities…
Taxation est. · year 1
- Rental income
- $23,741
- − Mortgage interest
- −$11,763
- − Property taxes
- −$3,150
- − Insurance
- −$1,050
- − Repairs & maintenance
- −$1,899
- − Management
- −$1,899
- − Depreciation
- −$6,109
- Taxable loss
- −$2,130
- Est. tax savings @ 24.0%
- +$511
- After-tax cash flow
- $1,852/yr
For passive investors: Depreciation is non-cash, so a rental often shows a tax loss while cash-flowing — sheltering income. Rental losses are passive: they offset passive income freely, and up to $25,000/yr can offset ordinary (W-2) income if you actively participate and your MAGI is under $100k (phasing out to $0 by $150k); unused losses carry forward. On sale, claimed depreciation is recaptured at up to 25%, and gains may owe capital-gains tax (a 1031 exchange can defer both). Figures are a year-1 estimate at your 24.0% rate — not tax advice; consult a CPA.
Condition & rehab AI · 2 photos
This 2-bedroom, 1-bath condo requires moderate repairs to the exterior siding and landscaping to improve its curb appeal and value.
Repairs flagged
- Moderate Exterior siding — Weathered appearance
- Minor Landscaping — Overgrown bushes
Value-add opportunities
- Both Paint exterior siding — Enhances curb appeal and value
- Both Trim bushes — Improves landscaping and curb appeal
Renovation cost estimate screening
| Repair item | Severity | Est. cost |
|---|---|---|
| Exterior siding · Weathered appearance | Moderate | $3,000–15,000 |
| Landscaping · Overgrown bushes | Minor | $500–3,000 |
| Total estimated repair cost · 2 items | $3,500–18,000 |
Value-add ROI direction
- Both Paint exterior siding — Enhances curb appeal and value ↑
- Both Trim bushes — Improves landscaping and curb appeal ↑
ⓘ Cost ranges are severity-bucket heuristics (US national rule-of-thumb). Get contractor quotes + a written scope before underwriting a rehab budget.
Schools (NCES district)
- District
- Sacramento City Unified
- NCES district ID
- 0633840
- Math proficiency
- 32% ▬ 0.00%
- Reading proficiency
- 43% ▲ 3.00%
- Median HH income
- $49,280
- Composite
- 34.86/100
- National rank
- #10000
- State rank
- #804 of 1400 in CA
Livability — Rosemont
- Score
- 67/100
- State rank
- #317
- US rank
- #10615
Category grades
Schools grade is shown separately in the Schools card above.
Census & demographics
- Census place
- Rosemont, CA
- County
- Sacramento County · 1,539,646 people
- City population
- 40,165
- Metro
- Sacramento-Roseville-Folsom, CA
- Population (ZIP)
- 40,165
- Household income
- $82,127
- Rent vs Own
- Severe rent burden
- 2433.0
Population outlook (Sacramento County) Hauer SSP2
- Today (2025)
- 1,660,763 people
- By 2030
- 1,732,990 · +4.3%
- By 2040
- 1,855,755 · +11.7%
- By 2050
- 1,941,335 · +16.9%
- By 2075
- 2,046,162 · +23.2%
- By 2100
- 1,961,444 · +18.1%
Race, ethnicity, and origin ACS 2023
- Neighborhood character
- Highly diverse neighborhood (Simpson 0.70)
- Race & ethnicity
- White 47% Hispanic / Latino 23% Two or more races 14% Black 11% Asian 11%
- Hispanic origin (detail)
- Mexican 18%
- Common ancestry
- Italian 3% Subsaharan African 2% Russian 2%
- Foreign-born
- 15% · Canada, South Korea, China
- Languages at home
- 75% English-only · Spanish 11% Other Indo-European 4% Russian/Polish/Slavic 2%
Political lean MEDSL · Sacramento
- 2024 margin
- D (+19.7) · D 58.1% · R 38.4% · Other 3.5%
- 2008→2024 swing
- +0.7pp no change · 2008: 19.0pp · 2024: 19.7pp
- All cycles
- 2024: D+19.7 2020: D+25.3 2016: D+23.7 2012: D+16.3 2008: D+19.0
Not yet ingested
- Civics
- —
Market trends
- HPI YoY
- ▼ -408.80%
- Current HPI
- 325.179
- Rent YoY
- ▼ -0.33%
- Metro
- Sacramento-Roseville-Folsom, CA
- State GDP YoY
- ▲ 3.21%
- F500 in state
- 116
Industry mix (Fortune 500 HQ in CA)
| Industry | F500 HQs | Revenue |
|---|---|---|
| Technology | 27 | $1,492B |
|
||
| Financial Services | 3 | $174B |
|
||
| Retail | 3 | $44B |
|
||
| Insurance | 3 | $26B |
|
||
| Media / Entertainment | 2 | $115B |
|
||
| Pharmaceuticals / Biotech | 2 | $62B |
|
||
Price history
+11566.7% since first listed5 events — show timeline
- 2025-11-22 Listed $210,000 ForSaleByOwner.com
- 2024-11-01 Rental Removed $1,500 APPFOLIO
- 2024-10-17 Price Changed $1,500 APPFOLIO
- 2024-10-03 Price Changed $1,600 APPFOLIO
- 2024-09-25 Listed for Rent $1,800 APPFOLIO
Cash-flow waterfall
monthlySold comps — $/sqft
last 12 mo · ≤1 miLoading sold comps…