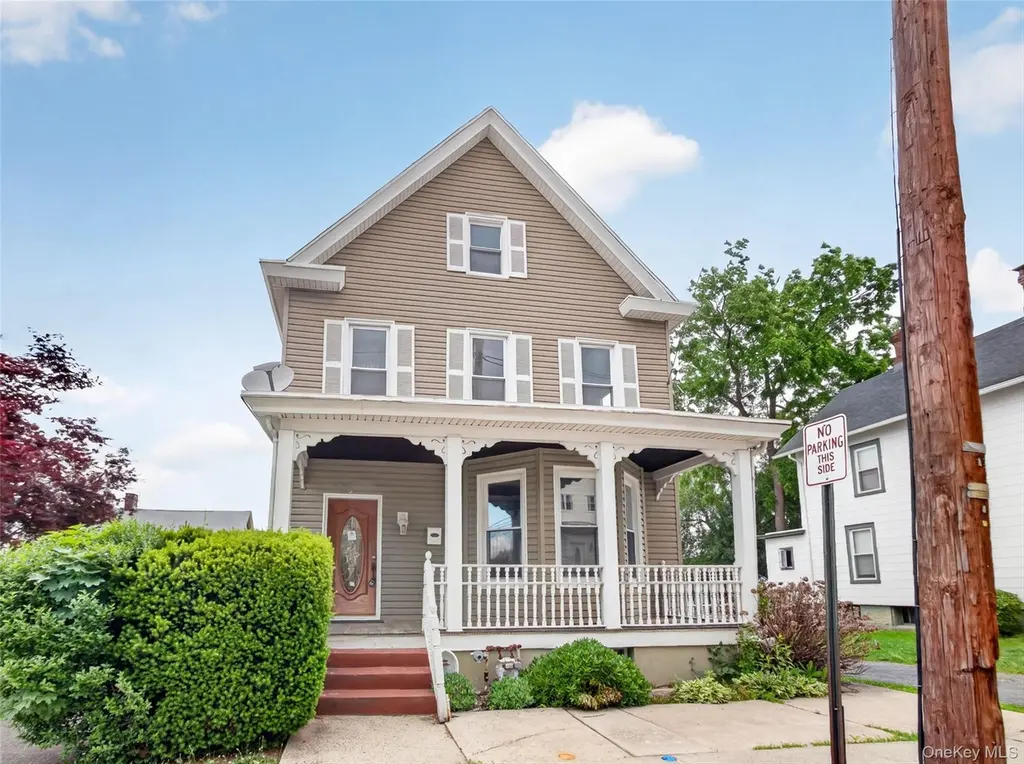
21 Sharp St · Haverstraw, NY
Flood risk 1/10 · Minimal
- FEMA flood zone
- X (unshaded)
- Chance of flooding over 30 yrs
- 0.0%
- Est. flood insurance / yr
- $473 – $860
Fire risk 4/10 · Minor
- Est. fire insurance / yr
- $691 – $1,283
Heat risk 6/10 · Moderate
- Hot days now (above 100°F)
- 7 days/yr
- Hot days in 30 yrs
- 15 days/yr
Wind risk 4/10 · Minor
- Chance of severe wind over 30 yrs
- 20.0%
Air-quality risk 3/10 · Minor
- Unhealthy air days now
- 2 days/yr
- Unhealthy air days in 30 yrs
- 3 days/yr
Risk factors via First Street. Map © Google.
Why this score? — see what drove the C+ grade
The composite is a weighted blend of 9 inputs, each scored 0–100. Each bar is that input's sub-score; the figure is the points it added to the 100-point composite (weight × sub-score).
- Cash flow +20.2/30.0
- ARV discount +15.0/15.0
- DSCR +6.4/10.0
- 1% rule +5.4/10.0
- Rent growth +4.4/5.0
- Schools +4.1/10.0
- Livability +2.9/5.0
- Condition / age +2.5/5.0
- Appreciation +0.0/10.0
$389,900
🖨 Deal sheet (PDF) 📄 Offer letter ✓ Due diligence
Listing remarks
Charming Colonial offering timeless character in Haverstraw. A welcoming covered front porch sets the tone for this spacious home, featuring generous living areas, abundant natural light, and classic architectural details throughout. Bring your vision and bring it back to its natural state. Enjoy a convenient location close to shopping, restaurants, parks, schools, and major commuter routes.
Key facts
- Covered front porch
- Natural light
- 3,049 sq ft lot
Tags
Property features AI
Exterior
- Parking: On-street parking
- Utilities: Public sewer; Electric service by Orange & Rockland; Electricity available; Natural gas connected
- Home design: Single family residence; Living area reported from public records
- Construction: Frame construction
- Exterior features: Frame construction; Not waterfront
Interior
- Kitchen: Gas range
- Bedrooms: Total of 10 rooms (bedroom count not specified)
- Bathrooms: 2 full bathrooms
- Heating & cooling: Natural gas heating; No cooling
- Interior features: Eat-in kitchen; Finished attic; Partially finished basement (see remarks)
Neighborhood map
What this means for you Summary
Snapshot
- This is a 5-bed/2.0-bath single-family listed at $390k.
Deal economics
- At list price, monthly cash flow is $494 ($6k/yr) — positive.
- The deal already cash-flows at list — no discount required.
- Meets the 1% rule at list price ($4k rent vs $390k).
- Recommended offer: $384k (1.5% below list) — sets the bar for market timing.
- Cap rate 7.8% vs local median 5.2% in Haverstraw — top-decile yield for the area; either an underpriced asset or a hidden risk that comps aren't pricing in. Stress-test before assuming the spread holds.
Location & tenants
- Location reads 57/100 on livability (#1,087 in NY) — a working-class tenant base; expect higher turnover. Strengths: housing A+, employment B+; Watch: crime D+, amenities F, commute F.
- Haverstraw-Stony Point CSD (North Rockland) (suburban): math 41% / reading 47% proficiency, ranked #427 of 590 in NY (top 72%) — families likely to look elsewhere, expect single-tenant / working-renter base with shorter leases.
- Zoned schools: West Haverstraw Elementary School (math 22% / reading 37%, grade F, #1,729 of 2,108 statewide, top 84%, 742 students, 22% FRL); Fieldstone Middle School (math 18% / reading 46%, grade F, #511 of 729 statewide, top 71%, 1,247 students, 0% FRL); North Rockland High School (math 86% / reading 67%, grade A-, #612 of 1,100 statewide, top 56%, 2,687 students, 0% FRL) — zoned schools average 7% FRL vs 40% district-wide (33 pts lower); this property's tenant base skews higher-income than the district average.
- Market conditions: Rents rising fast (+7.6%/yr); 51 active listings in the ZIP; 1 comparable units currently listed for rent nearby; solid renter incomes; 429 units permitted in Rockland County in 2024 (231 in 5+ unit buildings).
- At $4,037/mo this rent would consume 64% of the median local household income ($75k/yr) (locally 791% of renters already pay >50% of income on rent) — very limited rent-growth headroom before tenants either downsize or default.
Forward outlook
- Local home prices are declining (-3.0%/yr); year-one equity from $3k of loan paydown is wiped out by about $12k of value loss. Plan a longer hold.
- Rockland County population projected at +7% by 2050 — modest demand growth; plan on rents tracking national, not racing it.
- At projected returns (-3.0% appreciation + 7.6% rent growth), your $109k cash investment doubles in ~9 years — after that, you're playing with house money.
Negotiation context
- It's been on market 22 days — a 2% lower offer ($384k) is reasonable based on typical stale-listing flexibility.
Risks & watch-outs
- Watch-outs: built in 1900 — expect roof / HVAC / electrical / plumbing capex.
- Climate carrying-cost: extreme-heat days projected 7→15/yr by 2055 (HVAC capex compounding) — expect insurance premiums to compound above CPI over the hold.
Questions for the listing agent
- Built in 1900 — when were the roof, HVAC, electrical panel, plumbing, and water heater last replaced?
- Is there a deadline driving the sale (1031 exchange, divorce, estate, relocation)? That informs how much negotiation room exists.
- Schools are F-rated, which usually means shorter tenancies and higher turnover. Who's the typical renter profile here, and what's been the actual vacancy rate?
- Crime grade is D in this area — have there been break-ins, vandalism, or insurance claims at this property in the last 3 years? What carrier currently insures it and at what premium?
- What's the average days-on-market for RENTAL listings here right now (not sales)? A rising rental-DOM trend means longer vacancies and softer asking-rent achievability than the comps imply.
- What's the recent tenant-quality profile in this submarket — average credit score on applications, eviction rate, late-payment / NSF rate, and stable-employment percentage? A property-management company in the area should have these aggregated.
- How much new for-sale + rental construction is in the pipeline within 1–3 miles? Heavy new supply typically softens prices + rents 12–24 months out; constrained supply supports both.
Investment metrics
- 1% rule
- 1.04% ✓
- Cap rate
- 7.81%
- Cash-on-cash
- 5.44%
- DSCR
- 1.24
- GRM
- 8.0
CMA / ARV
- ARV (on-the-fly)
- $472,044
- Comps found
- 11
Show comp detail 11 sales within ~0.75 mi
| Address | Dist | Beds/Ba | Sqft | Sold | Price | $/sf | Match |
|---|---|---|---|---|---|---|---|
| 37 Conklin Ave | 0.06mi | 4/2.0 (-1) | 1,638 (-4%) | 1mo | $425,000 | $259 | 86 |
| 39 Coolidge St | 0.41mi | 4/1.5 (-1) | 1,600 (-6%) | 0mo | $405,000 | $253 | 64 |
| 61 Picariello Dr | 0.28mi | 4/2.5 (-1) | 1,804 (+6%) | 8mo | $610,000 | $338 | 63 |
| 64 Conklin Ave | 0.18mi | 5/2.0 | 1,843 (+8%) | 17mo | $510,000 | $277 | 63 |
| 67 Picariello Dr | 0.25mi | 4/2.5 (-1) | 1,804 (+6%) | 13mo | $639,000 | $354 | 60 |
| 46 Picariello Dr | 0.36mi | 4/2.5 (-1) | 1,804 (+6%) | 10mo | $599,000 | $332 | 58 |
| 68 Hillside Ave | 0.64mi | 4/2.0 (-1) | 1,863 (+10%) | 6mo | $555,000 | $298 | 44 |
| 72 Hillside Ave | 0.66mi | 5/2.0 | 1,863 (+10%) | 14mo | $560,000 | $301 | 42 |
| 324 Westside Ave | 0.65mi | 4/2.0 (-1) | 1,890 (+11%) | 8mo | $525,000 | $278 | 39 |
| 56 Hillside Ave | 0.58mi | 4/2.0 (-1) | 1,863 (+10%) | 19mo | $475,000 | $255 | 36 |
| 28 Hillside Ave | 0.74mi | 4/1.5 (-1) | 1,480 (-13%) | 2mo | $380,000 | $257 | 36 |
Match score weights: distance 35% · size 25% · config 20% · recency 20%. Top-matched comps best support the ARV.
Projected returns pro-forma
-3.0% appreciation · 7.62% rent growth · sell at horizon
- IRR
- -2.8%
- Equity multiple
- 0.89×
- Total profit
- $-11,989
- Equity at exit
- $58,135
- IRR
- 11.5%
- Equity multiple
- 2.09×
- Total profit
- $119,026
- Equity at exit
- $33,711
Cash invested: $109,172 (down + closing). Projections, not guarantees.
Landlord ↔ Tenant lean methodology
- Overall (STATE)
- 15 Strongly Tenant-Friendly
- State New York
- 15 Strongly Tenant-Friendly · D+10
- County
- — inherits STATE
- City
- — inherits STATE
ZIP-level market 10927
- Home prices YoY
- -23.6%
- Rents YoY
- 7.6%
- Active inventory
- 51
- Price-to-rent
- 8.0×
Monthly cashflow live
- Estimated rent
- $4,037 medium interval (Pro) →
- Mortgage (P&I)
- −$2,045
- Tax est. 1.5%
- −$487 /mo · $5,848/yr
- Insurance
- −$162
- HOA
- −$0
- Vacancy / Maint / Mgmt
- −$848
- Net cashflow
- $494
Break-even live
Sensitivity live
| Price | -10% $764 | -5% $629 | +0% $494 | +5% $360 | +10% $225 |
|---|---|---|---|---|---|
| Rent | -10% $176 | -5% $335 | +0% $494 | +5% $654 | +10% $813 |
| Rate | -1.0pp $691 | -0.5pp $594 | base $494 | +0.5pp $393 | +1.0pp $291 |
UW: 25.0% down · 7.5% · 30yr · 1.5% tax · 5.0% vac · 8.0% maint · 8.0% mgmt
Financing live
Cash to close
- Down payment
- $97,475
- Closing costs
- $11,697
- Reserves months
- —
- Total cash needed
- —
Loan-product check · same deal, 3 products live
Conventional
25% down · 7.5% · 30yr
- Down + closing
- —
- Monthly P&I
- —
- Monthly cashflow
- —
- DSCR
- —
- Eligible?
- —
Personal DTI + credit; lowest rate.
DSCR
20% down · 8.5% · 30yr
- Down + closing
- —
- Monthly P&I
- —
- Monthly cashflow
- —
- DSCR
- —
- Eligible?
- —
No personal income docs; deal must DSCR.
Hard money
10% down · 12.0% · 12mo
- Down + closing
- —
- Monthly P&I
- —
- Monthly cashflow
- —
- DSCR
- —
- Eligible?
- —
Short-term bridge; refi at stabilization.
Rent comps 1 comps
| Address | Beds | Baths | Sqft | Rent | $/sqft | DOM | Units | Dist |
|---|---|---|---|---|---|---|---|---|
| 56 Coolidge St Unit 2 Haverstraw, NY | 4.0 | 1.5 | 1400 | $3,500 | $2.50 | 6d | 1 | 0.42mi |
Listing history 15 events
-
2026-06-21days on market $389,900 Active 22 DOM
-
2026-06-18days on market $389,900 Active 19 DOM
-
2026-06-17days on market $389,900 Active 18 DOM
-
2026-06-16days on market $389,900 Active 17 DOM
-
2026-06-15days on market $389,900 Active 16 DOM
-
2026-06-13days on market $389,900 Active 14 DOM
-
2026-06-10days on market $389,900 Active 10 DOM
-
2026-06-08days on market $389,900 Active 9 DOM
-
2026-06-07days on market $389,900 Active 8 DOM
-
2026-06-04days on market $389,900 Active 5 DOM
-
2026-06-03days on market $389,900 Active 4 DOM
-
2026-06-02days on market $389,900 Active 3 DOM
-
2026-06-01days on market $389,900 Active 2 DOM
-
2026-05-31remarks 394-char remark
-
2026-05-31$389,900 Active 1 DOM
ⓘ Source: listings_history table (triggers on properties + properties_extension) + one-shot
backfill from property_details.listing_events for pre-trigger history.
Climate risk First Street
- Flood 1/10 Low FEMA zone X (unshaded) · 0% chance over 30 yrs
- Wildfire 4/10 Moderate
- Heat 6/10 Major 7 d/yr ≥100°F today · 15 d/yr by 30 yrs out
- Wind 4/10 Moderate 20% chance of damaging wind over 30 yrs
- Air quality 3/10 Moderate 2 unhealthy d/yr today · 3 by 30 yrs out
Nearby sold comps map
Loading sold comps map…
Walkable amenities ~0.75 mi
Loading nearby amenities…
Taxation est. · year 1
- Rental income
- $48,440
- − Mortgage interest
- −$21,840
- − Property taxes
- −$5,848
- − Insurance
- −$1,950
- − Repairs & maintenance
- −$3,875
- − Management
- −$3,875
- − Depreciation
- −$11,343
- Taxable loss
- −$291
- Est. tax savings @ 24.0%
- +$70
- After-tax cash flow
- $6,003/yr
For passive investors: Depreciation is non-cash, so a rental often shows a tax loss while cash-flowing — sheltering income. Rental losses are passive: they offset passive income freely, and up to $25,000/yr can offset ordinary (W-2) income if you actively participate and your MAGI is under $100k (phasing out to $0 by $150k); unused losses carry forward. On sale, claimed depreciation is recaptured at up to 25%, and gains may owe capital-gains tax (a 1031 exchange can defer both). Figures are a year-1 estimate at your 24.0% rate — not tax advice; consult a CPA.
Schools (NCES district)
- District
- Haverstraw-Stony Point CSD (North Rockland)
- NCES district ID
- 3614010
- Math proficiency
- 41% ▼ -7.00%
- Reading proficiency
- 47% ▼ -1.00%
- Median HH income
- $80,218
- Composite
- 40.68/100
- National rank
- #3672
- State rank
- #427 of 590 in NY
Livability — Haverstraw
- Score
- 57/100
- State rank
- #1087
- US rank
- #21649
Category grades
Schools grade is shown separately in the Schools card above.
Census & demographics
- Census place
- Haverstraw, NY
- County
- Rockland County · 98,828 people
- City population
- 12,325
- Metro
- New York-Newark-Jersey City, NY-NJ-PA
- Population (ZIP)
- 12,325
- Household income
- $75,167
- Rent vs Own
- Severe rent burden
- 791.0
Population outlook (Rockland County) Hauer SSP2
- Today (2025)
- 339,642 people
- By 2030
- 345,987 · +1.9%
- By 2040
- 357,178 · +5.2%
- By 2050
- 362,456 · +6.7%
- By 2075
- 367,281 · +8.1%
- By 2100
- 328,211 · -3.4%
Race, ethnicity, and origin ACS 2023
- Neighborhood character
- Diverse neighborhood (Simpson 0.57)
- Race & ethnicity
- Hispanic / Latino 61% Two or more races 24% White 18% Black 17% Asian 3% Native American 2%
- Hispanic origin (detail)
- Mexican 3% Puerto Rican 8% Dominican 32%
- Common ancestry
- Hispanic 5% Romanian 1% Scotch-Irish 1%
- Foreign-born
- 43% · Canada, Dominican Republic, Guatemala
- Languages at home
- 38% English-only · Spanish 53% French/Haitian/Cajun 6% Other Asian/Pacific 2%
Political lean MEDSL · Rockland
- 2024 margin
- R (+11.8) · D 44.1% · R 55.9%
- 2008→2024 swing
- -17.7pp toward R · 2008: 5.9pp · 2024: -11.8pp
- All cycles
- 2024: R+11.8 2020: D+1.7 2016: D+5.1 2012: D+6.6 2008: D+5.9
Not yet ingested
- Civics
- —
Market trends
- HPI YoY
- ▼ -73.63%
- Current HPI
- 238.4313
- Rent YoY
- ▲ 7.62%
- Metro
- New York-Newark-Jersey City, NY-NJ-PA
- State GDP YoY
- ▲ 2.60%
- F500 in state
- 92
Industry mix (Fortune 500 HQ in NY)
| Industry | F500 HQs | Revenue |
|---|---|---|
| Financial Services | 10 | $950B |
|
||
| Consumer Goods | 9 | $162B |
|
||
| Insurance | 4 | $225B |
|
||
| Telecommunications | 2 | $144B |
|
||
| Pharmaceuticals | 2 | $112B |
|
||
| Media / Entertainment | 2 | $69B |
|
||
Price history
1 event — show timeline
- 2026-05-29 Listed $389,900 OneKey® MLS as Distributed by MLS Grid
Property tax history
+16.8%/yrLatest (2025): $53,698 · +7.1% YoY. Source: county tax records.
Cash-flow waterfall
monthlySold comps — $/sqft
last 12 mo · ≤1 miLoading sold comps…