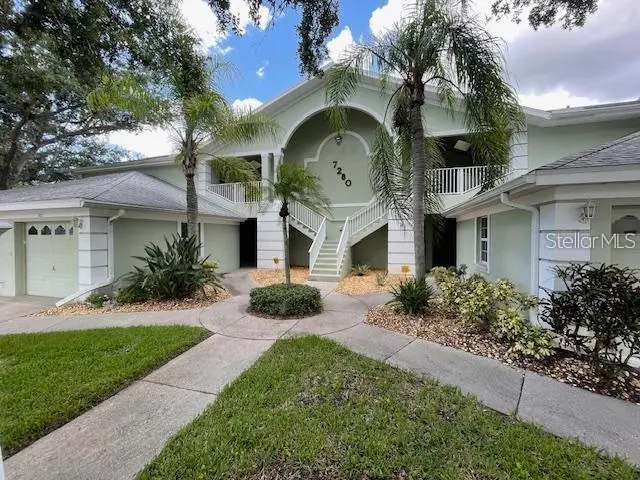
7280 Eleanor Cir #101 · Desoto Acres, FL
Flood risk 1/10 · Minimal
- FEMA flood zone
- X (unshaded)
- Chance of flooding over 30 yrs
- 0.0%
- Est. flood insurance / yr
- $507 – $1,088
Fire risk 1/10 · Minimal
- Est. fire insurance / yr
- $947 – $1,759
Heat risk 10/10 · Severe
- Hot days now (above 107°F)
- 7 days/yr
- Hot days in 30 yrs
- 29 days/yr
Wind risk 10/10 · Severe
- Chance of severe wind over 30 yrs
- 99.0%
Air-quality risk 2/10 · Minimal
- Unhealthy air days now
- 1 days/yr
- Unhealthy air days in 30 yrs
- 1 days/yr
Risk factors via First Street. Map © Google.
Why this score? — see what drove the D grade
The composite is a weighted blend of 9 inputs, each scored 0–100. Each bar is that input's sub-score; the figure is the points it added to the 100-point composite (weight × sub-score).
- Cash flow +12.6/30.0
- ARV discount +7.5/15.0
- 1% rule +5.7/10.0
- Schools +4.4/10.0
- DSCR +3.8/10.0
- Livability +2.5/5.0
- Condition / age +2.5/5.0
- Rent growth +1.5/5.0
- Appreciation +0.0/10.0
$231,000
🖨 Deal sheet 📄 Offer letter ✓ Due diligence
Listing remarks
Welcome to Pinehurst at Palm Aire, This immaculate ground floor end unit that shows like a model! You'll enjoy the open light and bright feeling of this Split Plan bedrooms. Large windows and sliding glass doors make this a light, bright, airy space. Enjoy the privacy of the lush preserve behind the unit while sitting on your screened in lanai, accessible from both the living room and master bedroom. The UPDATED KITCHEN offers ample cabinets and counter space featuring newer granite counter tops and a breakfast bar that opens to the great room. The OPEN CONCEPT features tile flooring throughout the unit in the great room, dining room, kitchen, bedrooms, bathrooms and laundry room. UPDATED
Key facts
- Ground floor unit
- Open concept
- Updated bathrooms
Tags
Property features AI
Finance
- Other: Homestead exempt; Condo land included; Association managed by Infinity Community MGMT
- Financial info: Total monthly fees: $557; Total annual fees: $6,684; Lease restrictions apply
- HOA & community: Monthly condo/association fee ($557); Association amenities include pool, tennis courts, cable TV; Association fee includes common area taxes, pool, maintenance (structure & grounds), management, pest control, escrow reserves; Association approval required; Buyer approval required for community; Clubhouse; Deed restrictions; Irrigation with reclaimed water; Pets allowed (cats and dogs, breed restrictions, max pet weight 60 lbs)
Exterior
- Parking: Attached 1-car garage; Has garage
- Utilities: Public water; Public sewer; Cable connected; BB/HS internet available; Fiber optics available; Electricity connected; Underground utilities; Water connected; Sewer connected
- Home design: Residential condominium; One story; First floor entry; Faces south; Accessible approach with ramp; Accessible closets; Visitor bathroom
- Construction: Cement siding; Shingle roof; Slab foundation; Building identified as 7280 #101; Property on a 2.91-acre parcel (approx. 2 to <5 acres)
- Exterior features: Sliding doors; Tennis court(s); In-ground gunite heated pool
Interior
- Kitchen: Dishwasher; Disposal; Microwave; Range; Refrigerator; Exhaust fan; Electric water heater
- Bedrooms: 2 bedrooms
- Flooring: Ceramic tile
- Bathrooms: 2 full bathrooms
- Heating & cooling: Electric heating; Central air conditioning
- Interior features: Ceiling fans; High ceilings; Kitchen/family room combo; Solid surface counters; Stone counters; Split bedroom plan; Walk-in closet(s); Window treatments; Inside utility
- Laundry & utility: Washer hookup; Dryer hookup; Laundry room; Washer; Dryer
Neighborhood map
What this means for you Summary
Snapshot
- This is a 2-bed/2.0-bath condo listed at $231k.
Deal economics
- At list price, monthly cash flow is $-29 ($-344/yr) — negative.
- To cash-flow at today's rent, offer at most $226k (2.2% below list).
- Meets the 1% rule at list price ($2k rent vs $231k).
- Recommended offer: $217k (6.0% below list) — sets the bar for market timing.
- Cap rate 6.1% vs local median 4.0% in Desoto Acres — top-decile yield for the area; either an underpriced asset or a hidden risk that comps aren't pricing in. Stress-test before assuming the spread holds.
Location & tenants
- Location reads: area grade D — affects rentability + tenant quality, not the cash-flow math above.
- Manatee (suburban): math 54% / reading 50% proficiency, ranked #26 of 73 in FL (top 36%) — acceptable for families but not a draw, mixed tenant base, ~2y average lease.
- Zoned schools: Marjorie G. Kinnan Elementary School (math 60% / reading 49%, grade C, #892 of 2,144 statewide, top 44%, 516 students, 73% FRL); Bayshore High School (math 17% / reading 26%, grade F, #546 of 667 statewide, top 82%, 1,435 students, 65% FRL) — zoned schools average 69% FRL vs 51% district-wide (19 pts higher); higher-poverty schools than district average — tighter screening recommended.
- Zoned-school proficiency averages 38% at this address vs 52% district-wide (-14 pts) — the specific schools serving this property underperform the Manatee average; the district grade overstates school quality for this exact location.
- Market conditions: Rents falling (-4.1%/yr); 386 active listings in the ZIP; 38 comparable units currently listed for rent nearby; rentals at typical pace (median 24d on market — plan ~3-4 weeks tenant-placement turnaround); solid renter incomes; 7,472 units permitted in Manatee County in 2024 (1,782 in 5+ unit buildings).
Forward outlook
- Local home prices are declining (-3.0%/yr); year-one equity from $2k of loan paydown is wiped out by about $7k of value loss. Plan a longer hold.
- Manatee County population projected at +43% by 2050 — long-run rental-demand tailwind backs the buy-and-hold thesis.
Negotiation context
- It's been on market 72 days — a 6% lower offer ($217k) is reasonable based on typical stale-listing flexibility.
- 3 sale attempts since 21y ago with the ask held roughly flat each time — persistent listings suggest the price (not the market) is what's stuck; bring a comps-based counter.
- Current owner paid $183k; 26% above their basis — modest negotiation headroom, anchor on the comps not their cost.
Risks & watch-outs
- Watch-outs: HOA is 22% of rent.
- Climate carrying-cost: severe wind risk, 99% chance of damaging wind over 30y; extreme-heat days projected 7→29/yr by 2055 (HVAC capex compounding) — expect insurance premiums to compound above CPI over the hold.
Questions for the listing agent
- What do current leases actually rent for vs. the listed asking? Can we see a recent rent roll and the last 12 months of T-12 income?
- It's been on market 72 days. Have you received any prior offers? Is the seller open to a 6% concession, seller financing, or rate buy-down credit?
- What does the HOA fee cover, when was the last increase, and are there any pending special assessments or reserve-fund shortfalls?
- Any open or pending special assessments — roof, HVAC, plumbing, elevator, façade? What's the per-unit balance and payoff schedule, and is the seller paying it off at close or rolling it to the buyer?
- Why hasn't it sold? Are there any deal-killer items the seller is aware of (foundation, flood, title, zoning, code violations)?
- Is there a deadline driving the sale (1031 exchange, divorce, estate, relocation)? That informs how much negotiation room exists.
- The area grade is low — what's the realistic commute time and amenity access for the typical tenant pool here? Any planned neighborhood developments (good or bad) we should know about?
- What's the average days-on-market for RENTAL listings here right now (not sales)? A rising rental-DOM trend means longer vacancies and softer asking-rent achievability than the comps imply.
- What's the recent tenant-quality profile in this submarket — average credit score on applications, eviction rate, late-payment / NSF rate, and stable-employment percentage? A property-management company in the area should have these aggregated.
- How much new apartment / multifamily construction is in the pipeline within 1–3 miles? Heavy new supply (>2% of stock underway) typically softens rents 12–24 months out; light construction supports rent growth.
Investment metrics
- 1% rule
- 1.07% ✓
- Cap rate
- 6.14%
- Cash-on-cash
- -0.53%
- DSCR
- 0.98
- GRM
- 7.8
CMA / ARV
No comps found within radius.
Projected returns pro-forma
-3.0% appreciation · 0.0% rent growth · sell at horizon
- IRR
- -21.3%
- Equity multiple
- 0.28×
- Total profit
- $-46,255
- Equity at exit
- $34,443
- IRR
- -27.6%
- Equity multiple
- -0.08×
- Total profit
- $-69,614
- Equity at exit
- $19,973
Cash invested: $64,680 (down + closing). Projections, not guarantees.
Landlord ↔ Tenant lean methodology
- Overall (STATE)
- 87 Strongly Landlord-Friendly
- State Florida
- 87 Strongly Landlord-Friendly · R+3
- County
- — inherits STATE
- City
- — inherits STATE
ZIP-level market 34243
- Home prices YoY
- -23.0%
- Rents YoY
- -4.1%
- Active inventory
- 386
- Price-to-rent
- 7.8×
Monthly cashflow live
- Estimated rent
- $2,483 high interval (Pro) →
- Mortgage (P&I)
- −$1,211
- Tax from tax record
- −$125 /mo · $1,504/yr
- Insurance
- −$96
- HOA
- −$557
- Vacancy / Maint / Mgmt
- −$521
- Net cashflow
- $-29
Break-even live
UW: 25.0% down · 7.5% · 30yr · 1.5% tax · 5.0% vac · 8.0% maint · 8.0% mgmt
Financing live
Cash to close
- Down payment
- $57,750
- Closing costs
- $6,930
- Reserves months
- —
- Total cash needed
- —
Loan-product check · same deal, 3 products live
Conventional
25% down · 7.5% · 30yr
- Down + closing
- —
- Monthly P&I
- —
- Monthly cashflow
- —
- DSCR
- —
- Eligible?
- —
Personal DTI + credit; lowest rate.
DSCR
20% down · 8.5% · 30yr
- Down + closing
- —
- Monthly P&I
- —
- Monthly cashflow
- —
- DSCR
- —
- Eligible?
- —
No personal income docs; deal must DSCR.
Hard money
10% down · 12.0% · 12mo
- Down + closing
- —
- Monthly P&I
- —
- Monthly cashflow
- —
- DSCR
- —
- Eligible?
- —
Short-term bridge; refi at stabilization.
Rent comps 38 comps
| Address | Beds | Baths | Sqft | Rent | $/sqft | DOM | Units | Dist |
|---|---|---|---|---|---|---|---|---|
| 7234 Eleanor Cir #203 Sarasota, FL | 2.0 | 2.0 | 1064 | $2,150 | $2.02 | 15d | 1 | 0.14mi |
| 7452 W Country Club Dr N Unit 1546435P Sarasota, FL | 2.0 | 2.0 | 1173 | $2,742 | $2.34 | 11d | 1 | 0.28mi |
| 7351 W Country Club Dr N #202 Sarasota, FL | 2.0 | 2.0 | 1118 | $4,300 | $3.85 | 23d | 1 | 0.29mi |
| 7251 W Country Club Dr N #226 Sarasota, FL | 2.0 | 2.0 | 1118 | $2,000 | $1.79 | 23d | 1 | 0.29mi |
| 7405 W Country Club Dr N #104 Sarasota, FL | 3.0 | 2.0 | 1444 | $3,200 | $2.22 | 23d | 1 | 0.30mi |
| 7231 W Country Club Dr N #232 Sarasota, FL | 2.0 | 2.0 | 909 | $2,000 | $2.20 | 23d | 1 | 0.31mi |
| 7211 W Country Club Dr N #133 Sarasota, FL | 2.0 | 2.0 | 909 | $1,500 | $1.65 | 11d | 1 | 0.33mi |
| 7153 W Country Club Dr N #146 Sarasota, FL | 1.0 | 1.5 | 717 | $3,000 | $4.18 | 23d | 1 | 0.37mi |
| 4455 Rayfield Dr Sarasota, FL | 2.0 | 2.5 | 1143 | $2,210 | $1.93 | 23d | 1 | 0.38mi |
| 7062 W Country Club Dr N #7062 Sarasota, FL | 1.0 | 1.5 | 954 | $3,000 | $3.14 | 23d | 1 | 0.52mi |
| 7050 W Country Club Dr N Unit 10-A Sarasota, FL | 2.0 | 2.0 | 1118 | $4,300 | $3.85 | 23d | 1 | 0.55mi |
| 7887 Lockwood Ridge Rd Sarasota, FL | 1.0–2.0 | 1.0–2.0 | 916 | $2,297 | $2.51 | 1d | 16 | 0.60mi |
| 4665 Whitfield Ave Sarasota, FL | 1.0–3.0 | 1.0–2.0 | 1023 | $2,372 | $2.32 | 1d | 59 | 0.63mi |
| 7008 W Country Club Dr N Unit 136 Sarasota, FL | 2.0 | 2.0 | 1118 | $1,875 | $1.68 | 23d | 1 | 0.63mi |
| 7461 W Country Club Dr N Sarasota, FL | 2.0 | 2.0 | 1153 | $2,275 | $1.97 | 3d | 4 | 0.63mi |
| 6896 W Country Club Ln #148 Sarasota, FL | 2.0 | 2.0 | 1118 | $1,700 | $1.52 | 11d | 1 | 0.65mi |
| 4208 76th Dr E Sarasota, FL | 3.0 | 2.0 | 1350 | $2,645 | $1.96 | 2d | 1 | 0.65mi |
| 6892 W Country Club Ln Sarasota, FL | 2.0 | 2.0 | 1444 | $3,500 | $2.42 | 23d | 1 | 0.66mi |
| 6986 W Country Club Dr N #6986 Sarasota, FL | 3.0 | 2.0 | 1468 | $4,600 | $3.13 | 23d | 1 | 0.69mi |
| 7885 N Lockwood Ridge Rd Unit 827 Sarasota, FL | 2.0 | 2.0 | 1177 | $1,799 | $1.53 | 23d | 1 | 0.75mi |
| 7885 N Lockwood Ridge Rd Sarasota, FL | 2.0 | 1.0 | 1025 | $1,749 | $1.71 | 23d | 1 | 0.75mi |
| 5769 Avista Dr #5769 Sarasota, FL | 2.0 | 2.0 | 1212 | $1,950 | $1.61 | 23d | 1 | 0.76mi |
| 5761 Avista Dr Unit 5761 Sarasota, FL | 2.0 | 2.0 | 1284 | $4,000 | $3.12 | 23d | 1 | 0.84mi |
| 5905 Doral Dr Sarasota, FL | 2.0 | 2.0 | 1298 | $2,400 | $1.85 | 23d | 1 | 0.93mi |
| 3612 75th Dr E Sarasota, FL | 3.0 | 2.0 | 1245 | $3,050 | $2.45 | 23d | 1 | 1.01mi |
| 4815 Woodbrook Dr Sarasota, FL | 2.0 | 2.0 | 1080 | $2,290 | $2.12 | 3d | 1 | 1.07mi |
| 8121 45th Ct E Sarasota, FL | 2.0 | 2.0 | 1000 | $1,695 | $1.70 | 1d | 1 | 1.07mi |
| 5025 82nd Way E Sarasota, FL | 3.0 | 2.0 | 1321 | $2,250 | $1.70 | 23d | 1 | 1.21mi |
| 6110 Country Club Way #201 Sarasota, FL | 2.0 | 2.0 | 1400 | $4,000 | $2.86 | 23d | 1 | 1.23mi |
| 6120 Country Club Way #207 Sarasota, FL | 2.0 | 2.0 | 1400 | $1,950 | $1.39 | 23d | 1 | 1.24mi |
| 7752 Eagle Creek Dr Unit 7752 Sarasota, FL | 2.0 | 2.0 | 983 | $1,650 | $1.68 | 15d | 1 | 1.30mi |
| 7794 Eagle Creek Dr #7794 Sarasota, FL | 2.0 | 2.0 | 983 | $1,800 | $1.83 | 21d | 1 | 1.34mi |
| 7886 Eagle Creek Dr Unit 7886 Sarasota, FL | 2.0 | 2.0 | 983 | $3,300 | $3.36 | 23d | 1 | 1.35mi |
| 7725 Whitebridge Gln University Park, FL | 2.0 | 2.0 | 1344 | $5,250 | $3.91 | 23d | 1 | 1.43mi |
| 5662 Gardens Dr #104 Sarasota, FL | 2.0 | 2.0 | 1068 | $1,950 | $1.83 | 23d | 1 | 1.44mi |
| 3045 Broadway Ave Sarasota, FL | 1.0–2.0 | 1.0–2.0 | 865 | $2,480 | $2.87 | 10d | 31 | 1.47mi |
| 6041 Clubside Dr Unit 6041 Sarasota, FL | 2.0 | 2.0 | 1380 | $2,950 | $2.14 | 23d | 1 | 1.47mi |
| 5924 Clubside Dr Sarasota, FL | 2.0 | 2.0 | 1380 | $2,500 | $1.81 | 23d | 1 | 1.48mi |
HOA detail condo
- Monthly dues
- $557 · $6,684/yr
- Assessments
- None detected in remarks — confirm with the listing agent.
Listing history 27 events
-
2026-06-18days on market $231,000 Active 72 DOM
-
2026-06-17days on market $231,000 Active 71 DOM
-
2026-06-16days on market $231,000 Active 70 DOM
-
2026-06-15days on market $231,000 Active 69 DOM
-
2026-06-13days on market $231,000 Active 67 DOM
-
2026-06-13days on market $231,000 Active 66 DOM
-
2026-06-10days on market $231,000 Active 64 DOM
-
2026-06-09days on market $231,000 Active 63 DOM
-
2026-06-08days on market $231,000 Active 62 DOM
-
2026-06-08days on market $231,000 Active 61 DOM
-
2026-06-03days on market $231,000 Active 57 DOM
-
2026-06-02days on market $231,000 Active 56 DOM
-
2026-06-01days on market $231,000 Active 55 DOM
-
2026-05-31days on market $231,000 Active 54 DOM
-
2026-05-05price $231,000
-
2026-04-07$235,000 Active
-
2025-01-01historical
-
2024-10-17price $267,000
-
2024-07-03$289,000 Active
-
2018-12-13soldstatus $183,200
-
2005-09-19$239,900
-
2005-08-03soldstatus $238,500
-
2005-06-02soldstatus $800,000
-
2003-09-17soldstatus $655,000
-
1993-12-03soldstatus $200,000
-
1993-12-03soldstatus $435,000
-
1992-07-16soldstatus $500,000
ⓘ Source: listings_history table (triggers on properties + properties_extension) + one-shot
backfill from property_details.listing_events for pre-trigger history.
Tax reassessment forecast FL · Resets to sale price
- Current annual tax
- $1,504 · $125/mo
- Projected year-2 tax
- $1,917 · $160/mo
- Expected delta
- +$414/yr (+$34/mo · 27.5%)
ⓘ Screening estimate from a state-policy table — verify with the county assessor before closing.
Climate risk First Street
- Flood 1/10 Low FEMA zone X (unshaded) · 0% chance over 30 yrs
- Wildfire 1/10 Low
- Heat 10/10 Extreme 7 d/yr ≥107°F today · 29 d/yr by 30 yrs out
- Wind 10/10 Extreme 99% chance of damaging wind over 30 yrs
- Air quality 2/10 Low 1 unhealthy d/yr today · 1 by 30 yrs out
Nearby sold comps map
Loading sold comps map…
Walkable amenities ~0.75 mi
Loading nearby amenities…
Taxation est. · year 1
- Rental income
- $29,791
- − Mortgage interest
- −$12,940
- − Property taxes
- −$1,504
- − Insurance
- −$1,155
- − Repairs & maintenance
- −$2,383
- − Management
- −$2,383
- − HOA
- −$6,684
- − Depreciation
- −$6,720
- Taxable loss
- −$3,978
- Est. tax savings @ 24.0%
- +$955
- After-tax cash flow
- $610/yr
For passive investors: Depreciation is non-cash, so a rental often shows a tax loss while cash-flowing — sheltering income. Rental losses are passive: they offset passive income freely, and up to $25,000/yr can offset ordinary (W-2) income if you actively participate and your MAGI is under $100k (phasing out to $0 by $150k); unused losses carry forward. On sale, claimed depreciation is recaptured at up to 25%, and gains may owe capital-gains tax (a 1031 exchange can defer both). Figures are a year-1 estimate at your 24.0% rate — not tax advice; consult a CPA.
Schools (NCES district)
- District
- Manatee
- NCES district ID
- 1201230
- Math proficiency
- 54% ▼ -6.00%
- Reading proficiency
- 50% ▼ -2.00%
- Median HH income
- $49,607
- Composite
- 44.43/100
- National rank
- #2806
- State rank
- #26 of 73 in FL
Livability — Desoto Acres
No livability data for this city. (Only ~50 U.S. cities are tracked.)
Census & demographics
- County
- Manatee County · 416,364 people
- Metro
- North Port-Sarasota-Bradenton, FL
- Population (ZIP)
- 32,773
- Household income
- $81,219
- Rent vs Own
- Severe rent burden
- 1138.0
Population outlook (Manatee County) Hauer SSP2
- Today (2025)
- 447,342 people
- By 2030
- 488,911 · +9.3%
- By 2040
- 567,934 · +27.0%
- By 2050
- 637,995 · +42.6%
- By 2075
- 781,970 · +74.8%
- By 2100
- 848,272 · +89.6%
Race, ethnicity, and origin ACS 2023
- Neighborhood character
- Predominantly White (76%)
- Race & ethnicity
- White 76% Hispanic / Latino 14% Two or more races 11% Asian 3% Black 3%
- Hispanic origin (detail)
- Mexican 5% Puerto Rican 3% Cuban 1%
- Common ancestry
- Romanian 5% Lithuanian 3% Slovak 2%
- Foreign-born
- 16% · Canada, Vietnam, Jamaica
- Languages at home
- 81% English-only · Spanish 8% Russian/Polish/Slavic 3% Other Indo-European 3%
Political lean MEDSL · Manatee
- 2024 margin
- Strong R (+23.5) · D 37.9% · R 61.4%
- 2008→2024 swing
- -16.5pp toward R · 2008: -7.0pp · 2024: -23.5pp
- All cycles
- 2024: R+23.5 2020: R+16.1 2016: R+17.1 2012: R+12.5 2008: R+7.0
Not yet ingested
- Civics
- —
Market trends
- HPI YoY
- ▼ -83.67%
- Current HPI
- 280.5372
- Rent YoY
- ▼ -4.14%
- Metro
- North Port-Sarasota-Bradenton, FL
- State GDP YoY
- ▲ 3.28%
- F500 in state
- 36
Industry mix (Fortune 500 HQ in FL)
| Industry | F500 HQs | Revenue |
|---|---|---|
| Industrial Technology | 2 | $29B |
|
||
| Insurance | 2 | $17B |
|
||
| Retail | 1 | $60B |
|
||
| Technology Distribution | 1 | $58B |
|
||
| Homebuilding | 1 | $35B |
|
||
| Technology Manufacturing | 1 | $35B |
|
||
Price history
-53.8% since first listed13 events — show timeline
- 2026-05-05 Price Changed $231,000 Stellar MLS as Distributed by MLS Grid
- 2026-04-07 Listed $235,000 Stellar MLS as Distributed by MLS Grid
- 2025-01-01 Listing Removed — Stellar MLS as Distributed by MLS Grid
- 2024-10-17 Price Changed $267,000 Stellar MLS as Distributed by MLS Grid
- 2024-07-03 Listed $289,000 Stellar MLS as Distributed by MLS Grid
- 2018-12-13 Sold (Public Records) $183,200 Public Records
- 2005-09-19 Listed $239,900 Stellar MLS as Distributed by MLS Grid
- 2005-08-03 Sold (Public Records) $238,500 Public Records
- 2005-06-02 Sold (Public Records) $800,000 Public Records
- 2003-09-17 Sold (Public Records) $655,000 Public Records
- 1993-12-03 Sold (Public Records) $435,000 Public Records
- 1993-12-03 Sold (Public Records) $200,000 Public Records
- 1992-07-16 Sold (Public Records) $500,000 Public Records
Property tax history
+0.5%/yrLatest (2024): $1,504 · +3.3% YoY. Source: county tax records.
Cash-flow waterfall
monthlySold comps — $/sqft
last 12 mo · ≤1 miLoading sold comps…