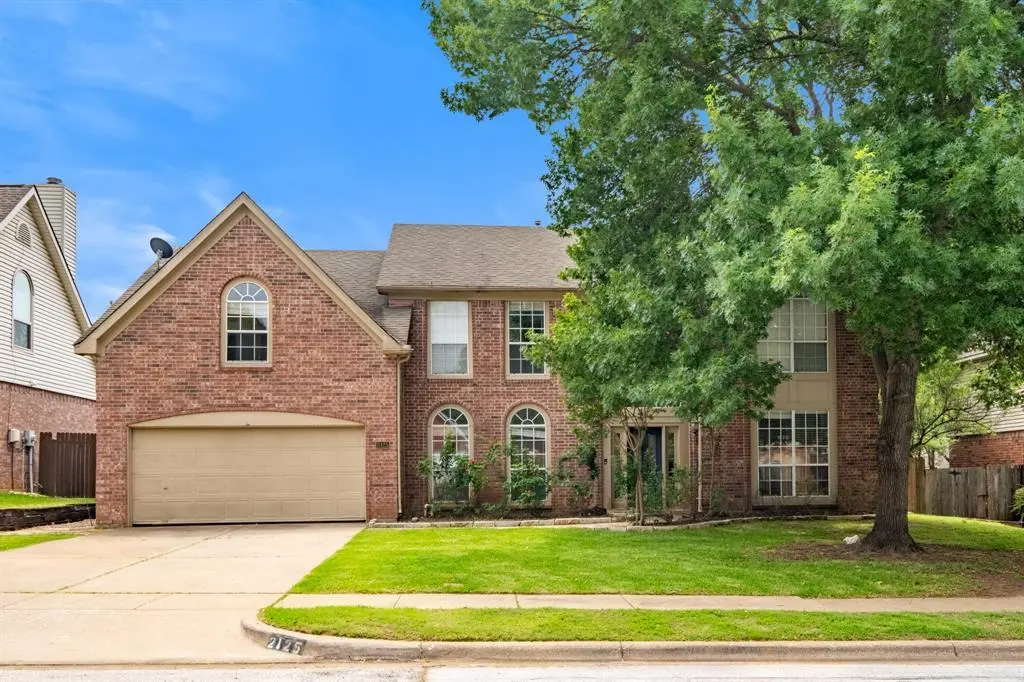
2125 Branchwood · Grapevine, TX
Flood risk 1/10 · Minimal
- FEMA flood zone
- X (unshaded)
- Chance of flooding over 30 yrs
- 0.0%
- Est. flood insurance / yr
- $507 – $1,088
Fire risk 3/10 · Minor
- Est. fire insurance / yr
- $1,222 – $2,270
Heat risk 7/10 · Major
- Hot days now (above 109°F)
- 7 days/yr
- Hot days in 30 yrs
- 22 days/yr
Wind risk 4/10 · Minor
- Chance of severe wind over 30 yrs
- 23.0%
Air-quality risk 3/10 · Minor
- Unhealthy air days now
- 3 days/yr
- Unhealthy air days in 30 yrs
- 4 days/yr
Risk factors via First Street. Map © Google.
Why this score? — see what drove the D grade
The composite is a weighted blend of 9 inputs, each scored 0–100. Each bar is that input's sub-score; the figure is the points it added to the 100-point composite (weight × sub-score).
- ARV discount +13.1/15.0
- Schools +8.3/10.0
- Cash flow +6.5/30.0
- Livability +4.1/5.0
- Rent growth +3.2/5.0
- Condition / age +2.5/5.0
- 1% rule +1.6/10.0
- DSCR +0.8/10.0
- Appreciation +0.0/10.0
$567,900
🖨 Deal sheet 📄 Offer letter ✓ Due diligence
Listing remarks MLS
Open House, Sunday, Oct. 21, 3:30-4:30pm! Beautifully updated home located in a popular Grapevine neighborhood zoned to Southlake schools * Rich hardwoods throughout except tile in the wet areas meaning NO CARPET * Upgraded light fixtures * Granite & stainless appliances in kitchen * 1-yr. old saltwater pool with rock waterfall * $8k new 18-seer AC unit Sept 2012 * Radiant barrier * 5th bedroom is 19'x20' and would make a great game room
Key facts
- Treelined street
- Formal dining area
- 9,200 sq ft lot
Tags
Property features AI
Finance
- Other: Subdivision: Winding Creek Estates
- Financial info: Listing terms include cash and other; No second mortgage
- HOA & community: No homeowners association
Exterior
- Parking: Attached 2-car garage; 2 covered parking spaces
- Security: Carbon monoxide detector(s); Smoke detector(s)
- Utilities: City sewer; Electricity connected; Not in a municipal utility district
- Home design: Single-family residence; Two-story home; Property is not attached
- Construction: Built in 1992; Composition roof; Slab foundation
- Exterior features: In-ground pool; Backyard fencing; Level lot
Interior
- Kitchen: Dishwasher; Garbage disposal
- Bedrooms: Five bedrooms (primary bedroom on the first floor; other bedrooms on first and second floors as noted)
- Flooring: Combination flooring
- Bathrooms: Three bathrooms total (2 full, 1 half)
- Heating & cooling: Central heating; Central air conditioning; One fireplace in the living room
- Interior features: Eat-in kitchen; One living area; One dining area; Total of 10 rooms
- Laundry & utility: Utility room for laundry
Neighborhood map
What this means for you Summary
Snapshot
- This is a 5-bed/2.0-bath single-family listed at $568k.
Deal economics
- At list price, monthly cash flow is $-961 ($-12k/yr) — negative.
- To cash-flow at today's rent, offer at most $398k (29.9% below list).
- To meet the 1% rule (rent ≥ 1% of price), the offer needs to be $377k (33.6% below list).
- Recommended offer: $377k (33.6% below list) — sets the bar for 1% rule.
- Cap rate 4.3% vs local median 2.8% in Grapevine — top-decile yield for the area; either an underpriced asset or a hidden risk that comps aren't pricing in. Stress-test before assuming the spread holds.
Location & tenants
- Location reads 82/100 on livability (#14 in TX, #1,085 nationally) — a professional / high-income tenant draw. Strengths: employment A+, housing A+, amenities A-; Watch: cost of living D+, commute D.
- Carroll ISD (suburban): math 84% / reading 83% proficiency, ranked #1 of 826 in TX (top 0%) — strong family-tenant draw, lease renewals of 3-5y typical; only 3% free/reduced lunch — higher-income household profile.
- Zoned schools: Jack D Johnson El (math 75% / reading 84%, grade A, #35 of 4,322 statewide, top 1%, 690 students, 0% FRL) — zoned schools at 0% FRL track the district average.
- Market conditions: Rents rising (+2.8%/yr); 190 active listings in the ZIP; 7 comparable units currently listed for rent nearby; rentals leasing fast (median 13d on market — plan ~1-2 weeks tenant-placement turnaround); high-income renter base; 18,938 units permitted in Tarrant County in 2024 (8,336 in 5+ unit buildings).
- This rent runs 41% of the median local income ($111k/yr) — at the standard rent-burdened threshold; future hikes will face affordability resistance.
Forward outlook
- Local home prices are declining (-3.0%/yr); year-one equity from $4k of loan paydown is wiped out by about $17k of value loss. Plan a longer hold.
- Tarrant County population projected at +41% by 2050 — long-run rental-demand tailwind backs the buy-and-hold thesis.
Negotiation context
- Only 6 days on market — expect competitive offers; lowballing is unlikely to land.
- 4 sale attempts since 20y ago with the ask held roughly flat each time — persistent listings suggest the price (not the market) is what's stuck; bring a comps-based counter.
Risks & watch-outs
- Climate carrying-cost: extreme-heat days projected 7→22/yr by 2055 (HVAC capex compounding) — expect insurance premiums to compound above CPI over the hold.
Questions for the listing agent
- What do current leases actually rent for vs. the listed asking? Can we see a recent rent roll and the last 12 months of T-12 income?
- Is there a deadline driving the sale (1031 exchange, divorce, estate, relocation)? That informs how much negotiation room exists.
- Schools are B-rated — typically a magnet for longer-tenancy family renters. What's the average tenant stay here, and is there a school-zone premium baked into asking?
- The area grade is low — what's the realistic commute time and amenity access for the typical tenant pool here? Any planned neighborhood developments (good or bad) we should know about?
- What's the average days-on-market for RENTAL listings here right now (not sales)? A rising rental-DOM trend means longer vacancies and softer asking-rent achievability than the comps imply.
- What's the recent tenant-quality profile in this submarket — average credit score on applications, eviction rate, late-payment / NSF rate, and stable-employment percentage? A property-management company in the area should have these aggregated.
- How much new for-sale + rental construction is in the pipeline within 1–3 miles? Heavy new supply typically softens prices + rents 12–24 months out; constrained supply supports both.
Investment metrics
- 1% rule
- 0.66% ✗
- Cap rate
- 4.26%
- Cash-on-cash
- -7.25%
- DSCR
- 0.68
- GRM
- 12.6
CMA / ARV
- ARV (median comp)
- $648,518
- List price
- $567,900
- Delta
- -12.43%
- Verdict
- UNDERPRICED
- Comps
- 20 within 1.0 mi
Show comp detail 12 sales within ~0.75 mi
| Address | Dist | Beds/Ba | Sqft | Sold | Price | $/sf | Match |
|---|---|---|---|---|---|---|---|
| 2125 Branchwood | 0.00mi | 5/2.5 | 2,903 (+2%) | 0mo | $567,900 | $196 | 94 |
| 1068 Rosewood Dr | 0.15mi | 4/2.5 (-1) | 2,795 (-2%) | 3mo | $659,000 | $236 | 81 |
| 2121 Brentcove Dr | 0.12mi | 4/3.0 (-1) | 2,976 (+5%) | 0mo | $840,000 | $282 | 78 |
| 1081 Woodbriar Dr | 0.20mi | 5/2.5 | 3,111 (+9%) | 0mo | $749,000 | $241 | 73 |
| 2156 Sandell Dr | 0.10mi | 4/2.5 (-1) | 2,500 (-12%) | 2mo | $639,950 | $256 | 66 |
| 1041 Woodbriar Dr | 0.30mi | 5/2.5 | 3,122 (+10%) | 4mo | $825,000 | $264 | 64 |
| 1060 Rosewood Dr | 0.17mi | 4/3.0 (-1) | 3,117 (+10%) | 4mo | $689,000 | $221 | 64 |
| 2116 S Winding Creek Dr | 0.42mi | 4/2.5 (-1) | 2,586 (-9%) | 5mo | $625,000 | $242 | 54 |
| 1048 W Winding Creek Dr | 0.33mi | 5/3.5 | 3,201 (+13%) | 5mo | $550,000 | $172 | 54 |
| 2225 Branchwood Dr | 0.21mi | 4/3.5 (-1) | 3,214 (+13%) | 6mo | $924,700 | $288 | 52 |
| 826 Lake Forest Ct | 0.62mi | 4/2.0 (-1) | 2,424 (-15%) | 1mo | $625,000 | $258 | 40 |
| 521 Austin Oaks Dr | 0.71mi | 4/2.5 (-1) | 2,516 (-12%) | 5mo | $653,000 | $260 | 36 |
Match score weights: distance 35% · size 25% · config 20% · recency 20%. Top-matched comps best support the ARV.
Projected returns pro-forma
-3.0% appreciation · 2.8% rent growth · sell at horizon
- IRR
- -29.1%
- Equity multiple
- 0.03×
- Total profit
- $-153,944
- Equity at exit
- $84,676
- IRR
- -30.1%
- Equity multiple
- -0.36×
- Total profit
- $-215,718
- Equity at exit
- $49,102
Cash invested: $159,012 (down + closing). Projections, not guarantees.
Landlord ↔ Tenant lean methodology
- Overall (STATE)
- 87 Strongly Landlord-Friendly
- State Texas
- 87 Strongly Landlord-Friendly · R+5
- County
- — inherits STATE
- City
- — inherits STATE
ZIP-level market 76051
- Rents YoY
- 2.8%
- Active inventory
- 190
- Price-to-rent
- 12.6×
Monthly cashflow live
- Estimated rent
- $3,770 high interval (Pro) →
- Mortgage (P&I)
- −$2,978
- Tax from tax record
- −$725 /mo · $8,701/yr
- Insurance
- −$237
- HOA
- −$0
- Vacancy / Maint / Mgmt
- −$792
- Net cashflow
- $-961
Break-even live
UW: 25.0% down · 7.5% · 30yr · 1.5% tax · 5.0% vac · 8.0% maint · 8.0% mgmt
Financing live
Cash to close
- Down payment
- $141,975
- Closing costs
- $17,037
- Reserves months
- —
- Total cash needed
- —
Loan-product check · same deal, 3 products live
Conventional
25% down · 7.5% · 30yr
- Down + closing
- —
- Monthly P&I
- —
- Monthly cashflow
- —
- DSCR
- —
- Eligible?
- —
Personal DTI + credit; lowest rate.
DSCR
20% down · 8.5% · 30yr
- Down + closing
- —
- Monthly P&I
- —
- Monthly cashflow
- —
- DSCR
- —
- Eligible?
- —
No personal income docs; deal must DSCR.
Hard money
10% down · 12.0% · 12mo
- Down + closing
- —
- Monthly P&I
- —
- Monthly cashflow
- —
- DSCR
- —
- Eligible?
- —
Short-term bridge; refi at stabilization.
Rent comps 7 comps
| Address | Beds | Baths | Sqft | Rent | $/sqft | DOM | Units | Dist |
|---|---|---|---|---|---|---|---|---|
| 2108 Sandell Dr Grapevine, TX | 4.0 | 3.0 | 3191 | $4,195 | $1.31 | 6d | 1 | 0.06mi |
| 2128 N Aspenwood Dr Grapevine, TX | 4.0 | 2.0 | 2096 | $3,600 | $1.72 | 12d | 1 | 0.31mi |
| 1404 Clearwater Ct Grapevine, TX | 4.0 | 3.0 | 2515 | $3,550 | $1.41 | 5d | 1 | 0.51mi |
| 2902 Panhandle Dr Grapevine, TX | 4.0 | 3.0 | 1990 | $4,200 | $2.11 | 22d | 1 | 0.69mi |
| 2719 Hidden Lake Dr Grapevine, TX | 4.0 | 3.0 | 3366 | $4,400 | $1.31 | 43d | 1 | 0.83mi |
| 2719 Hidden Lake Dr Grapevine, TX | 4.0 | 3.0 | 3366 | $4,400 | $1.31 | 16d | 1 | 0.83mi |
| 2937 Sweet Briar St Grapevine, TX | 4.0 | 2.5 | 2438 | $4,300 | $1.76 | 1d | 1 | 1.12mi |
Listing history 18 events
-
2026-05-06status Pending 266-char remark
-
2026-04-30$567,900 Active 266-char remark
-
2015-10-28soldstatus
-
2015-10-27soldstatus Sold
-
2015-10-13status Pending
-
2015-09-30historical Active Option Contract
-
2015-09-26$399,000 Active
-
2012-11-02soldstatus
-
2012-10-31soldstatus Closed
Show marketing remark (447 chars)
Open House, Sunday, Oct. 21, 3:30-4:30pm! Beautifully updated home located in a popular Grapevine neighborhood zoned to Southlake schools * Rich hardwoods throughout except tile in the wet areas meaning NO CARPET * Upgraded light fixtures * Granite & stainless appliances in kitchen * 1-yr. old saltwater pool with rock waterfall * $8k new 18-seer AC unit Sept 2012 * Radiant barrier * 5th bedroom is 19'x20' and would make a great game room
-
2012-10-29status Pending
Show marketing remark (447 chars)
Open House, Sunday, Oct. 21, 3:30-4:30pm! Beautifully updated home located in a popular Grapevine neighborhood zoned to Southlake schools * Rich hardwoods throughout except tile in the wet areas meaning NO CARPET * Upgraded light fixtures * Granite & stainless appliances in kitchen * 1-yr. old saltwater pool with rock waterfall * $8k new 18-seer AC unit Sept 2012 * Radiant barrier * 5th bedroom is 19'x20' and would make a great game room
-
2012-10-21historical Active Option Contract
Show marketing remark (447 chars)
Open House, Sunday, Oct. 21, 3:30-4:30pm! Beautifully updated home located in a popular Grapevine neighborhood zoned to Southlake schools * Rich hardwoods throughout except tile in the wet areas meaning NO CARPET * Upgraded light fixtures * Granite & stainless appliances in kitchen * 1-yr. old saltwater pool with rock waterfall * $8k new 18-seer AC unit Sept 2012 * Radiant barrier * 5th bedroom is 19'x20' and would make a great game room
-
2012-10-04$299,900 Active
Show marketing remark (447 chars)
Open House, Sunday, Oct. 21, 3:30-4:30pm! Beautifully updated home located in a popular Grapevine neighborhood zoned to Southlake schools * Rich hardwoods throughout except tile in the wet areas meaning NO CARPET * Upgraded light fixtures * Granite & stainless appliances in kitchen * 1-yr. old saltwater pool with rock waterfall * $8k new 18-seer AC unit Sept 2012 * Radiant barrier * 5th bedroom is 19'x20' and would make a great game room
-
2007-04-05soldstatus
-
2007-03-22soldstatus
-
2007-02-26historical
-
2006-10-16$269,990
-
1998-05-06soldstatus
-
1989-01-01soldstatus
ⓘ Source: listings_history table (triggers on properties + properties_extension) + one-shot
backfill from property_details.listing_events for pre-trigger history.
Tax reassessment forecast TX · Resets to sale price
- Current annual tax
- $8,701 · $725/mo
- Projected year-2 tax
- $10,393 · $866/mo
- Expected delta
- +$1,692/yr (+$141/mo · 19.4%)
ⓘ Screening estimate from a state-policy table — verify with the county assessor before closing.
Climate risk First Street
- Flood 1/10 Low FEMA zone X (unshaded) · 0% chance over 30 yrs
- Wildfire 3/10 Moderate
- Heat 7/10 Severe 7 d/yr ≥109°F today · 22 d/yr by 30 yrs out
- Wind 4/10 Moderate 23% chance of damaging wind over 30 yrs
- Air quality 3/10 Moderate 3 unhealthy d/yr today · 4 by 30 yrs out
Nearby sold comps map
Loading sold comps map…
Walkable amenities ~0.75 mi
Loading nearby amenities…
Taxation est. · year 1
- Rental income
- $45,243
- − Mortgage interest
- −$31,811
- − Property taxes
- −$8,701
- − Insurance
- −$2,840
- − Repairs & maintenance
- −$3,619
- − Management
- −$3,619
- − Depreciation
- −$16,521
- Taxable loss
- −$21,868
- Est. tax savings @ 24.0%
- +$5,248
- After-tax cash flow
- $-6,288/yr
For passive investors: Depreciation is non-cash, so a rental often shows a tax loss while cash-flowing — sheltering income. Rental losses are passive: they offset passive income freely, and up to $25,000/yr can offset ordinary (W-2) income if you actively participate and your MAGI is under $100k (phasing out to $0 by $150k); unused losses carry forward. On sale, claimed depreciation is recaptured at up to 25%, and gains may owe capital-gains tax (a 1031 exchange can defer both). Figures are a year-1 estimate at your 24.0% rate — not tax advice; consult a CPA.
Schools (NCES district)
- District
- Carroll ISD
- NCES district ID
- 4813020
- Math proficiency
- 84% ▼ -6.00%
- Reading proficiency
- 83% ▼ -3.00%
- Median HH income
- $176,203
- Composite
- 82.64/100
- National rank
- #21
- State rank
- #1 of 826 in TX
Livability — Grapevine
- Score
- 82/100
- State rank
- #14
- US rank
- #1085
Category grades
Schools grade is shown separately in the Schools card above.
Census & demographics
- Census place
- Grapevine, TX
- County
- Tarrant County · 2,033,669 people
- City population
- 50,618
- Metro
- Dallas-Fort Worth-Arlington, TX
- Population (ZIP)
- 50,618
- Household income
- $111,160
- Rent vs Own
- Severe rent burden
- 2272.0
Population outlook (Tarrant County) Hauer SSP2
- Today (2025)
- 2,380,417 people
- By 2030
- 2,578,900 · +8.3%
- By 2040
- 2,974,995 · +25.0%
- By 2050
- 3,350,489 · +40.8%
- By 2075
- 4,216,909 · +77.2%
- By 2100
- 4,741,527 · +99.2%
Race, ethnicity, and origin ACS 2023
- Neighborhood character
- Diverse neighborhood (Simpson 0.55)
- Race & ethnicity
- White 63% Hispanic / Latino 20% Two or more races 12% Asian 7% Black 5%
- Hispanic origin (detail)
- Mexican 14%
- Common ancestry
- Slovak 3% Lithuanian 3% Romanian 2%
- Foreign-born
- 17% · Canada, China, South Korea
- Languages at home
- 77% English-only · Spanish 13% Other Indo-European 4% Chinese 1%
Political lean MEDSL · Tarrant
- 2024 margin
- Lean R (+5.1) · D 46.7% · R 51.9% · Other 1.4%
- 2008→2024 swing
- +6.6pp toward D · 2008: -11.7pp · 2024: -5.1pp
- All cycles
- 2024: R+5.1 2020: D+0.2 2016: R+8.7 2012: R+15.7 2008: R+11.7
Not yet ingested
- Civics
- —
Market trends
- HPI YoY
- ▼ -291.98%
- Current HPI
- 274.5097
- Rent YoY
- ▲ 2.80%
- Metro
- Dallas-Fort Worth-Arlington, TX
- State GDP YoY
- ▲ 3.95%
- F500 in state
- 110
Industry mix (Fortune 500 HQ in TX)
| Industry | F500 HQs | Revenue |
|---|---|---|
| Energy | 16 | $1,198B |
|
||
| Technology | 5 | $198B |
|
||
| Engineering / Construction | 4 | $72B |
|
||
| Energy Services | 3 | $60B |
|
||
| Utilities | 3 | $41B |
|
||
| Healthcare | 2 | $330B |
|
||
Price history
+110.3% since first listed19 events — show timeline
- 2026-06-09 Sold (MLS) — NTREIS
- 2026-05-06 Pending — NTREIS
- 2026-04-30 Listed $567,900 NTREIS
- 2015-10-28 Sold (Public Records) — Public Records
- 2015-10-27 Sold (MLS) — NTREIS
- 2015-10-13 Pending — NTREIS
- 2015-09-30 Contingent — NTREIS
- 2015-09-26 Listed $399,000 NTREIS
- 2012-11-02 Sold (Public Records) — Public Records
- 2012-10-31 Sold (MLS) — NTREIS
- 2012-10-29 Pending — NTREIS
- 2012-10-21 Contingent — NTREIS
- 2012-10-04 Listed $299,900 NTREIS
- 2007-04-05 Sold (Public Records) — Public Records
- 2007-03-22 Sold (MLS) — NTREIS
- 2007-02-26 Listing Removed — NTREIS
- 2006-10-16 Listed $269,990 NTREIS
- 1998-05-06 Sold (Public Records) — Public Records
- 1989-01-01 Sold (Public Records) — Public Records
Property tax history
+2.2%/yrLatest (2025): $8,701 · -15.5% YoY. Source: county tax records.
Cash-flow waterfall
monthlySold comps — $/sqft
last 12 mo · ≤1 miLoading sold comps…