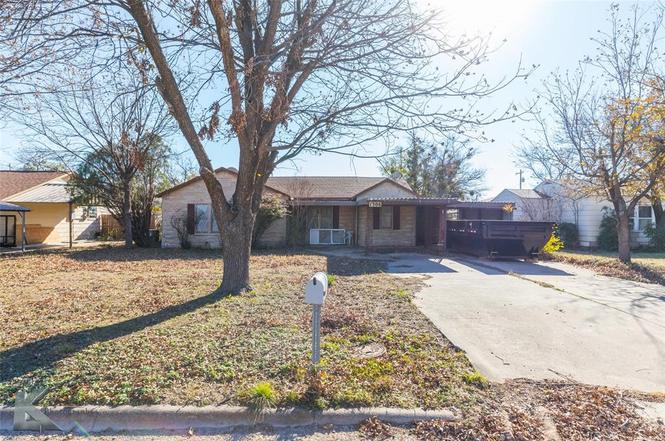
1306 Landon St · Stamford, TX
Flood risk 1/10 · Minimal
- FEMA flood zone
- X (unshaded)
- Chance of flooding over 30 yrs
- 0.0%
- Est. flood insurance / yr
- $507 – $1,088
Fire risk 5/10 · Moderate
- Est. fire insurance / yr
- $1,222 – $2,270
Heat risk 6/10 · Moderate
- Hot days now (above 107°F)
- 6 days/yr
- Hot days in 30 yrs
- 19 days/yr
Wind risk 4/10 · Minor
- Chance of severe wind over 30 yrs
- 9.0%
Air-quality risk 1/10 · Minimal
- Unhealthy air days now
- 0 days/yr
- Unhealthy air days in 30 yrs
- 0 days/yr
Risk factors via First Street. Map © Google.
Why this score? — see what drove the B+ grade
The composite is a weighted blend of 9 inputs, each scored 0–100. Each bar is that input's sub-score; the figure is the points it added to the 100-point composite (weight × sub-score).
- Cash flow +30.0/30.0
- 1% rule +10.0/10.0
- DSCR +10.0/10.0
- ARV discount +7.5/15.0
- Appreciation +5.0/10.0
- Schools +4.0/10.0
- Livability +3.5/5.0
- Rent growth +2.5/5.0
- Condition / age +2.5/5.0
$59,000
🖨 Deal sheet (PDF) 📄 Offer letter ✓ Due diligence
Listing remarks
Discover the potential of this 3-bedroom, 2-bath home nestled in a charming small town. While this property needs some work, its solid foundation and great bones make it an ideal canvas for your creative vision. Inside, you'll find spacious rooms that offer endless possibilities for renovation and personalization. The bright sunroom invites natural light, providing a perfect space to relax and enjoy your surroundings. The kitchen is ready to be transformed into your culinary haven. Recent updates include a new water heater, adding functionality to the home. The property also features a valuable shop, perfect for storage or hobbies, along with a convenient carport. This home is a promising o
Key facts
- New water heater
- Valuable shop
- Bright sunroom
Tags
Neighborhood map
What this means for you Summary
Snapshot
- This is a 3-bed/2.0-bath single-family listed at $59k.
Deal economics
- At list price, monthly cash flow is $499 ($6k/yr) — positive.
- The deal already cash-flows at list — no discount required.
- Meets the 1% rule at list price ($1k rent vs $59k).
- Recommended offer: $58k (1.5% below list) — sets the bar for market timing.
Location & tenants
- Location reads 70/100 on livability (#344 in TX) — a middle-class / working-renter tenant base. Strengths: crime A+, cost of living A+, housing A+; Watch: employment C-, health & safety C-, amenities F.
- Stamford ISD (town): math 50% / reading 46% proficiency, ranked #239 of 826 in TX (top 29%) — families likely to look elsewhere, expect single-tenant / working-renter base with shorter leases; 68% free/reduced lunch — lower-income household profile, screen leases tightly.
- Zoned schools: Oliver El (math 42% / reading 47%, grade F, #1,155 of 4,322 statewide, top 29%, 303 students, 75% FRL).
- Market conditions: 18 active listings in the ZIP; 1 units permitted in Jones County in 2024 (0 in 5+ unit buildings).
Forward outlook
- In year one you build about $441 of equity ($408 loan paydown + $33 appreciation (0.1% local appreciation)).
- Jones County population projected at +13% by 2050 — modest demand growth; plan on rents tracking national, not racing it.
- At projected returns (0.1% appreciation + 3.0% rent growth), your $17k cash investment doubles in ~3 years — after that, you're playing with house money.
Negotiation context
- It's been on market 22 days — a 2% lower offer ($58k) is reasonable based on typical stale-listing flexibility.
Risks & watch-outs
- Watch-outs: property tax is 4.3% of price; built in 1956 — expect roof / HVAC / electrical / plumbing capex.
- Climate carrying-cost: moderate wildfire risk; extreme-heat days projected 6→19/yr by 2055 (HVAC capex compounding) — expect insurance premiums to compound above CPI over the hold.
Questions for the listing agent
- Built in 1956 — when were the roof, HVAC, electrical panel, plumbing, and water heater last replaced?
- Property tax is high relative to price — has the assessment been appealed recently, and will the sale trigger a re-assessment?
- Is there a deadline driving the sale (1031 exchange, divorce, estate, relocation)? That informs how much negotiation room exists.
- Schools are D-rated, which usually means shorter tenancies and higher turnover. Who's the typical renter profile here, and what's been the actual vacancy rate?
- What's the average days-on-market for RENTAL listings here right now (not sales)? A rising rental-DOM trend means longer vacancies and softer asking-rent achievability than the comps imply.
- What's the recent tenant-quality profile in this submarket — average credit score on applications, eviction rate, late-payment / NSF rate, and stable-employment percentage? A property-management company in the area should have these aggregated.
- How much new for-sale + rental construction is in the pipeline within 1–3 miles? Heavy new supply typically softens prices + rents 12–24 months out; constrained supply supports both.
Investment metrics
- 1% rule
- 2.24% ✓
- Cap rate
- 16.45%
- Cash-on-cash
- 36.28%
- DSCR
- 2.61
- GRM
- 3.7
CMA / ARV
- ARV (on-the-fly)
- $189,024
- Comps found
- 7
Show comp detail 7 sales within ~0.75 mi
| Address | Dist | Beds/Ba | Sqft | Sold | Price | $/sf | Match |
|---|---|---|---|---|---|---|---|
| 1305 Landon St | 0.04mi | 3/2.0 | 1,909 (-3%) | 8mo | $144,000 | $75 | 86 |
| 1309 Hudson Rd | 0.12mi | 4/2.0 (+1) | 2,008 (+2%) | 4mo | $192,500 | $96 | 83 |
| 1106 E Reynolds St | 0.24mi | 3/1.5 | 2,010 (+2%) | 5mo | $175,000 | $87 | 79 |
| 206 Spoon Dr | 0.33mi | 3/2.0 | 1,891 (-4%) | 3mo | $229,900 | $122 | 75 |
| 1212 Compton St | 0.11mi | 3/2.0 | 1,872 (-5%) | 18mo | $169,900 | $91 | 72 |
| 1002 Maple St | 0.48mi | 4/2.5 (+1) | 1,900 (-4%) | 5mo | $209,000 | $110 | 61 |
| 1001 E Wells St | 0.43mi | 4/2.0 (+1) | 1,768 (-10%) | 3mo | $230,000 | $130 | 56 |
Match score weights: distance 35% · size 25% · config 20% · recency 20%. Top-matched comps best support the ARV.
Projected returns pro-forma
0.06% appreciation · 3.0% rent growth · sell at horizon
- IRR
- 37.3%
- Equity multiple
- 2.84×
- Total profit
- $30,339
- Equity at exit
- $17,295
- IRR
- 40.5%
- Equity multiple
- 5.58×
- Total profit
- $75,713
- Equity at exit
- $20,921
Cash invested: $16,520 (down + closing). Projections, not guarantees.
Landlord ↔ Tenant lean methodology
- Overall (STATE)
- 87 Strongly Landlord-Friendly
- State Texas
- 87 Strongly Landlord-Friendly · R+5
- County
- — inherits STATE
- City
- — inherits STATE
ZIP-level market 79553
- Home prices YoY
- 0.1%
- Active inventory
- 18
- Price-to-rent
- 3.7×
Monthly cashflow live
- Estimated rent
- $1,322 medium interval (Pro) →
- Mortgage (P&I)
- −$309
- Tax from tax record
- −$211 /mo · $2,537/yr
- Insurance
- −$25
- HOA
- −$0
- Vacancy / Maint / Mgmt
- −$278
- Net cashflow
- $499
Break-even live
Sensitivity live
| Price | -10% $533 | -5% $516 | +0% $499 | +5% $483 | +10% $466 |
|---|---|---|---|---|---|
| Rent | -10% $395 | -5% $447 | +0% $499 | +5% $552 | +10% $604 |
| Rate | -1.0pp $529 | -0.5pp $514 | base $499 | +0.5pp $484 | +1.0pp $469 |
UW: 25.0% down · 7.5% · 30yr · 1.5% tax · 5.0% vac · 8.0% maint · 8.0% mgmt
Financing live
Cash to close
- Down payment
- $14,750
- Closing costs
- $1,770
- Reserves months
- —
- Total cash needed
- —
Loan-product check · same deal, 3 products live
Conventional
25% down · 7.5% · 30yr
- Down + closing
- —
- Monthly P&I
- —
- Monthly cashflow
- —
- DSCR
- —
- Eligible?
- —
Personal DTI + credit; lowest rate.
DSCR
20% down · 8.5% · 30yr
- Down + closing
- —
- Monthly P&I
- —
- Monthly cashflow
- —
- DSCR
- —
- Eligible?
- —
No personal income docs; deal must DSCR.
Hard money
10% down · 12.0% · 12mo
- Down + closing
- —
- Monthly P&I
- —
- Monthly cashflow
- —
- DSCR
- —
- Eligible?
- —
Short-term bridge; refi at stabilization.
Listing history 3 events
-
2026-01-30status Pending
-
2026-01-20historical Active Option Contract
-
2026-01-08$59,000 Active
ⓘ Source: listings_history table (triggers on properties + properties_extension) + one-shot
backfill from property_details.listing_events for pre-trigger history.
Tax reassessment forecast TX · Resets to sale price
- Current annual tax
- $2,537 · $211/mo
- Projected year-2 tax
- $2,537 · $211/mo
- Expected delta
- $0/yr ($0/mo · 0.0%)
ⓘ Screening estimate from a state-policy table — verify with the county assessor before closing.
Climate risk First Street
- Flood 1/10 Low FEMA zone X (unshaded) · 0% chance over 30 yrs
- Wildfire 5/10 Major
- Heat 6/10 Major 6 d/yr ≥107°F today · 19 d/yr by 30 yrs out
- Wind 4/10 Moderate 9% chance of damaging wind over 30 yrs
- Air quality 1/10 Low 0 unhealthy d/yr today · 0 by 30 yrs out
Nearby sold comps map
Loading sold comps map…
Walkable amenities ~0.75 mi
Loading nearby amenities…
Taxation est. · year 1
- Rental income
- $15,870
- − Mortgage interest
- −$3,305
- − Property taxes
- −$2,537
- − Insurance
- −$295
- − Repairs & maintenance
- −$1,270
- − Management
- −$1,270
- − Depreciation
- −$1,716
- Taxable income
- $5,478
- Est. tax owed @ 24.0%
- −$1,315
- After-tax cash flow
- $4,678/yr
For passive investors: Depreciation is non-cash, so a rental often shows a tax loss while cash-flowing — sheltering income. Rental losses are passive: they offset passive income freely, and up to $25,000/yr can offset ordinary (W-2) income if you actively participate and your MAGI is under $100k (phasing out to $0 by $150k); unused losses carry forward. On sale, claimed depreciation is recaptured at up to 25%, and gains may owe capital-gains tax (a 1031 exchange can defer both). Figures are a year-1 estimate at your 24.0% rate — not tax advice; consult a CPA.
Schools (NCES district)
- District
- Stamford ISD
- NCES district ID
- 4841400
- Math proficiency
- 50% ▲ 7.00%
- Reading proficiency
- 46% ▲ 5.00%
- Median HH income
- $37,780
- Composite
- 39.98/100
- National rank
- #3836
- State rank
- #239 of 826 in TX
Livability — Stamford
- Score
- 70/100
- State rank
- #344
- US rank
- #7510
Category grades
Schools grade is shown separately in the Schools card above.
Census & demographics
- Census place
- Stamford, TX
- Population (ZIP)
- 3,071
Population outlook (Jones County) Hauer SSP2
- Today (2025)
- 19,845 people
- By 2030
- 20,213 · +1.9%
- By 2040
- 21,446 · +8.1%
- By 2050
- 22,499 · +13.4%
- By 2075
- 23,272 · +17.3%
- By 2100
- 20,420 · +2.9%
Race, ethnicity, and origin ACS 2023
- Neighborhood character
- Diverse neighborhood (Simpson 0.58)
- Race & ethnicity
- White 51% Hispanic / Latino 39% Two or more races 8% Black 5% Asian 2%
- Hispanic origin (detail)
- Mexican 35%
- Common ancestry
- Slovak 5% Serbian 2% Danish 2%
- Foreign-born
- 5% · Canada
- Languages at home
- 80% English-only · Spanish 17% Other Indo-European 2% German/W. Germanic 1%
Political lean MEDSL · Jones
- 2024 margin
- Solid R (+73.2) · D 13.1% · R 86.2%
- 2008→2024 swing
- -27.1pp toward R · 2008: -46.1pp · 2024: -73.2pp
- All cycles
- 2024: R+73.2 2020: R+69.1 2016: R+65.4 2012: R+54.5 2008: R+46.1
Not yet ingested
- Civics
- —
Market trends
- HPI YoY
- ▲ 0.06%
- Current HPI
- 104.7578
- Rent YoY
- —
- Metro
- —
- State GDP YoY
- ▲ 3.95%
- F500 in state
- 110
Industry mix (Fortune 500 HQ in TX)
| Industry | F500 HQs | Revenue |
|---|---|---|
| Energy | 16 | $1,198B |
|
||
| Technology | 5 | $198B |
|
||
| Engineering / Construction | 4 | $72B |
|
||
| Energy Services | 3 | $60B |
|
||
| Utilities | 3 | $41B |
|
||
| Healthcare | 2 | $330B |
|
||
Price history
3 events — show timeline
- 2026-01-30 Pending — NTREIS
- 2026-01-20 Contingent — NTREIS
- 2026-01-08 Listed $59,000 NTREIS
Property tax history
+7.1%/yrLatest (2025): $2,537 · +25.4% YoY. Source: county tax records.
Cash-flow waterfall
monthlySold comps — $/sqft
last 12 mo · ≤1 miLoading sold comps…