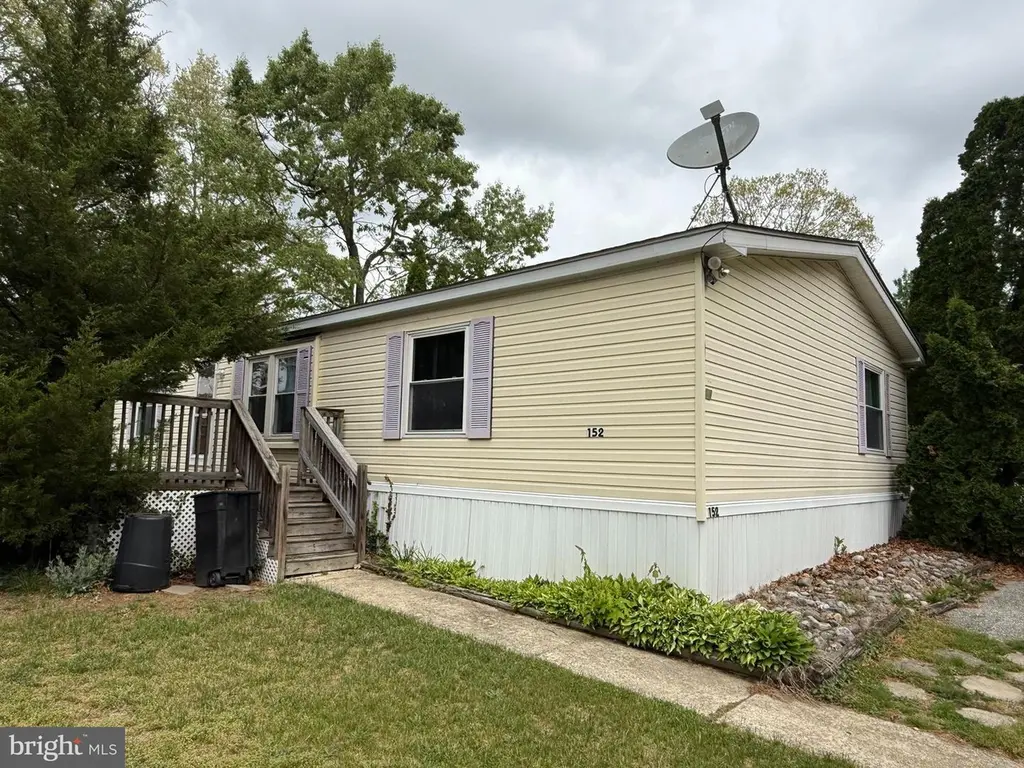
2110 Mays Landing Rd #152 · Vineland, NJ
Flood risk No data
- FEMA flood zone
- —
- Chance of flooding over 30 yrs
- —
- Est. flood insurance / yr
- —
Fire risk No data
- Est. fire insurance / yr
- —
Heat risk No data
- Hot days now (above threshold)
- —
- Hot days in 30 yrs
- —
Wind risk No data
- Chance of severe wind over 30 yrs
- —
Air-quality risk No data
- Unhealthy air days now
- —
- Unhealthy air days in 30 yrs
- —
Risk factors via First Street. Map © Google.
Why this score? — see what drove the C+ grade
The composite is a weighted blend of 9 inputs, each scored 0–100. Each bar is that input's sub-score; the figure is the points it added to the 100-point composite (weight × sub-score).
- Cash flow +30.0/30.0
- 1% rule +10.0/10.0
- DSCR +10.0/10.0
- Livability +3.3/5.0
- Rent growth +3.0/5.0
- Condition / age +2.2/5.0
- Schools +1.9/10.0
- ARV discount +0.0/15.0
- Appreciation +0.0/10.0
$114,995
🖨 Deal sheet 📄 Offer letter ✓ Due diligence
Listing remarks MLS
Welcome to this 3 bedroom 2 bathroom trailer. Just bring the family. Roof, windows and heater 10 yrs old. .. Hot water heater is 4 yrs old. This is an AS IS deal. Buyer is responsible all certifications including CO
Key facts
- 2 parking spots
- Community pool
- Built 2006
Property features AI
Finance
- Other: Ownership is land lease
- Financial info: Annual ground rent listed as an income/expense item
- HOA & community: Land lease of $600 per month; 99 years of land lease remaining
Exterior
- Parking: Off-street parking with 2 spaces (2 total garage/parking spaces)
- Utilities: Private water; Private sewer
- Home design: Manufactured double-wide home; Above-grade structure
- Construction: Estimated year built; Above-grade construction
- Exterior features: Community pool; Not in a federal flood zone; Ground rent exists (annual payment)
Interior
- Bedrooms: Three bedrooms on the main level
- Bathrooms: Two full bathrooms on the main level
- Heating & cooling: Forced air heating (natural gas); Central air conditioning (electric); Electric hot water
- Interior features: Estimated living area; No basement
Neighborhood map
What this means for you Summary
Snapshot
- This is a 3-bed/2.0-bath single-family listed at $115k. Condition is rated fair.
Deal economics
- At list price, monthly cash flow is $824 ($10k/yr) — positive.
- The deal already cash-flows at list — no discount required.
- Meets the 1% rule at list price ($2k rent vs $115k).
- Recommended offer: $112k (3.0% below list) — sets the bar for market timing.
- Cap rate 14.9% vs local median 4.5% in Vineland — top-decile yield for the area; either an underpriced asset or a hidden risk that comps aren't pricing in. Stress-test before assuming the spread holds.
Location & tenants
- Location reads 66/100 on livability (#363 in NJ) — a middle-class / working-renter tenant base. Strengths: housing A+, health & safety A+; Watch: employment D+, crime F, amenities F.
- Vineland Public School District (urban): math 9% / reading 34% proficiency, ranked #418 of 472 in NJ (top 89%) — low school quality limits family demand, transient renter base, plan for 1-2y turnover.
- Zoned schools: Vineland Senior High School (math 10% / reading 34%, grade F, #346 of 399 statewide, top 88%, 2,780 students, 0% FRL) — zoned schools average 0% FRL vs 53% district-wide (53 pts lower); this property's tenant base skews higher-income than the district average.
- Market conditions: Rents rising (+1.9%/yr); 296 active listings in the ZIP; 216 units permitted in Cumberland County in 2024 (73 in 5+ unit buildings).
- This rent runs 36% of the median local income ($67k/yr) — at the standard rent-burdened threshold; future hikes will face affordability resistance.
Forward outlook
- Local home prices are declining (-3.0%/yr); year-one equity from $795 of loan paydown is wiped out by about $3k of value loss. Plan a longer hold.
- Cumberland County population projected to shrink 7% by 2050 — rents likely to lag national; underwrite the cash flow, not the appreciation.
- At projected returns (-3.0% appreciation + 1.9% rent growth), your $32k cash investment doubles in ~5 years — after that, you're playing with house money.
Negotiation context
- It's been on market 51 days — a 3% lower offer ($112k) is reasonable based on typical stale-listing flexibility.
- 2 sale attempts since 5y ago with the ask held roughly flat each time — persistent listings suggest the price (not the market) is what's stuck; bring a comps-based counter.
- Current owner paid $60k; list at $115k implies a 92% gain — meaningful room to come down on a strong offer.
Questions for the listing agent
- It's been on market 51 days. Have you received any prior offers? Is the seller open to a 3% concession, seller financing, or rate buy-down credit?
- Have any recent inspections been done? Can we get a copy of the seller's disclosures and any deferred-maintenance estimates?
- Is there a deadline driving the sale (1031 exchange, divorce, estate, relocation)? That informs how much negotiation room exists.
- Schools are D-rated, which usually means shorter tenancies and higher turnover. Who's the typical renter profile here, and what's been the actual vacancy rate?
- Crime grade is F in this area — have there been break-ins, vandalism, or insurance claims at this property in the last 3 years? What carrier currently insures it and at what premium?
- What's the average days-on-market for RENTAL listings here right now (not sales)? A rising rental-DOM trend means longer vacancies and softer asking-rent achievability than the comps imply.
- What's the recent tenant-quality profile in this submarket — average credit score on applications, eviction rate, late-payment / NSF rate, and stable-employment percentage? A property-management company in the area should have these aggregated.
- How much new for-sale + rental construction is in the pipeline within 1–3 miles? Heavy new supply typically softens prices + rents 12–24 months out; constrained supply supports both.
Investment metrics
- 1% rule
- 1.78% ✓
- Cap rate
- 14.90%
- Cash-on-cash
- 30.72%
- DSCR
- 2.37
- GRM
- 4.7
CMA / ARV
- ARV (on-the-fly)
- $87,628
- Comps found
- 3
Show comp detail 3 sales within ~0.75 mi
| Address | Dist | Beds/Ba | Sqft | Sold | Price | $/sf | Match |
|---|---|---|---|---|---|---|---|
| 2110 Mayslanding Rd #34 | 0.11mi | 2/2.0 (-1) | 1,056 (-8%) | 14mo | $79,999 | $76 | 64 |
| 2110 Mays Landing Rd #173 | 0.10mi | 3/2.0 | 1,248 (+8%) | 21mo | $82,000 | $66 | 64 |
| 2110 Mayslanding Rd #161 | 0.11mi | 2/2.0 (-1) | 980 (-15%) | 11mo | $80,000 | $82 | 56 |
Match score weights: distance 35% · size 25% · config 20% · recency 20%. Top-matched comps best support the ARV.
Projected returns pro-forma
-3.0% appreciation · 1.94% rent growth · sell at horizon
- IRR
- 24.3%
- Equity multiple
- 1.99×
- Total profit
- $31,741
- Equity at exit
- $17,146
- IRR
- 31.4%
- Equity multiple
- 3.69×
- Total profit
- $86,688
- Equity at exit
- $9,943
Cash invested: $32,199 (down + closing). Projections, not guarantees.
Landlord ↔ Tenant lean methodology
- Overall (STATE)
- 21 Tenant-Leaning
- State New Jersey
- 21 Tenant-Leaning · D+6
- County
- — inherits STATE
- City
- — inherits STATE
ZIP-level market 08332
- Home prices YoY
- -28.9%
- Rents YoY
- 1.9%
- Active inventory
- 296
- Price-to-rent
- 4.7×
Monthly cashflow live
- Estimated rent
- $2,050 medium interval (Pro) →
- Mortgage (P&I)
- −$603
- Tax est. 1.5%
- −$144 /mo · $1,725/yr
- Insurance
- −$48
- HOA
- −$0
- Vacancy / Maint / Mgmt
- −$430
- Net cashflow
- $824
Break-even live
UW: 25.0% down · 7.5% · 30yr · 1.5% tax · 5.0% vac · 8.0% maint · 8.0% mgmt
Financing live
Cash to close
- Down payment
- $28,749
- Closing costs
- $3,450
- Reserves months
- —
- Total cash needed
- —
Loan-product check · same deal, 3 products live
Conventional
25% down · 7.5% · 30yr
- Down + closing
- —
- Monthly P&I
- —
- Monthly cashflow
- —
- DSCR
- —
- Eligible?
- —
Personal DTI + credit; lowest rate.
DSCR
20% down · 8.5% · 30yr
- Down + closing
- —
- Monthly P&I
- —
- Monthly cashflow
- —
- DSCR
- —
- Eligible?
- —
No personal income docs; deal must DSCR.
Hard money
10% down · 12.0% · 12mo
- Down + closing
- —
- Monthly P&I
- —
- Monthly cashflow
- —
- DSCR
- —
- Eligible?
- —
Short-term bridge; refi at stabilization.
Listing history 20 events
-
2026-06-19days on market $114,995 Active 51 DOM
-
2026-06-18days on market $114,995 Active 50 DOM
-
2026-06-17days on market $114,995 Active 49 DOM
-
2026-06-16days on market $114,995 Active 48 DOM
-
2026-06-15days on market $114,995 Active 47 DOM
-
2026-06-14days on market $114,995 Active 45 DOM
-
2026-06-13days on market $114,995 Active 44 DOM
-
2026-06-10days on market $114,995 Active 42 DOM
-
2026-06-09days on market $114,995 Active 41 DOM
-
2026-06-08days on market $114,995 Active 40 DOM
-
2026-06-07days on market $114,995 Active 39 DOM
-
2026-06-03days on market $114,995 Active 35 DOM
-
2026-06-02days on market $114,995 Active 34 DOM
-
2026-06-01days on market $114,995 Active 33 DOM
-
2026-05-31days on market $114,995 Active 32 DOM
-
2026-05-30days on market $114,995 Active 31 DOM
-
2026-04-29$114,995 Active 231-char remark
-
2021-12-20soldstatus $60,000 Closed 215-char remark
Show marketing remark (215 chars)
Welcome to this 3 bedroom 2 bathroom trailer. Just bring the family. Roof, windows and heater 10 yrs old. .. Hot water heater is 4 yrs old. This is an AS IS deal. Buyer is responsible all certifications including CO
-
2021-11-29status Pending 215-char remark
Show marketing remark (215 chars)
Welcome to this 3 bedroom 2 bathroom trailer. Just bring the family. Roof, windows and heater 10 yrs old. .. Hot water heater is 4 yrs old. This is an AS IS deal. Buyer is responsible all certifications including CO
-
2021-10-25$60,000 Active 215-char remark
Show marketing remark (215 chars)
Welcome to this 3 bedroom 2 bathroom trailer. Just bring the family. Roof, windows and heater 10 yrs old. .. Hot water heater is 4 yrs old. This is an AS IS deal. Buyer is responsible all certifications including CO
ⓘ Source: listings_history table (triggers on properties + properties_extension) + one-shot
backfill from property_details.listing_events for pre-trigger history.
Nearby sold comps map
Loading sold comps map…
Walkable amenities ~0.75 mi
Loading nearby amenities…
Taxation est. · year 1
- Rental income
- $24,594
- − Mortgage interest
- −$6,442
- − Property taxes
- −$1,725
- − Insurance
- −$575
- − Repairs & maintenance
- −$1,968
- − Management
- −$1,968
- − Depreciation
- −$3,345
- Taxable income
- $8,572
- Est. tax owed @ 24.0%
- −$2,057
- After-tax cash flow
- $7,836/yr
For passive investors: Depreciation is non-cash, so a rental often shows a tax loss while cash-flowing — sheltering income. Rental losses are passive: they offset passive income freely, and up to $25,000/yr can offset ordinary (W-2) income if you actively participate and your MAGI is under $100k (phasing out to $0 by $150k); unused losses carry forward. On sale, claimed depreciation is recaptured at up to 25%, and gains may owe capital-gains tax (a 1031 exchange can defer both). Figures are a year-1 estimate at your 24.0% rate — not tax advice; consult a CPA.
Condition & rehab AI · 7 photos
This single-family home requires moderate repairs and maintenance, including exterior repairs and landscaping improvements, to increase its resale and rental value.
Repairs flagged
- Major siding — Significant wear and tear
- Major roof — Age indicated
- Major landscaping — Overgrown and debris-filled
- Major fence — Needs repair or replacement
Value-add opportunities
- Both Landscaping and fence repair — Enhances curb appeal and property value
- Both Siding and roof repair — Improves structural integrity and aesthetics
- Both Interior painting — Fresh paint can make a significant difference in appearance
Renovation cost estimate screening
| Repair item | Severity | Est. cost |
|---|---|---|
| siding · Significant wear and tear | Major | $15,000–50,000 |
| roof · Age indicated | Major | $15,000–50,000 |
| landscaping · Overgrown and debris-filled | Major | $15,000–50,000 |
| fence · Needs repair or replacement | Major | $15,000–50,000 |
| Total estimated repair cost · 4 items | $60,000–200,000 |
Value-add ROI direction
- Both Landscaping and fence repair — Enhances curb appeal and property value ↑
- Both Siding and roof repair — Improves structural integrity and aesthetics ↑
- Both Interior painting — Fresh paint can make a significant difference in appearance ↑
ⓘ Cost ranges are severity-bucket heuristics (US national rule-of-thumb). Get contractor quotes + a written scope before underwriting a rehab budget.
Schools (NCES district)
- District
- Vineland Public School District
- NCES district ID
- 3416800
- Math proficiency
- 9% ▼ -17.00%
- Reading proficiency
- 34% ▬ 0.00%
- Median HH income
- $51,168
- Composite
- 19.17/100
- National rank
- #8819
- State rank
- #418 of 472 in NJ
Livability — Vineland
- Score
- 66/100
- State rank
- #363
- US rank
- #12180
Category grades
Schools grade is shown separately in the Schools card above.
Census & demographics
- Census place
- Vineland, NJ
- County
- Cumberland County · 80,266 people
- City population
- 45,038
- Metro
- Vineland-Bridgeton, NJ
- Population (ZIP)
- 35,228
- Household income
- $67,496
- Rent vs Own
- Severe rent burden
- 1761.0
Population outlook (Cumberland County) Hauer SSP2
- Today (2025)
- 152,743 people
- By 2030
- 150,373 · -1.6%
- By 2040
- 146,881 · -3.8%
- By 2050
- 142,653 · -6.6%
- By 2075
- 129,468 · -15.2%
- By 2100
- 107,456 · -29.6%
Race, ethnicity, and origin ACS 2023
- Neighborhood character
- Diverse neighborhood (Simpson 0.60)
- Race & ethnicity
- White 59% Hispanic / Latino 17% Black 15% Two or more races 11% Asian 2%
- Hispanic origin (detail)
- Mexican 4% Puerto Rican 10%
- Common ancestry
- Romanian 4% Lithuanian 2% Slovak 1%
- Foreign-born
- 7% · Canada
- Languages at home
- 85% English-only · Spanish 11% Other Indo-European 1% Other Asian/Pacific 1%
Political lean MEDSL · Cumberland
- 2024 margin
- Toss-up / Even · D 47.6% · R 51.3% · Other 1.1%
- 2008→2024 swing
- -25.4pp toward R · 2008: 21.6pp · 2024: -3.8pp
- All cycles
- 2024: R+3.8 2020: D+6.0 2016: D+5.3 2012: D+23.1 2008: D+21.6
Not yet ingested
- Civics
- —
Market trends
- HPI YoY
- ▼ -111.45%
- Current HPI
- 274.8011
- Rent YoY
- ▲ 1.94%
- Metro
- Vineland-Bridgeton, NJ
- State GDP YoY
- ▲ 2.05%
- F500 in state
- 34
Industry mix (Fortune 500 HQ in NJ)
| Industry | F500 HQs | Revenue |
|---|---|---|
| Consumer Goods | 3 | $31B |
|
||
| Pharmaceuticals | 2 | $153B |
|
||
| Technology | 2 | $21B |
|
||
| Insurance | 2 | $20B |
|
||
| Healthcare | 2 | $19B |
|
||
| Financial Services | 1 | $70B |
|
||
Price history
+91.7% since first listed4 events — show timeline
- 2026-04-29 Listed $114,995 BRIGHT MLS
- 2021-12-20 Sold (MLS) $60,000 BRIGHT MLS
- 2021-11-29 Pending — BRIGHT MLS
- 2021-10-25 Listed $60,000 BRIGHT MLS
Cash-flow waterfall
monthlySold comps — $/sqft
last 12 mo · ≤1 miLoading sold comps…