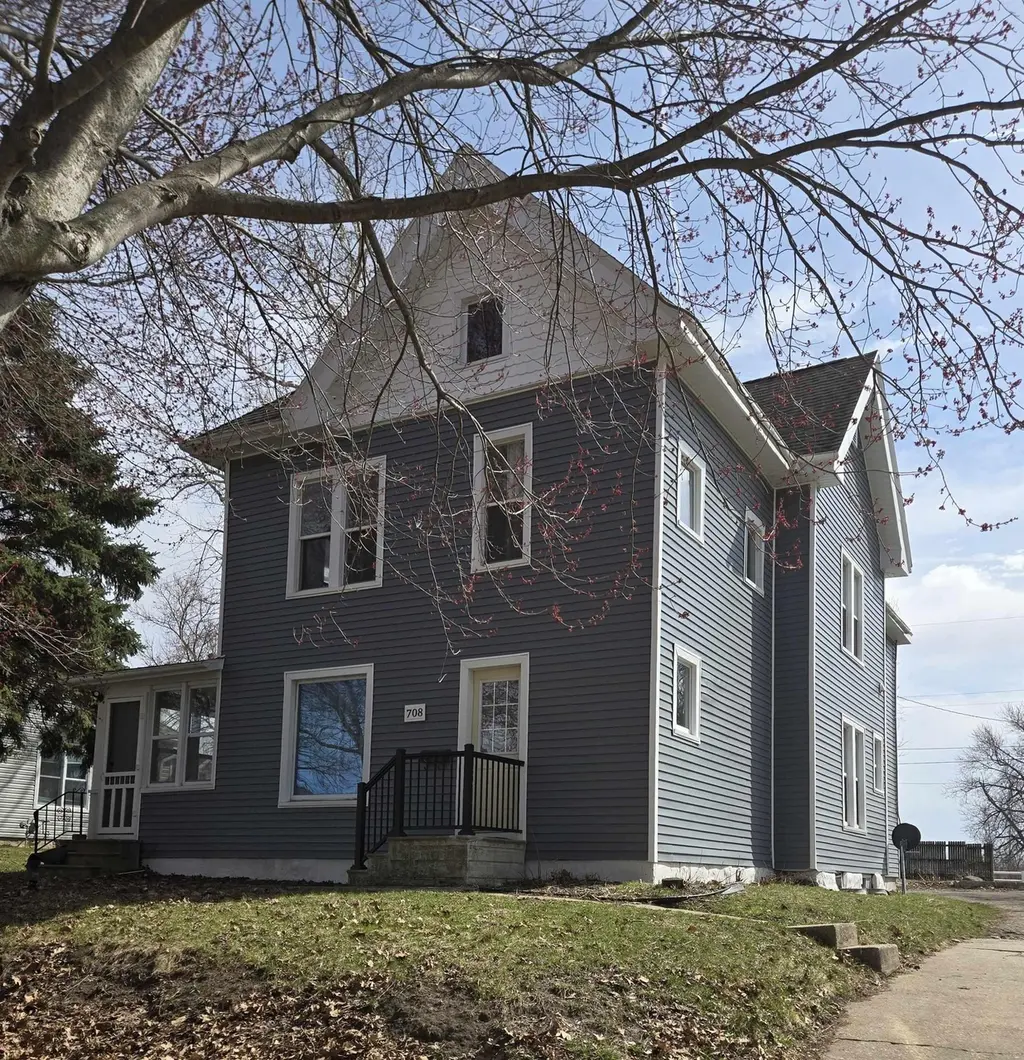
708 Park St · Reinbeck, IA
Flood risk 1/10 · Minimal
- FEMA flood zone
- X (unshaded)
- Chance of flooding over 30 yrs
- 0.0%
- Est. flood insurance / yr
- $473 – $860
Fire risk 1/10 · Minimal
- Est. fire insurance / yr
- $902 – $1,676
Heat risk 2/10 · Minimal
- Hot days now (above 101°F)
- 7 days/yr
- Hot days in 30 yrs
- 16 days/yr
Wind risk 2/10 · Minimal
- Chance of severe wind over 30 yrs
- —
Air-quality risk 1/10 · Minimal
- Unhealthy air days now
- 0 days/yr
- Unhealthy air days in 30 yrs
- 0 days/yr
Risk factors via First Street. Map © Google.
Why this score? — see what drove the C+ grade
The composite is a weighted blend of 9 inputs, each scored 0–100. Each bar is that input's sub-score; the figure is the points it added to the 100-point composite (weight × sub-score).
- Cash flow +15.0/30.0
- ARV discount +15.0/15.0
- Appreciation +10.0/10.0
- Schools +6.4/10.0
- DSCR +4.6/10.0
- Livability +3.5/5.0
- 1% rule +3.4/10.0
- Rent growth +2.5/5.0
- Condition / age +2.5/5.0
$147,800
🖨 Deal sheet 📄 Offer letter ✓ Due diligence
Listing remarks
Charming 2 story home in Reinbeck; recently updated and move in ready. The main level features an updated kitchen with new cabinets and countertops. The living room and dining room feature beautiful hardwood floors--ideal for everyday living and entertaining. Just off the dining room is a flexible space with direct access to the half bathroom, perfect for a home office, playroom, or potential bedroom. Upstairs you will find four bedrooms, two full bathrooms, and laundry hook ups, as well as new flooring throughout. Fresh new paint completes the home. Schedule your showing today! Information is thought to be accurate but not guaranteed. Listing Agent is related to Seller.
Key facts
- New flooring
- New paint
- New cabinets
Tags
Property features AI
Finance
- Other: Residential property
Exterior
- Parking: No designated parking
- Utilities: Public water; Public sewer
- Home design: Single-family residence; 2 stories
- Construction: Vinyl siding
- Exterior features: Asphalt shingle roof; Lot approximately 70 x 140 (0.23 acre); Zoned R-1
Interior
- Bathrooms: 2 full bathrooms; 1 half bathroom
- Heating & cooling: Steam heating; Natural gas heating; No central cooling
- Interior features: Basement with block foundation; No fireplace
Neighborhood map
What this means for you Summary
Snapshot
- This is a 6-bed/2.5-bath single-family listed at $148k.
Deal economics
- At list price, monthly cash flow is $47 ($567/yr) — positive.
- The deal already cash-flows at list — no discount required.
- To meet the 1% rule (rent ≥ 1% of price), the offer needs to be $124k (15.8% below list).
- Recommended offer: $124k (15.8% below list) — sets the bar for 1% rule.
Location & tenants
- Location reads 70/100 on livability (#382 in IA) — a middle-class / working-renter tenant base. Strengths: crime A+, cost of living A+, housing A+; Watch: amenities F, commute F.
- Gladbrook-Reinbeck Community School District (rural): math 76% / reading 74% proficiency, ranked #71 of 289 in IA (top 25%) — strong family-tenant draw, lease renewals of 3-5y typical.
- Zoned schools: Gladbrook-Reinbeck Elementary School (math 77% / reading 67%, grade A-, #181 of 616 statewide, top 34%, 253 students, 33% FRL); Gladbrook-Reinbeck Jr. High & High School (math 77% / reading 77%, grade A-, #60 of 336 statewide, top 21%, 212 students, 35% FRL).
- Market conditions: 14 active listings in the ZIP; 14 units permitted in Grundy County in 2024 (0 in 5+ unit buildings).
Forward outlook
- In year one you build about $16k of equity ($1k loan paydown + $15k appreciation (10.0% local appreciation)).
- At projected returns (10.0% appreciation + 3.0% rent growth), your $41k cash investment doubles in ~3 years — after that, you're playing with house money.
- By year 3, paydown + projected appreciation supports a ~$40k cash-out refi (75% LTV) — recoverable capital for the next deal without selling this one.
Negotiation context
- It's been on market 139 days — a 12% lower offer ($130k) is reasonable based on typical stale-listing flexibility.
- 2 sale attempts; this cycle's ask has dropped $22k (13%) from the opening price — seller is motivated, your offer sets the floor, not the list.
- Current owner paid $70k; list at $148k implies a 111% gain — meaningful room to come down on a strong offer.
Risks & watch-outs
- Watch-outs: built in 1925 — expect roof / HVAC / electrical / plumbing capex.
Questions for the listing agent
- It's been on market 139 days. Have you received any prior offers? Is the seller open to a 16% concession, seller financing, or rate buy-down credit?
- Built in 1925 — when were the roof, HVAC, electrical panel, plumbing, and water heater last replaced?
- Why hasn't it sold? Are there any deal-killer items the seller is aware of (foundation, flood, title, zoning, code violations)?
- Is there a deadline driving the sale (1031 exchange, divorce, estate, relocation)? That informs how much negotiation room exists.
- Schools are A-rated — typically a magnet for longer-tenancy family renters. What's the average tenant stay here, and is there a school-zone premium baked into asking?
- What's the average days-on-market for RENTAL listings here right now (not sales)? A rising rental-DOM trend means longer vacancies and softer asking-rent achievability than the comps imply.
- What's the recent tenant-quality profile in this submarket — average credit score on applications, eviction rate, late-payment / NSF rate, and stable-employment percentage? A property-management company in the area should have these aggregated.
- How much new for-sale + rental construction is in the pipeline within 1–3 miles? Heavy new supply typically softens prices + rents 12–24 months out; constrained supply supports both.
Investment metrics
- 1% rule
- 0.84% ✗
- Cap rate
- 6.68%
- Cash-on-cash
- 1.37%
- DSCR
- 1.06
- GRM
- 9.9
CMA / ARV
- ARV (on-the-fly)
- $197,030
- Comps found
- 1
Show comp detail 1 sale within ~0.75 mi
| Address | Dist | Beds/Ba | Sqft | Sold | Price | $/sf | Match |
|---|---|---|---|---|---|---|---|
| 305 Broad St | 0.27mi | 5/2.0 (-1) | 2,124 (-8%) | 3mo | $180,000 | $85 | 64 |
Match score weights: distance 35% · size 25% · config 20% · recency 20%. Top-matched comps best support the ARV.
Projected returns pro-forma
10.0% appreciation · 3.0% rent growth · sell at horizon
- IRR
- 25.3%
- Equity multiple
- 3.02×
- Total profit
- $83,471
- Equity at exit
- $133,150
- IRR
- 22.2%
- Equity multiple
- 6.88×
- Total profit
- $243,374
- Equity at exit
- $287,143
Cash invested: $41,384 (down + closing). Projections, not guarantees.
Landlord ↔ Tenant lean methodology
- Overall (STATE)
- 83 Strongly Landlord-Friendly
- State Iowa
- 83 Strongly Landlord-Friendly · R+6
- County
- — inherits STATE
- City
- — inherits STATE
ZIP-level market 50669
- Home prices YoY
- 4.9%
- Active inventory
- 14
- Price-to-rent
- 9.9×
Monthly cashflow live
- Estimated rent
- $1,244 medium interval (Pro) →
- Mortgage (P&I)
- −$775
- Tax from tax record
- −$99 /mo · $1,190/yr
- Insurance
- −$62
- HOA
- −$0
- Vacancy / Maint / Mgmt
- −$261
- Net cashflow
- $47
Break-even live
UW: 25.0% down · 7.5% · 30yr · 1.5% tax · 5.0% vac · 8.0% maint · 8.0% mgmt
Financing live
Cash to close
- Down payment
- $36,950
- Closing costs
- $4,434
- Reserves months
- —
- Total cash needed
- —
Loan-product check · same deal, 3 products live
Conventional
25% down · 7.5% · 30yr
- Down + closing
- —
- Monthly P&I
- —
- Monthly cashflow
- —
- DSCR
- —
- Eligible?
- —
Personal DTI + credit; lowest rate.
DSCR
20% down · 8.5% · 30yr
- Down + closing
- —
- Monthly P&I
- —
- Monthly cashflow
- —
- DSCR
- —
- Eligible?
- —
No personal income docs; deal must DSCR.
Hard money
10% down · 12.0% · 12mo
- Down + closing
- —
- Monthly P&I
- —
- Monthly cashflow
- —
- DSCR
- —
- Eligible?
- —
Short-term bridge; refi at stabilization.
Listing history 17 events
-
2026-06-03status $147,800 Pending 139 DOM
-
2026-06-02days on market $147,800 Active 139 DOM
-
2026-06-01days on market $147,800 Active 138 DOM
-
2026-05-31days on market $147,800 Active 137 DOM
-
2026-05-30days on market $147,800 Active 136 DOM
-
2026-05-20price $147,800
-
2026-05-18status Active
-
2026-04-16status Pending
-
2026-03-26price $147,900
-
2026-03-04price $149,900
-
2026-02-18price $152,900
-
2026-02-03price $155,900
-
2026-01-21price $159,900
-
2026-01-02price $164,900
-
2025-12-12$169,900 Active
-
2022-07-23price $960
-
2009-11-20soldstatus $69,900
ⓘ Source: listings_history table (triggers on properties + properties_extension) + one-shot
backfill from property_details.listing_events for pre-trigger history.
Tax reassessment forecast IA · Partial reset (capped growth)
- Current annual tax
- $1,190 · $99/mo
- Projected year-2 tax
- $1,755 · $146/mo
- Expected delta
- +$565/yr (+$47/mo · 47.5%)
ⓘ Screening estimate from a state-policy table — verify with the county assessor before closing.
Climate risk First Street
- Flood 1/10 Low FEMA zone X (unshaded) · 0% chance over 30 yrs
- Wildfire 1/10 Low
- Heat 2/10 Low 7 d/yr ≥101°F today · 16 d/yr by 30 yrs out
- Wind 2/10 Low
- Air quality 1/10 Low 0 unhealthy d/yr today · 0 by 30 yrs out
Nearby sold comps map
Loading sold comps map…
Walkable amenities ~0.75 mi
Loading nearby amenities…
Taxation est. · year 1
- Rental income
- $14,933
- − Mortgage interest
- −$8,279
- − Property taxes
- −$1,190
- − Insurance
- −$739
- − Repairs & maintenance
- −$1,195
- − Management
- −$1,195
- − Depreciation
- −$4,300
- Taxable loss
- −$1,964
- Est. tax savings @ 24.0%
- +$471
- After-tax cash flow
- $1,038/yr
For passive investors: Depreciation is non-cash, so a rental often shows a tax loss while cash-flowing — sheltering income. Rental losses are passive: they offset passive income freely, and up to $25,000/yr can offset ordinary (W-2) income if you actively participate and your MAGI is under $100k (phasing out to $0 by $150k); unused losses carry forward. On sale, claimed depreciation is recaptured at up to 25%, and gains may owe capital-gains tax (a 1031 exchange can defer both). Figures are a year-1 estimate at your 24.0% rate — not tax advice; consult a CPA.
Schools (NCES district)
- District
- Gladbrook-Reinbeck Community School District
- NCES district ID
- 1912660
- Math proficiency
- 76% ▼ -3.00%
- Reading proficiency
- 74% ▲ 9.00%
- Median HH income
- $55,866
- Composite
- 64.09/100
- National rank
- #576
- State rank
- #71 of 289 in IA
Livability — Reinbeck
- Score
- 70/100
- State rank
- #382
- US rank
- #8130
Category grades
Schools grade is shown separately in the Schools card above.
Census & demographics
- Census place
- Reinbeck, IA
- Population (ZIP)
- 2,447
Population outlook (Grundy County) Hauer SSP2
- Today (2025)
- 12,452 people
- By 2030
- 12,452 · +0.0%
- By 2040
- 12,437 · -0.1%
- By 2050
- 12,370 · -0.7%
- By 2075
- 12,495 · +0.3%
- By 2100
- 11,823 · -5.1%
Race, ethnicity, and origin ACS 2023
- Neighborhood character
- Predominantly White (95%)
- Race & ethnicity
- White 95% Hispanic / Latino 3% Two or more races 3% Native American 1%
- Common ancestry
- Portuguese 3% Slovak 1% Iranian 1%
- Foreign-born
- 2% · Canada
- Languages at home
- 98% English-only · Spanish 1%
Political lean MEDSL · Grundy
- 2024 margin
- Solid R (+41.8) · D 28.3% · R 70.1% · Other 1.6%
- 2008→2024 swing
- -24.9pp toward R · 2008: -16.9pp · 2024: -41.8pp
- All cycles
- 2024: R+41.8 2020: R+37.4 2016: R+39.5 2012: R+23.1 2008: R+16.9
Not yet ingested
- Civics
- —
Market trends
- HPI YoY
- ▲ 11.93%
- Current HPI
- 257.04
- Rent YoY
- —
- Metro
- —
- State GDP YoY
- ▲ 2.48%
- F500 in state
- 4
Industry mix (Fortune 500 HQ in IA)
| Industry | F500 HQs | Revenue |
|---|---|---|
| Financial Services | 1 | $16B |
|
||
| Retail / Convenience | 1 | $15B |
|
||
Price history
+111.4% since first listed12 events — show timeline
- 2026-05-20 Price Changed $147,800 NEIRBR as distributed by MLS GRID
- 2026-05-18 Relisted — NEIRBR as distributed by MLS GRID
- 2026-04-16 Pending — NEIRBR as distributed by MLS GRID
- 2026-03-26 Price Changed $147,900 NEIRBR as distributed by MLS GRID
- 2026-03-04 Price Changed $149,900 NEIRBR as distributed by MLS GRID
- 2026-02-18 Price Changed $152,900 NEIRBR as distributed by MLS GRID
- 2026-02-03 Price Changed $155,900 NEIRBR as distributed by MLS GRID
- 2026-01-21 Price Changed $159,900 NEIRBR as distributed by MLS GRID
- 2026-01-02 Price Changed $164,900 NEIRBR as distributed by MLS GRID
- 2025-12-12 Listed $169,900 NEIRBR as distributed by MLS GRID
- 2022-07-23 Price Changed $960 RENT.
- 2009-11-20 Sold (Public Records) $69,900 Public Records
Property tax history
+2.0%/yrLatest (2025): $1,190 · +5.5% YoY. Source: county tax records.
Cash-flow waterfall
monthlySold comps — $/sqft
last 12 mo · ≤1 miLoading sold comps…