2619 State Route 244 · Alfred, NY
Flood risk 1/10 · Minimal
- FEMA flood zone
- —
- Chance of flooding over 30 yrs
- 0.0%
- Est. flood insurance / yr
- —
Fire risk 3/10 · Minor
- Est. fire insurance / yr
- $691 – $1,283
Heat risk 1/10 · Minimal
- Hot days now (above 88°F)
- 7 days/yr
- Hot days in 30 yrs
- 16 days/yr
Wind risk 1/10 · Minimal
- Chance of severe wind over 30 yrs
- —
Air-quality risk 1/10 · Minimal
- Unhealthy air days now
- 0 days/yr
- Unhealthy air days in 30 yrs
- 0 days/yr
Risk factors via First Street. Map © Google.
Why this score? — see what drove the D+ grade
The composite is a weighted blend of 9 inputs, each scored 0–100. Each bar is that input's sub-score; the figure is the points it added to the 100-point composite (weight × sub-score).
- ARV discount +15.0/15.0
- Appreciation +8.4/10.0
- Cash flow +7.7/30.0
- Schools +4.5/10.0
- Livability +4.0/5.0
- 1% rule +3.7/10.0
- Rent growth +2.5/5.0
- Condition / age +2.5/5.0
- DSCR +1.8/10.0
$149,900
🖨 Deal sheet (PDF) 📄 Offer letter ✓ Due diligence
Listing remarks
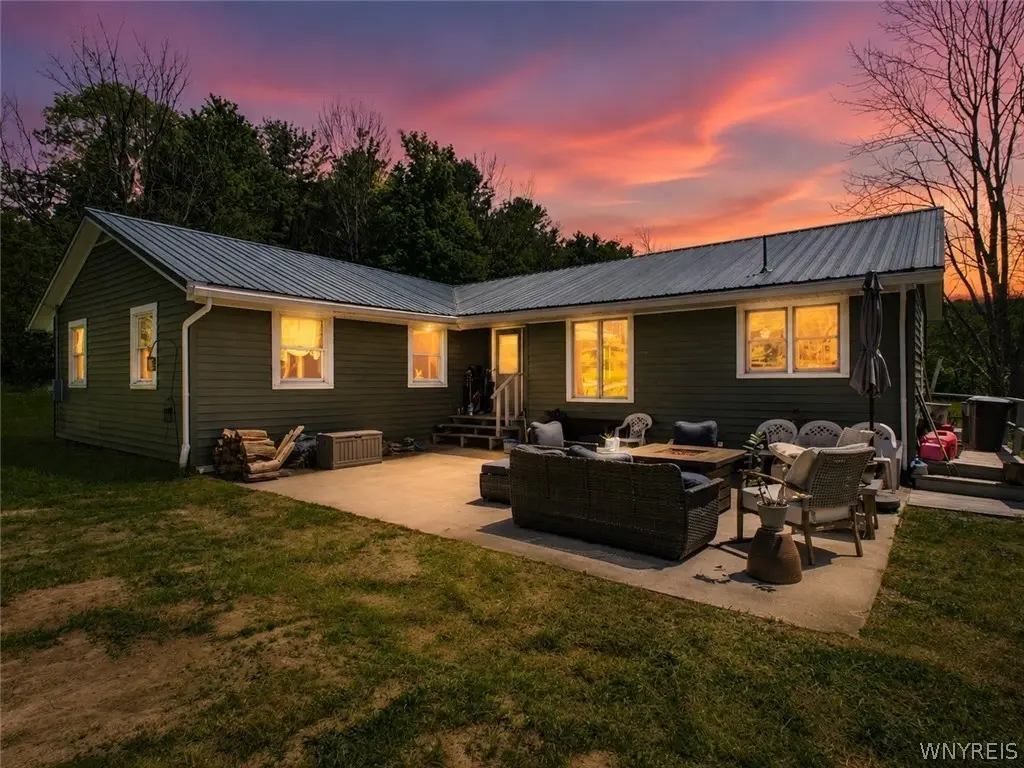
Tucked along State Route 244 with direct access to state land, this renovated 4-bedroom, 2-bathroom home delivers space, privacy, and location that are hard to find at this price point. Step through double entry doors into a home updated top to bottom within the last 5 years. Four generous bedrooms, two full baths, and a layout built for real everyday living. Outside, a large concrete patio sets the stage for entertaining or simply enjoying the quiet that comes with bordering protected state land. No rear neighbors, no future development, just open space that stays open. Minutes from Alfred University and Alfred State, this one fits investors, faculty, or anyone looking to plant roots in th
Key facts
- Large concrete patio
- Open space
- No rear neighbors
Tags
Property features AI
Exterior
- Parking: No garage
- Utilities: Well water; Septic tank
- Home design: Single-story home; Resale property; Vinyl siding
- Construction: Built as an existing structure; Vinyl siding exterior; Block foundation
- Exterior features: Gravel driveway; Irregular lot with 150 x 175 dimensions; Main thoroughfare frontage
Interior
- Kitchen: Eat-in kitchen
- Bedrooms: 4 main-level bedrooms
- Flooring: Hardwood; Vinyl; Varies
- Bathrooms: 2 full bathrooms (both on the main level)
- Heating & cooling: Propane forced-air heating
- Interior features: Eat-in kitchen; Main-level primary bedroom; Full basement; One fireplace
- Laundry & utility: Washer; Dryer; Electric water heater
Neighborhood map
What this means for you Summary
Snapshot
- This is a 4-bed/2.0-bath single-family listed at $150k.
Deal economics
- At list price, monthly cash flow is $-175 ($-2k/yr) — negative.
- To cash-flow at today's rent, offer at most $119k (20.6% below list).
- To meet the 1% rule (rent ≥ 1% of price), the offer needs to be $130k (13.2% below list).
- Recommended offer: $119k (20.6% below list) — sets the bar for cash-flow.
Location & tenants
- Location reads 80/100 on livability (#110 in NY, #1,824 nationally) — a professional / high-income tenant draw. Strengths: commute A+, cost of living A+, health & safety A+; Watch: crime D+, employment F.
- Alfred-Almond Central School District (rural): math 50% / reading 55% proficiency, ranked #345 of 590 in NY (top 58%) — acceptable for families but not a draw, mixed tenant base, ~2y average lease.
- Zoned schools: Alfred-Almond Elementary School (math 42% / reading 52%, grade D-, #1,195 of 2,108 statewide, top 60%, 279 students, 47% FRL); Alfred-Almond Junior-Senior High School (math 57% / reading 62%, grade C+, #851 of 1,100 statewide, top 80%, 272 students, 42% FRL) — zoned schools average 45% FRL vs 27% district-wide (17 pts higher); higher-poverty schools than district average — tighter screening recommended.
- Market conditions: 19 active listings in the ZIP; 87 units permitted in Allegany County in 2024 (0 in 5+ unit buildings).
Forward outlook
- In year one you build about $11k of equity ($1k loan paydown + $10k appreciation (6.8% local appreciation)).
- Allegany County population projected at -26% by 2050 — secular population decline; favor cash flow + early exit over multi-decade hold.
- By year 4, paydown + projected appreciation supports a ~$38k cash-out refi (75% LTV) — recoverable capital for the next deal without selling this one.
Negotiation context
- Only 4 days on market — expect competitive offers; lowballing is unlikely to land.
- 2 sale attempts since 4y ago with the ask held roughly flat each time — persistent listings suggest the price (not the market) is what's stuck; bring a comps-based counter.
- Current owner paid $30k; list at $150k implies a 400% gain — meaningful room to come down on a strong offer.
Risks & watch-outs
- Watch-outs: property tax is 2.8% of price.
Questions for the listing agent
- What do current leases actually rent for vs. the listed asking? Can we see a recent rent roll and the last 12 months of T-12 income?
- Built in 1971 — when were the roof, HVAC, electrical panel, plumbing, and water heater last replaced?
- Property tax is high relative to price — has the assessment been appealed recently, and will the sale trigger a re-assessment?
- Is there a deadline driving the sale (1031 exchange, divorce, estate, relocation)? That informs how much negotiation room exists.
- Crime grade is D in this area — have there been break-ins, vandalism, or insurance claims at this property in the last 3 years? What carrier currently insures it and at what premium?
- The area grade is low — what's the realistic commute time and amenity access for the typical tenant pool here? Any planned neighborhood developments (good or bad) we should know about?
- What's the average days-on-market for RENTAL listings here right now (not sales)? A rising rental-DOM trend means longer vacancies and softer asking-rent achievability than the comps imply.
- What's the recent tenant-quality profile in this submarket — average credit score on applications, eviction rate, late-payment / NSF rate, and stable-employment percentage? A property-management company in the area should have these aggregated.
- How much new for-sale + rental construction is in the pipeline within 1–3 miles? Heavy new supply typically softens prices + rents 12–24 months out; constrained supply supports both.
Investment metrics
- 1% rule
- 0.87% ✗
- Cap rate
- 4.89%
- Cash-on-cash
- -5.00%
- DSCR
- 0.78
- GRM
- 9.6
CMA / ARV
- ARV (on-the-fly)
- $210,680
- Comps found
- 1
Show comp detail 1 sale within ~0.75 mi
| Address | Dist | Beds/Ba | Sqft | Sold | Price | $/sf | Match |
|---|---|---|---|---|---|---|---|
| 5976 Decker Rd | 0.60mi | 4/1.0 | 1,672 (-9%) | 11mo | $192,900 | $115 | 44 |
Match score weights: distance 35% · size 25% · config 20% · recency 20%. Top-matched comps best support the ARV.
Projected returns pro-forma
6.77% appreciation · 3.0% rent growth · sell at horizon
- IRR
- 13.3%
- Equity multiple
- 1.93×
- Total profit
- $39,204
- Equity at exit
- $101,616
- IRR
- 13.7%
- Equity multiple
- 3.93×
- Total profit
- $122,781
- Equity at exit
- $191,011
Cash invested: $41,972 (down + closing). Projections, not guarantees.
Landlord ↔ Tenant lean methodology
- Overall (STATE)
- 15 Strongly Tenant-Friendly
- State New York
- 15 Strongly Tenant-Friendly · D+10
- County
- — inherits STATE
- City
- — inherits STATE
ZIP-level market 14813
- Home prices YoY
- 2.6%
- Active inventory
- 19
- Price-to-rent
- 9.6×
Monthly cashflow live
- Estimated rent
- $1,302 medium interval (Pro) →
- Mortgage (P&I)
- −$786
- Tax from tax record
- −$355 /mo · $4,257/yr
- Insurance
- −$62
- HOA
- −$0
- Vacancy / Maint / Mgmt
- −$273
- Net cashflow
- $-175
Break-even live
Sensitivity live
| Price | -10% $-90 | -5% $-132 | +0% $-175 | +5% $-217 | +10% $-260 |
|---|---|---|---|---|---|
| Rent | -10% $-278 | -5% $-226 | +0% $-175 | +5% $-123 | +10% $-72 |
| Rate | -1.0pp $-99 | -0.5pp $-137 | base $-175 | +0.5pp $-214 | +1.0pp $-253 |
UW: 25.0% down · 7.5% · 30yr · 1.5% tax · 5.0% vac · 8.0% maint · 8.0% mgmt
Financing live
Cash to close
- Down payment
- $37,475
- Closing costs
- $4,497
- Reserves months
- —
- Total cash needed
- —
Loan-product check · same deal, 3 products live
Conventional
25% down · 7.5% · 30yr
- Down + closing
- —
- Monthly P&I
- —
- Monthly cashflow
- —
- DSCR
- —
- Eligible?
- —
Personal DTI + credit; lowest rate.
DSCR
20% down · 8.5% · 30yr
- Down + closing
- —
- Monthly P&I
- —
- Monthly cashflow
- —
- DSCR
- —
- Eligible?
- —
No personal income docs; deal must DSCR.
Hard money
10% down · 12.0% · 12mo
- Down + closing
- —
- Monthly P&I
- —
- Monthly cashflow
- —
- DSCR
- —
- Eligible?
- —
Short-term bridge; refi at stabilization.
Listing history 4 events
-
2026-06-13status $149,900 Pending 4 DOM
-
2026-06-12days on market $149,900 Active 4 DOM
-
2026-06-09remarks 699-char remark
-
2026-06-09$149,900 Active 1 DOM
ⓘ Source: listings_history table (triggers on properties + properties_extension) + one-shot
backfill from property_details.listing_events for pre-trigger history.
Tax reassessment forecast NY · Partial reset (capped growth)
- Current annual tax
- $4,257 · $355/mo
- Projected year-2 tax
- $4,257 · $355/mo
- Expected delta
- $0/yr ($0/mo · 0.0%)
ⓘ Screening estimate from a state-policy table — verify with the county assessor before closing.
Climate risk First Street
- Flood 1/10 Low 0% chance over 30 yrs
- Wildfire 3/10 Moderate
- Heat 1/10 Low 7 d/yr ≥88°F today · 16 d/yr by 30 yrs out
- Wind 1/10 Low
- Air quality 1/10 Low 0 unhealthy d/yr today · 0 by 30 yrs out
Nearby sold comps map
Loading sold comps map…
Walkable amenities ~0.75 mi
Loading nearby amenities…
Taxation est. · year 1
- Rental income
- $15,622
- − Mortgage interest
- −$8,397
- − Property taxes
- −$4,257
- − Insurance
- −$750
- − Repairs & maintenance
- −$1,250
- − Management
- −$1,250
- − Depreciation
- −$4,361
- Taxable loss
- −$4,642
- Est. tax savings @ 24.0%
- +$1,114
- After-tax cash flow
- $-984/yr
For passive investors: Depreciation is non-cash, so a rental often shows a tax loss while cash-flowing — sheltering income. Rental losses are passive: they offset passive income freely, and up to $25,000/yr can offset ordinary (W-2) income if you actively participate and your MAGI is under $100k (phasing out to $0 by $150k); unused losses carry forward. On sale, claimed depreciation is recaptured at up to 25%, and gains may owe capital-gains tax (a 1031 exchange can defer both). Figures are a year-1 estimate at your 24.0% rate — not tax advice; consult a CPA.
Schools (NCES district)
- District
- Alfred-Almond Central School District
- NCES district ID
- 3602700
- Math proficiency
- 50% ▼ -7.00%
- Reading proficiency
- 55% ▼ -3.00%
- Median HH income
- $47,682
- Composite
- 44.62/100
- National rank
- #2772
- State rank
- #345 of 590 in NY
Livability — Alfred
- Score
- 80/100
- State rank
- #110
- US rank
- #1824
Category grades
Schools grade is shown separately in the Schools card above.
Census & demographics
- City population
- 6,118
- Population (ZIP)
- 2,465
Population outlook (Allegany County) Hauer SSP2
- Today (2025)
- 45,362 people
- By 2030
- 43,078 · -5.0%
- By 2040
- 38,031 · -16.2%
- By 2050
- 33,634 · -25.9%
- By 2075
- 25,285 · -44.3%
- By 2100
- 18,902 · -58.3%
Race, ethnicity, and origin ACS 2023
- Neighborhood character
- Predominantly White (97%)
- Race & ethnicity
- White 97% Black 2%
- Common ancestry
- Lithuanian 4% Romanian 4% Slovak 2%
- Foreign-born
- 0%
Political lean MEDSL · Allegany
- 2024 margin
- Solid R (+43.2) · D 28.4% · R 71.6%
- 2008→2024 swing
- -21.5pp toward R · 2008: -21.7pp · 2024: -43.2pp
- All cycles
- 2024: R+43.2 2020: R+38.9 2016: R+42.3 2012: R+25.3 2008: R+21.7
Not yet ingested
- Civics
- —
Market trends
- HPI YoY
- ▲ 6.77%
- Current HPI
- 271.7193
- Rent YoY
- —
- Metro
- —
- State GDP YoY
- ▲ 2.60%
- F500 in state
- 92
Industry mix (Fortune 500 HQ in NY)
| Industry | F500 HQs | Revenue |
|---|---|---|
| Financial Services | 10 | $950B |
|
||
| Consumer Goods | 9 | $162B |
|
||
| Insurance | 4 | $225B |
|
||
| Telecommunications | 2 | $144B |
|
||
| Pharmaceuticals | 2 | $112B |
|
||
| Media / Entertainment | 2 | $69B |
|
||
Price history
+399.7% since first listed4 events — show timeline
- 2026-06-08 Listed $149,900 WNYREIS
- 2024-07-31 Listing Removed — CNYIS
- 2022-08-11 Listed $159,900 CNYIS
- 2006-09-01 Sold (Public Records) $30,000 Public Records
Property tax history
+4.4%/yrLatest (2025): $4,257 · +313.4% YoY. Source: county tax records.
Cash-flow waterfall
monthlySold comps — $/sqft
last 12 mo · ≤1 miLoading sold comps…