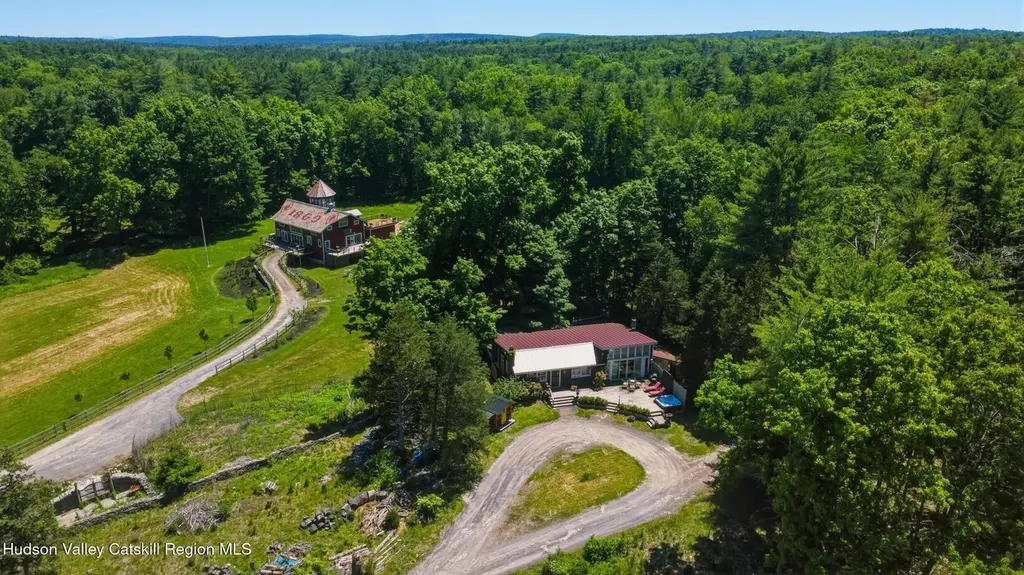
5 Downer Ln · Zena, NY
Flood risk 6/10 · Moderate
- FEMA flood zone
- X (shaded)
- Chance of flooding over 30 yrs
- 0.71%
- Est. flood insurance / yr
- $507 – $1,088
Fire risk 3/10 · Minor
- Est. fire insurance / yr
- $691 – $1,283
Heat risk 3/10 · Minor
- Hot days now (above 97°F)
- 7 days/yr
- Hot days in 30 yrs
- 15 days/yr
Wind risk 3/10 · Minor
- Chance of severe wind over 30 yrs
- 7.0%
Air-quality risk 2/10 · Minimal
- Unhealthy air days now
- 0 days/yr
- Unhealthy air days in 30 yrs
- 1 days/yr
Risk factors via First Street. Map © Google.
Why this score? — see what drove the F grade
The composite is a weighted blend of 9 inputs, each scored 0–100. Each bar is that input's sub-score; the figure is the points it added to the 100-point composite (weight × sub-score).
- ARV discount +7.5/15.0
- Schools +4.4/10.0
- Livability +3.0/5.0
- Rent growth +2.5/5.0
- Condition / age +2.5/5.0
- Cash flow +0.0/30.0
- 1% rule +0.0/10.0
- DSCR +0.0/10.0
- Appreciation +0.0/10.0
$1,200,000
🖨 Deal sheet (PDF) 📄 Offer letter ✓ Due diligence
Listing remarks
Set on six bucolic acres along one of Woodstock's most scenic country roads, this extraordinary barn residence captures sweeping views of Overlook Mountain, the timeless beauty of the Hudson Valley landscape, and the quiet rhythm of a true farm setting. Reimagined from a historic 19th-century barn that was carefully disassembled and relocated from farther north, the home is a remarkable example of craftsmanship, creativity, and preservation. Following the tradition of Woodstock's celebrated handmade houses, the interiors were assembled over many years from salvaged architectural elements, reclaimed materials, and one-of-a-kind finds — each room richly layered with hand-hewn timbers, a
Key facts
- Bucolic acres
- Reclaimed materials
- Sweeping views
Tags
Property features AI
Exterior
- Parking: Driveway; Off-street parking
- Utilities: Central Hudson electric; Propane; Public water connected; Septic tank; Cable connected
- Home design: Single family residence
- Construction: Frame and wood siding construction; Other foundation type
- Exterior features: Private pool; Not waterfront
Interior
- Kitchen: Dishwasher; Range; Refrigerator
- Bedrooms: 10 total rooms (bedroom count not specified)
- Bathrooms: 4 full bathrooms
- Heating & cooling: Propane heating
- Interior features: Built-in features; Chandelier; High ceilings; Natural woodwork; Original details; Soaking tub; Has fireplace; Partial, storage and walk-out basement
- Laundry & utility: Washer; Dryer; Laundry in basement
Neighborhood map
What this means for you Summary
Snapshot
- This is a 2-bed/3.5-bath single-family listed at $1.20M.
Deal economics
- At list price, monthly cash flow is $-6k ($-74k/yr) — negative.
- To cash-flow at today's rent, offer at most $422k (64.9% below list).
- To meet the 1% rule (rent ≥ 1% of price), the offer needs to be $369k (69.3% below list).
- Recommended offer: $369k (69.3% below list) — sets the bar for 1% rule.
Location & tenants
- Location reads 60/100 on livability (#966 in NY) — a middle-class / working-renter tenant base. Strengths: employment A+, housing A+; Watch: crime C-, amenities F, commute F.
- Kingston City School District (urban): math 44% / reading 59% proficiency, ranked #355 of 590 in NY (top 60%) — acceptable for families but not a draw, mixed tenant base, ~2y average lease.
- Zoned schools: E R Crosby Elementary School (math 37% / reading 57%, grade D-, #1,195 of 2,108 statewide, top 60%, 303 students, 61% FRL); M Clifford Miller Middle School (math 21% / reading 37%, grade F, #566 of 729 statewide, top 78%, 822 students, 65% FRL); Kingston High School (math 94% / reading 91%, grade A+, #153 of 1,100 statewide, top 14%, 1,856 students, 85% FRL) — zoned schools average 70% FRL vs 45% district-wide (25 pts higher); higher-poverty schools than district average — tighter screening recommended.
- Market conditions: 71 active listings in the ZIP; 464 units permitted in Ulster County in 2024 (170 in 5+ unit buildings).
Forward outlook
- Local home prices are declining (-3.0%/yr); year-one equity from $8k of loan paydown is wiped out by about $36k of value loss. Plan a longer hold.
- Ulster County population projected at -14% by 2050 — secular population decline; favor cash flow + early exit over multi-decade hold.
Negotiation context
- It's been on market 15 days — a 2% lower offer ($1.18M) is reasonable based on typical stale-listing flexibility.
- 5 sale attempts with the ask held roughly flat each time — persistent listings suggest the price (not the market) is what's stuck; bring a comps-based counter.
- Current owner paid $19k; list at $1.20M implies a 6300% gain — meaningful room to come down on a strong offer.
Risks & watch-outs
- Climate carrying-cost: major flood risk — expect insurance premiums to compound above CPI over the hold.
Questions for the listing agent
- What do current leases actually rent for vs. the listed asking? Can we see a recent rent roll and the last 12 months of T-12 income?
- Is there a deadline driving the sale (1031 exchange, divorce, estate, relocation)? That informs how much negotiation room exists.
- Schools are D-rated, which usually means shorter tenancies and higher turnover. Who's the typical renter profile here, and what's been the actual vacancy rate?
- The area grade is low — what's the realistic commute time and amenity access for the typical tenant pool here? Any planned neighborhood developments (good or bad) we should know about?
- What's the average days-on-market for RENTAL listings here right now (not sales)? A rising rental-DOM trend means longer vacancies and softer asking-rent achievability than the comps imply.
- What's the recent tenant-quality profile in this submarket — average credit score on applications, eviction rate, late-payment / NSF rate, and stable-employment percentage? A property-management company in the area should have these aggregated.
- How much new for-sale + rental construction is in the pipeline within 1–3 miles? Heavy new supply typically softens prices + rents 12–24 months out; constrained supply supports both.
Investment metrics
- 1% rule
- 0.31% ✗
- Cap rate
- 0.11%
- Cash-on-cash
- -22.08%
- DSCR
- 0.02
- GRM
- 27.1
CMA / ARV
- ARV (on-the-fly)
- $631,228
- Comps found
- 1
Show comp detail 1 sale within ~0.75 mi
| Address | Dist | Beds/Ba | Sqft | Sold | Price | $/sf | Match |
|---|---|---|---|---|---|---|---|
| 916 Zena Rd | 0.44mi | 3/3.0 (+1) | 3,060 (-4%) | 8mo | $609,825 | $199 | 59 |
Match score weights: distance 35% · size 25% · config 20% · recency 20%. Top-matched comps best support the ARV.
Projected returns pro-forma
-3.0% appreciation · 3.0% rent growth · sell at horizon
- IRR
- -63.5%
- Equity multiple
- -0.75×
- Total profit
- $-587,740
- Equity at exit
- $178,924
- IRR
- —
- Equity multiple
- -2.03×
- Total profit
- $-1,016,688
- Equity at exit
- $103,754
Cash invested: $336,000 (down + closing). Projections, not guarantees.
Landlord ↔ Tenant lean methodology
- Overall (STATE)
- 15 Strongly Tenant-Friendly
- State New York
- 15 Strongly Tenant-Friendly · D+10
- County
- — inherits STATE
- City
- — inherits STATE
ZIP-level market 12498
- Home prices YoY
- -21.8%
- Active inventory
- 71
- Price-to-rent
- 27.1×
Monthly cashflow live
- Estimated rent
- $3,688 medium interval (Pro) →
- Mortgage (P&I)
- −$6,293
- Tax from tax record
- −$2,304 /mo · $27,654/yr
- Insurance
- −$500
- HOA
- −$0
- Vacancy / Maint / Mgmt
- −$775
- Net cashflow
- $-6,184
Break-even live
Sensitivity live
| Price | -10% $-5,504 | -5% $-5,844 | +0% $-6,184 | +5% $-6,523 | +10% $-6,863 |
|---|---|---|---|---|---|
| Rent | -10% $-6,475 | -5% $-6,329 | +0% $-6,184 | +5% $-6,038 | +10% $-5,892 |
| Rate | -1.0pp $-5,579 | -0.5pp $-5,878 | base $-6,184 | +0.5pp $-6,495 | +1.0pp $-6,811 |
UW: 25.0% down · 7.5% · 30yr · 1.5% tax · 5.0% vac · 8.0% maint · 8.0% mgmt
Financing live
Cash to close
- Down payment
- $300,000
- Closing costs
- $36,000
- Reserves months
- —
- Total cash needed
- —
Loan-product check · same deal, 3 products live
Conventional
25% down · 7.5% · 30yr
- Down + closing
- —
- Monthly P&I
- —
- Monthly cashflow
- —
- DSCR
- —
- Eligible?
- —
Personal DTI + credit; lowest rate.
DSCR
20% down · 8.5% · 30yr
- Down + closing
- —
- Monthly P&I
- —
- Monthly cashflow
- —
- DSCR
- —
- Eligible?
- —
No personal income docs; deal must DSCR.
Hard money
10% down · 12.0% · 12mo
- Down + closing
- —
- Monthly P&I
- —
- Monthly cashflow
- —
- DSCR
- —
- Eligible?
- —
Short-term bridge; refi at stabilization.
Listing history 11 events
-
2026-06-19days on market $1,200,000 Active 15 DOM
-
2026-06-18days on market $1,200,000 Active 14 DOM
-
2026-06-17days on market $1,200,000 Active 13 DOM
-
2026-06-16days on market $1,200,000 Active 12 DOM
-
2026-06-15days on market $1,200,000 Active 11 DOM
-
2026-06-14days on market $1,200,000 Active 9 DOM
-
2026-06-12days on market $1,200,000 Active 8 DOM
-
2026-06-09days on market $1,200,000 Active 5 DOM
-
2026-06-08days on market $1,200,000 Active 4 DOM
-
2026-06-07remarks 693-char remark
-
2026-06-07$1,200,000 Active 3 DOM
ⓘ Source: listings_history table (triggers on properties + properties_extension) + one-shot
backfill from property_details.listing_events for pre-trigger history.
Tax reassessment forecast NY · Partial reset (capped growth)
- Current annual tax
- $27,654 · $2,304/mo
- Projected year-2 tax
- $27,654 · $2,304/mo
- Expected delta
- $0/yr ($0/mo · 0.0%)
ⓘ Screening estimate from a state-policy table — verify with the county assessor before closing.
Climate risk First Street
- Flood 6/10 Major FEMA zone X (shaded) · 71% chance over 30 yrs
- Wildfire 3/10 Moderate
- Heat 3/10 Moderate 7 d/yr ≥97°F today · 15 d/yr by 30 yrs out
- Wind 3/10 Moderate 7% chance of damaging wind over 30 yrs
- Air quality 2/10 Low 0 unhealthy d/yr today · 1 by 30 yrs out
Nearby sold comps map
Loading sold comps map…
Walkable amenities ~0.75 mi
Loading nearby amenities…
Taxation est. · year 1
- Rental income
- $44,260
- − Mortgage interest
- −$67,219
- − Property taxes
- −$27,654
- − Insurance
- −$6,000
- − Repairs & maintenance
- −$3,541
- − Management
- −$3,541
- − Depreciation
- −$34,909
- Taxable loss
- −$98,603
- Est. tax savings @ 24.0%
- +$23,665
- After-tax cash flow
- $-50,539/yr
For passive investors: Depreciation is non-cash, so a rental often shows a tax loss while cash-flowing — sheltering income. Rental losses are passive: they offset passive income freely, and up to $25,000/yr can offset ordinary (W-2) income if you actively participate and your MAGI is under $100k (phasing out to $0 by $150k); unused losses carry forward. On sale, claimed depreciation is recaptured at up to 25%, and gains may owe capital-gains tax (a 1031 exchange can defer both). Figures are a year-1 estimate at your 24.0% rate — not tax advice; consult a CPA.
Schools (NCES district)
- District
- Kingston City School District
- NCES district ID
- 3616290
- Math proficiency
- 44% ▲ 1.00%
- Reading proficiency
- 59% ▲ 20.00%
- Median HH income
- $52,586
- Composite
- 44.22/100
- National rank
- #2849
- State rank
- #355 of 590 in NY
Livability — Zena
- Score
- 60/100
- State rank
- #966
- US rank
- #18918
Category grades
Schools grade is shown separately in the Schools card above.
Census & demographics
- Census place
- Zena, NY
- Population (ZIP)
- 4,530
Population outlook (Ulster County) Hauer SSP2
- Today (2025)
- 175,887 people
- By 2030
- 171,876 · -2.3%
- By 2040
- 161,771 · -8.0%
- By 2050
- 151,470 · -13.9%
- By 2075
- 133,023 · -24.4%
- By 2100
- 113,504 · -35.5%
Race, ethnicity, and origin ACS 2023
- Neighborhood character
- Predominantly White (84%)
- Race & ethnicity
- White 84% Hispanic / Latino 6% Two or more races 5% Asian 3% Black 2%
- Hispanic origin (detail)
- Common ancestry
- Scotch-Irish 8% Italian 7% Romanian 5%
- Foreign-born
- 12% · Canada, China, Jamaica
- Languages at home
- 90% English-only · Spanish 3% French/Haitian/Cajun 2% German/W. Germanic 1%
Political lean MEDSL · Ulster
- 2024 margin
- D (+18.7) · D 59.3% · R 40.7%
- 2008→2024 swing
- -4.9pp toward R · 2008: 23.6pp · 2024: 18.7pp
- All cycles
- 2024: D+18.7 2020: D+20.9 2016: D+9.1 2012: D+21.9 2008: D+23.6
Not yet ingested
- Civics
- —
Market trends
- HPI YoY
- ▼ -96.28%
- Current HPI
- 344.8651
- Rent YoY
- —
- Metro
- —
- State GDP YoY
- ▲ 2.60%
- F500 in state
- 92
Industry mix (Fortune 500 HQ in NY)
| Industry | F500 HQs | Revenue |
|---|---|---|
| Financial Services | 10 | $950B |
|
||
| Consumer Goods | 9 | $162B |
|
||
| Insurance | 4 | $225B |
|
||
| Telecommunications | 2 | $144B |
|
||
| Pharmaceuticals | 2 | $112B |
|
||
| Media / Entertainment | 2 | $69B |
|
||
Price history
+6300.0% since first listed10 events — show timeline
- 2026-06-04 Listed $1,200,000 OneKey® MLS as Distributed by MLS Grid
- 2026-06-04 Listed $1,200,000 HVCRMLS
- 2026-06-04 Listed $1,700,000 HVCRMLS
- 2025-09-18 Price Changed $1,300,000 HVCRMLS
- 2025-09-02 Listing Removed — OneKey® MLS as Distributed by MLS Grid
- 2025-06-18 Price Changed $1,395,000 HVCRMLS
- 2025-06-18 Price Changed $1,395,000 OneKey® MLS as Distributed by MLS Grid
- 2025-05-05 Listed $1,495,000 HVCRMLS
- 2025-05-05 Listed $1,495,000 OneKey® MLS as Distributed by MLS Grid
- 1983-12-15 Sold (Public Records) $18,750 Public Records
Property tax history
+26.1%/yrLatest (2025): $27,654 · -9.0% YoY. Source: county tax records.
Cash-flow waterfall
monthlySold comps — $/sqft
last 12 mo · ≤1 miLoading sold comps…