 🏗️ New Construction
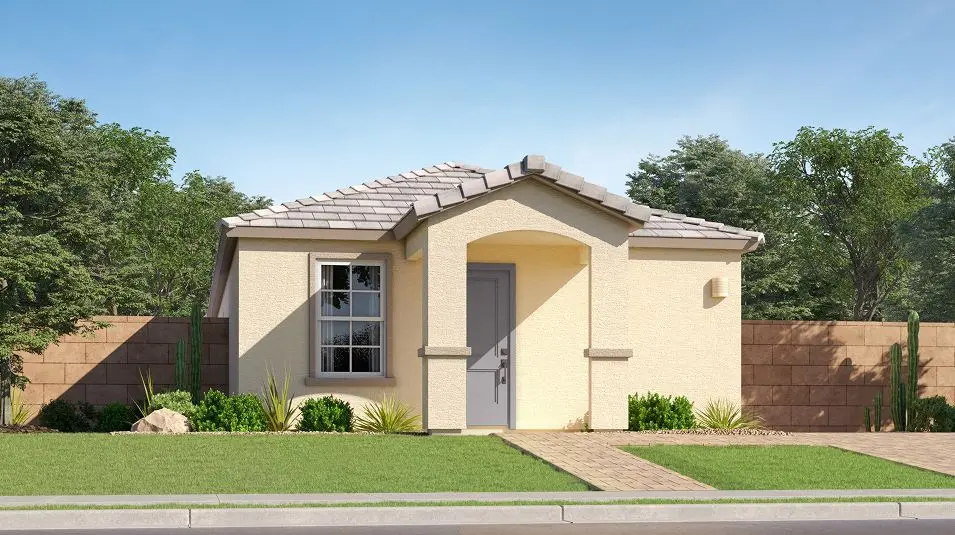
Wish Plan 2253 Plan · Maricopa, AZ
Flood risk No data
- FEMA flood zone
- —
- Chance of flooding over 30 yrs
- —
- Est. flood insurance / yr
- —
Fire risk No data
- Est. fire insurance / yr
- —
Heat risk No data
- Hot days now (above threshold)
- —
- Hot days in 30 yrs
- —
Wind risk No data
- Chance of severe wind over 30 yrs
- —
Air-quality risk No data
- Unhealthy air days now
- —
- Unhealthy air days in 30 yrs
- —
Risk factors via First Street. Map © Google.
Why this score? — see what drove the F grade
The composite is a weighted blend of 9 inputs, each scored 0–100. Each bar is that input's sub-score; the figure is the points it added to the 100-point composite (weight × sub-score).
- ARV discount +7.5/15.0
- Cash flow +5.5/30.0
- Appreciation +4.6/10.0
- Livability +3.6/5.0
- Rent growth +2.9/5.0
- Condition / age +2.5/5.0
- Schools +2.3/10.0
- 1% rule +1.0/10.0
- DSCR +0.0/10.0
$258,040
🖨 Deal sheet (PDF) 📄 Offer letter ✓ Due diligence
Listing remarks MLS
This new single-story home offers ample space to live and grow. Two bedrooms and a luxurious owner's suite are tucked away at the back of the home. The kitchen, living and dining areas share an inviting open-concept layout with convenient access to a covered porch for outdoor entertainment and leisure.
Key facts
- Covered porch
- Single story home
- Open concept layout
Tags
Neighborhood map
What this means for you Summary
Snapshot
- This is a 3-bed/2.0-bath single-family listed at $258k.
Deal economics
- At list price, monthly cash flow is $-683 ($-8k/yr) — negative.
- To cash-flow at today's rent, offer at most $221k (14.5% below list).
- To meet the 1% rule (rent ≥ 1% of price), the offer needs to be $193k (25.2% below list).
- Recommended offer: $193k (25.2% below list) — sets the bar for 1% rule.
Location & tenants
- Location reads 72/100 on livability (#28 in AZ) — a middle-class / working-renter tenant base. Strengths: housing A+, employment A-, crime B+; Watch: amenities F, commute F, health & safety F.
- Maricopa Unified School District (4441) (town): math 20% / reading 29% proficiency, ranked #128 of 249 in AZ (top 51%) — low school quality limits family demand, transient renter base, plan for 1-2y turnover.
- Zoned schools: Santa Cruz Elementary School (math 27% / reading 34%, grade F, #536 of 1,109 statewide, top 49%, 764 students, 59% FRL); Desert Wind Middle School (math 14% / reading 26%, grade F, #127 of 218 statewide, top 60%, 817 students, 52% FRL).
- Market conditions: Rents rising (+1.8%/yr); 862 active listings in the ZIP; 13 comparable units currently listed for rent nearby; rentals leasing fast (median 3d on market — plan ~1-2 weeks tenant-placement turnaround); solid renter incomes; 9,504 units permitted in Pinal County in 2024 (776 in 5+ unit buildings).
Forward outlook
- Local home prices are declining (-0.9%/yr); year-one equity from $2k of loan paydown is wiped out by about $3k of value loss. Plan a longer hold.
Negotiation context
- It's been on market 327 days — a 12% lower offer ($227k) is reasonable based on typical stale-listing flexibility.
Questions for the listing agent
- What do current leases actually rent for vs. the listed asking? Can we see a recent rent roll and the last 12 months of T-12 income?
- It's been on market 327 days. Have you received any prior offers? Is the seller open to a 25% concession, seller financing, or rate buy-down credit?
- Why hasn't it sold? Are there any deal-killer items the seller is aware of (foundation, flood, title, zoning, code violations)?
- Is there a deadline driving the sale (1031 exchange, divorce, estate, relocation)? That informs how much negotiation room exists.
- Schools are B-rated — typically a magnet for longer-tenancy family renters. What's the average tenant stay here, and is there a school-zone premium baked into asking?
- The area grade is low — what's the realistic commute time and amenity access for the typical tenant pool here? Any planned neighborhood developments (good or bad) we should know about?
- What's the average days-on-market for RENTAL listings here right now (not sales)? A rising rental-DOM trend means longer vacancies and softer asking-rent achievability than the comps imply.
- What's the recent tenant-quality profile in this submarket — average credit score on applications, eviction rate, late-payment / NSF rate, and stable-employment percentage? A property-management company in the area should have these aggregated.
- How much new for-sale + rental construction is in the pipeline within 1–3 miles? Heavy new supply typically softens prices + rents 12–24 months out; constrained supply supports both.
Investment metrics
- 1% rule
- 0.60% ✗
- Cap rate
- 3.73%
- Cash-on-cash
- -9.17%
- DSCR
- 0.59
- GRM
- 13.8
CMA / ARV
- ARV (median comp)
- $319,388
- List price
- $258,040
- Delta
- -19.21%
- Verdict
- UNDERPRICED
- Comps
- 20 within 1.0 mi
Show comp detail 12 sales within ~0.75 mi
| Address | Dist | Beds/Ba | Sqft | Sold | Price | $/sf | Match |
|---|---|---|---|---|---|---|---|
| 36075 W Charity Pl | 0.17mi | 3/2.0 | 1,109 (+3%) | 0mo | $259,740 | $234 | 87 |
| 36056 W Charity Pl | 0.19mi | 3/2.0 | 1,109 (+3%) | 1mo | $245,000 | $221 | 86 |
| 36065 W Charity Pl | 0.18mi | 3/2.0 | 1,109 (+3%) | 2mo | $240,000 | $216 | 85 |
| 36107 W Maddaloni Ave | 0.00mi | 3/2.0 | 1,210 (+12%) | 1mo | $260,000 | $215 | 79 |
| 36225 W Mediterranean Way | 0.10mi | 3/2.0 | 1,177 (+9%) | 2mo | $285,190 | $242 | 78 |
| 17500 N Toledo Ave | 0.23mi | 3/2.0 | 1,177 (+9%) | 2mo | $286,000 | $243 | 73 |
| 17653 N Del Mar Ave | 0.24mi | 3/2.0 | 1,177 (+9%) | 1mo | $277,540 | $236 | 73 |
| 17428 N Del Mar Ave | 0.09mi | 2/2.0 (-1) | 969 (-10%) | 1mo | $259,990 | $268 | 73 |
| 36205 W Mediterranean Way | 0.11mi | 2/2.0 (-1) | 969 (-10%) | 1mo | $274,690 | $283 | 72 |
| 36066 W Charity Pl | 0.18mi | 3/2.0 | 1,210 (+12%) | 1mo | $266,390 | $220 | 70 |
| 36023 W Maddaloni Ave | 0.20mi | 3/2.0 | 1,210 (+12%) | 1mo | $259,740 | $215 | 69 |
| 36795 W Mondragone Ln | 0.30mi | 3/2.0 | 1,192 (+11%) | 1mo | $258,000 | $216 | 68 |
Match score weights: distance 35% · size 25% · config 20% · recency 20%. Top-matched comps best support the ARV.
Projected returns pro-forma
-0.89% appreciation · 1.78% rent growth · sell at horizon
- IRR
- -18.0%
- Equity multiple
- 0.24×
- Total profit
- $-68,256
- Equity at exit
- $78,822
- IRR
- -12.4%
- Equity multiple
- -0.08×
- Total profit
- $-97,025
- Equity at exit
- $84,247
Cash invested: $89,429 (down + closing). Projections, not guarantees.
Landlord ↔ Tenant lean methodology
- Overall (STATE)
- 87 Strongly Landlord-Friendly
- State Arizona
- 87 Strongly Landlord-Friendly · R+3
- County
- — inherits STATE
- City
- — inherits STATE
ZIP-level market 85138
- Home prices YoY
- -0.3%
- Rents YoY
- 1.8%
- Active inventory
- 862
- Price-to-rent
- 11.1×
Monthly cashflow live
- Estimated rent
- $1,929 high interval (Pro) →
- Mortgage (P&I)
- −$1,675
- Tax est. 1.5%
- −$399 /mo · $4,791/yr
- Insurance
- −$133
- HOA
- −$0
- Vacancy / Maint / Mgmt
- −$405
- Net cashflow
- $-683
Break-even live
Sensitivity live
| Price | -10% $-463 | -5% $-573 | +0% $-683 | +5% $-794 | +10% $-904 |
|---|---|---|---|---|---|
| Rent | -10% $-836 | -5% $-759 | +0% $-683 | +5% $-607 | +10% $-531 |
| Rate | -1.0pp $-522 | -0.5pp $-602 | base $-683 | +0.5pp $-766 | +1.0pp $-850 |
UW: 25.0% down · 7.5% · 30yr · 1.5% tax · 5.0% vac · 8.0% maint · 8.0% mgmt
Financing live
Cash to close
- Down payment
- $79,847
- Closing costs
- $9,582
- Reserves months
- —
- Total cash needed
- —
Loan-product check · same deal, 3 products live
Conventional
25% down · 7.5% · 30yr
- Down + closing
- —
- Monthly P&I
- —
- Monthly cashflow
- —
- DSCR
- —
- Eligible?
- —
Personal DTI + credit; lowest rate.
DSCR
20% down · 8.5% · 30yr
- Down + closing
- —
- Monthly P&I
- —
- Monthly cashflow
- —
- DSCR
- —
- Eligible?
- —
No personal income docs; deal must DSCR.
Hard money
10% down · 12.0% · 12mo
- Down + closing
- —
- Monthly P&I
- —
- Monthly cashflow
- —
- DSCR
- —
- Eligible?
- —
Short-term bridge; refi at stabilization.
Rent comps 13 comps
| Address | Beds | Baths | Sqft | Rent | $/sqft | DOM | Units | Dist |
|---|---|---|---|---|---|---|---|---|
| 36355 W Mediterranean Way Maricopa, AZ | 3.0 | 2.0 | 1411 | $2,050 | $1.45 | 0d | 1 | 0.04mi |
| 36355 W Mediterranean Way Maricopa, AZ | 3.0 | 2.0 | 1411 | $2,050 | $1.45 | 3d | 1 | 0.04mi |
| 17589 N Del Mar Ave Maricopa, AZ | 3.0 | 2.0 | 1177 | $1,895 | $1.61 | 46d | 1 | 0.19mi |
| 36605 W Mondragone Ln Maricopa, AZ | 3.0 | 2.0 | 1170 | $1,595 | $1.36 | 12d | 1 | 0.19mi |
| 36837 W Mediterranean Way Maricopa, AZ | 3.0 | 2.0 | 1278 | $1,595 | $1.25 | 0d | 1 | 0.32mi |
| 36837 W Mediterranean Way Maricopa, AZ | 3.0 | 2.0 | 1278 | $1,695 | $1.33 | 45d | 1 | 0.32mi |
| 37078 W Mondragone Ln Maricopa, AZ | 3.0 | 2.0 | 1409 | $1,600 | $1.14 | 0d | 1 | 0.48mi |
| 37128 W Mondragone Ln Maricopa, AZ | 3.0 | 2.0 | 1409 | $1,450 | $1.03 | 45d | 1 | 0.51mi |
| 35480 W San Capistrano Ave Maricopa, AZ | 3.0 | 2.0 | 1402 | $1,685 | $1.20 | 0d | 1 | 0.87mi |
| 35448 W Santa Barbara Ave Maricopa, AZ | 3.0 | 2.0 | 1327 | $1,600 | $1.21 | 13d | 1 | 0.97mi |
| 19270 N Costa Verdez Ave Maricopa, AZ | 3.0 | 2.0 | 1220 | $1,610 | $1.32 | 45d | 1 | 1.22mi |
| 19270 N Costa Verdez Ave Maricopa, AZ | 3.0 | 2.0 | 1220 | $1,645 | $1.35 | 0d | 1 | 1.22mi |
| 36635 W Honeycutt Rd Maricopa, AZ | 1.0–3.0 | 1.0–2.0 | 972 | $2,259 | $2.32 | 0d | 83 | 1.36mi |
Listing history 20 events
-
2026-06-21days on market $258,040 Active 327 DOM
-
2026-06-18days on market $258,040 Active 324 DOM
-
2026-06-17pricedays on market $258,040 Active 323 DOM
-
2026-06-16days on market $257,040 Active 322 DOM
-
2026-06-15days on market $257,040 Active 321 DOM
-
2026-06-13days on market $257,040 Active 319 DOM
-
2026-06-13days on market $257,040 Active 318 DOM
-
2026-06-09days on market $257,040 Active 315 DOM
-
2026-06-08days on market $257,040 Active 314 DOM
-
2026-06-07days on market $257,040 Active 313 DOM
-
2026-06-04days on market $257,040 Active 310 DOM
-
2026-06-03days on market $257,040 Active 309 DOM
-
2026-06-02pricedays on market $257,040 Active 308 DOM
-
2026-06-01days on market $255,040 Active 307 DOM
-
2026-05-31days on market $255,040 Active 306 DOM
-
2026-05-04price $254,040 303-char remark
Show marketing remark (303 chars)
This new single-story home offers ample space to live and grow. Two bedrooms and a luxurious owner's suite are tucked away at the back of the home. The kitchen, living and dining areas share an inviting open-concept layout with convenient access to a covered porch for outdoor entertainment and leisure.
-
2026-03-17price $253,040 303-char remark
Show marketing remark (303 chars)
This new single-story home offers ample space to live and grow. Two bedrooms and a luxurious owner's suite are tucked away at the back of the home. The kitchen, living and dining areas share an inviting open-concept layout with convenient access to a covered porch for outdoor entertainment and leisure.
-
2026-01-13price $252,790 303-char remark
Show marketing remark (303 chars)
This new single-story home offers ample space to live and grow. Two bedrooms and a luxurious owner's suite are tucked away at the back of the home. The kitchen, living and dining areas share an inviting open-concept layout with convenient access to a covered porch for outdoor entertainment and leisure.
-
2025-11-11price $252,290 303-char remark
Show marketing remark (303 chars)
This new single-story home offers ample space to live and grow. Two bedrooms and a luxurious owner's suite are tucked away at the back of the home. The kitchen, living and dining areas share an inviting open-concept layout with convenient access to a covered porch for outdoor entertainment and leisure.
-
2025-07-29$251,990 Active 303-char remark
Show marketing remark (303 chars)
This new single-story home offers ample space to live and grow. Two bedrooms and a luxurious owner's suite are tucked away at the back of the home. The kitchen, living and dining areas share an inviting open-concept layout with convenient access to a covered porch for outdoor entertainment and leisure.
ⓘ Source: listings_history table (triggers on properties + properties_extension) + one-shot
backfill from property_details.listing_events for pre-trigger history.
Nearby sold comps map
Loading sold comps map…
Walkable amenities ~0.75 mi
Loading nearby amenities…
Taxation est. · year 1
- Rental income
- $23,148
- − Mortgage interest
- −$17,891
- − Property taxes
- −$4,791
- − Insurance
- −$1,597
- − Repairs & maintenance
- −$1,852
- − Management
- −$1,852
- − Depreciation
- −$9,291
- Taxable loss
- −$14,125
- Est. tax savings @ 24.0%
- +$3,390
- After-tax cash flow
- $-4,809/yr
For passive investors: Depreciation is non-cash, so a rental often shows a tax loss while cash-flowing — sheltering income. Rental losses are passive: they offset passive income freely, and up to $25,000/yr can offset ordinary (W-2) income if you actively participate and your MAGI is under $100k (phasing out to $0 by $150k); unused losses carry forward. On sale, claimed depreciation is recaptured at up to 25%, and gains may owe capital-gains tax (a 1031 exchange can defer both). Figures are a year-1 estimate at your 24.0% rate — not tax advice; consult a CPA.
Schools (NCES district)
- District
- Maricopa Unified School District (4441)
- NCES district ID
- 0404720
- Math proficiency
- 20% ▼ -18.00%
- Reading proficiency
- 29% ▼ -9.00%
- Median HH income
- $63,725
- Composite
- 22.92/100
- National rank
- #7993
- State rank
- #128 of 249 in AZ
Livability — Maricopa
- Score
- 72/100
- State rank
- #28
- US rank
- #5943
Category grades
Schools grade is shown separately in the Schools card above.
Census & demographics
- Census place
- Maricopa, AZ
- County
- Pinal County · 399,947 people
- City population
- 76,044
- Metro
- Phoenix-Mesa-Chandler, AZ
- Population (ZIP)
- 55,260
- Household income
- $95,867
- Rent vs Own
- Severe rent burden
- 432.0
Population outlook (Pinal County) Hauer SSP2
- Today (2025)
- 437,574 people
- By 2030
- 446,903 · +2.1%
- By 2040
- 452,589 · +3.4%
- By 2050
- 444,126 · +1.5%
- By 2075
- 430,300 · -1.7%
- By 2100
- 393,536 · -10.1%
Race, ethnicity, and origin ACS 2023
- Neighborhood character
- Diverse neighborhood (Simpson 0.69)
- Race & ethnicity
- White 45% Hispanic / Latino 30% Two or more races 17% Black 13% Native American 3% Asian 3% Pacific Islander 1%
- Hispanic origin (detail)
- Mexican 26% Puerto Rican 1%
- Common ancestry
- Lithuanian 2% Romanian 2% Italian 2%
- Foreign-born
- 10% · Canada
- Languages at home
- 79% English-only · Spanish 16% Other Asian/Pacific 1% Other Indo-European 1%
Political lean MEDSL · Pinal
- 2024 margin
- Strong R (+22.1) · D 38.5% · R 60.6%
- 2008→2024 swing
- -7.6pp toward R · 2008: -14.5pp · 2024: -22.1pp
- All cycles
- 2024: R+22.1 2020: R+17.3 2016: R+19.3 2012: R+17.1 2008: R+14.5
Not yet ingested
- Civics
- —
Market trends
- HPI YoY
- ▼ -0.89%
- Current HPI
- 258.1461
- Rent YoY
- ▲ 1.78%
- Metro
- Phoenix-Mesa-Chandler, AZ
- State GDP YoY
- ▲ 4.54%
- F500 in state
- 20
Industry mix (Fortune 500 HQ in AZ)
| Industry | F500 HQs | Revenue |
|---|---|---|
| Technology | 2 | $13B |
|
||
| Mining / Metals | 1 | $23B |
|
||
| Environmental Services | 1 | $16B |
|
||
| Metals / Steel | 1 | $14B |
|
||
| Technology Distribution | 1 | $9B |
|
||
| Homebuilding | 1 | $8B |
|
||
Price history
+0.8% since first listed5 events — show timeline
- 2026-05-04 Price Changed $254,040 Zillow
- 2026-03-17 Price Changed $253,040 Zillow
- 2026-01-13 Price Changed $252,790 Zillow
- 2025-11-11 Price Changed $252,290 Zillow
- 2025-07-29 Listed $251,990 Zillow
Cash-flow waterfall
monthlySold comps — $/sqft
last 12 mo · ≤1 miLoading sold comps…