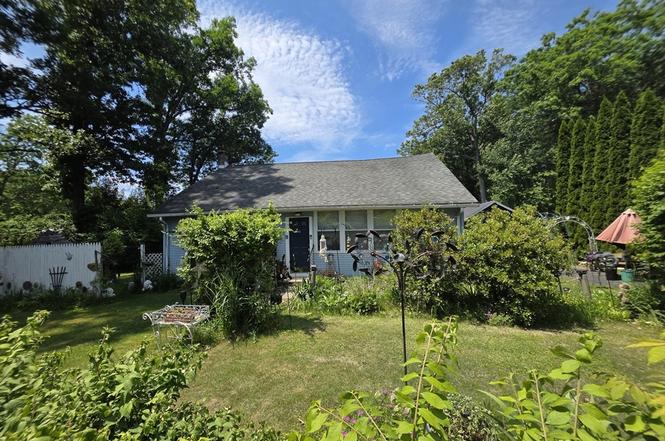
55 French Dr · Palmer Town, MA
Flood risk 1/10 · Minimal
- FEMA flood zone
- X (unshaded)
- Chance of flooding over 30 yrs
- 0.0%
- Est. flood insurance / yr
- $507 – $1,088
Fire risk 1/10 · Minimal
- Est. fire insurance / yr
- $915 – $1,699
Heat risk 3/10 · Minor
- Hot days now (above 95°F)
- 7 days/yr
- Hot days in 30 yrs
- 16 days/yr
Wind risk 6/10 · Moderate
- Chance of severe wind over 30 yrs
- 27.0%
Air-quality risk 3/10 · Minor
- Unhealthy air days now
- 2 days/yr
- Unhealthy air days in 30 yrs
- 4 days/yr
Risk factors via First Street. Map © Google.
Why this score? — see what drove the C- grade
The composite is a weighted blend of 9 inputs, each scored 0–100. Each bar is that input's sub-score; the figure is the points it added to the 100-point composite (weight × sub-score).
- Cash flow +16.2/30.0
- ARV discount +15.0/15.0
- DSCR +5.0/10.0
- 1% rule +4.2/10.0
- Livability +3.2/5.0
- Schools +2.6/10.0
- Rent growth +2.5/5.0
- Condition / age +2.5/5.0
- Appreciation +0.0/10.0
$225,000
🖨 Deal sheet (PDF) 📄 Offer letter ✓ Due diligence
Listing remarks
CASH ONLY. Opportunity awaits! This 3-bedroom, 1-bath home offers tremendous potential for investors, flippers, or buyers looking to build equity. Set on a beautiful level lot filled with mature fruit trees, flowering plants, and plenty of outdoor space to enjoy, the property also includes deeded access to Lake Thompson. Join the association to take advantage of the beach, boating opportunities, and all the benefits of lake living. Inside, the spacious living room features soaring cathedral ceilings and plenty of room to gather. Three bedrooms offer hardwood flooring, while the kitchen includes a dining area, pantry space, and convenient first-floor laundry. Two storage sheds provide ample
Key facts
- Hardwood flooring
- Mature fruit trees
- Level lot
Tags
Property features AI
Finance
- Other: Property sits on approximately 0.26 acres; Lot is cleared and level; Beach ownership/association nearby (1/10 to 3/10 to beach); Public road frontage
- HOA & community: Not a senior community; Public school in the area
Exterior
- Parking: Off-street paved tandem parking for 3 cars; Three total parking spaces
- Utilities: Public sewer; Private water source; Electric service with circuit breakers; Utilities include provision for electric range
- Home design: Single-family residence; Blue exterior color
- Construction: Block foundation
- Exterior features: Fenced, enclosed yard; Fenced yard (additional listing mention)
Interior
- Kitchen: Range; Refrigerator; Exterior access from the kitchen; Dryer hookup (electric) and washer hookup in kitchen area
- Bedrooms: Primary bedroom on the first floor with closet and hardwood flooring; Second bedroom on the first floor with closet and hardwood flooring; Third bedroom on the first floor with hardwood flooring
- Flooring: Hardwood floors; Plywood
- Bathrooms: One full bathroom with tub and shower (first floor)
- Heating & cooling: Forced air heating (oil); Window air conditioning unit(s); Circuit breaker electric
- Interior features: Cathedral ceilings in the living room; Ceiling fan(s); Five total rooms
- Laundry & utility: Washer hookup; Electric dryer hookup on the first floor; Partial unfinished basement (dirt floor, concrete, unfinished)
Neighborhood map
What this means for you Summary
Snapshot
- This is a 3-bed/1.0-bath single-family listed at $225k.
Deal economics
- At list price, monthly cash flow is $121 ($1k/yr) — positive.
- The deal already cash-flows at list — no discount required.
- To meet the 1% rule (rent ≥ 1% of price), the offer needs to be $208k (7.6% below list).
- Recommended offer: $208k (7.6% below list) — sets the bar for 1% rule.
- Cap rate 6.9% vs local median 3.6% in Palmer Town — top-decile yield for the area; either an underpriced asset or a hidden risk that comps aren't pricing in. Stress-test before assuming the spread holds.
Location & tenants
- Location reads 64/100 on livability (#194 in MA) — a middle-class / working-renter tenant base. Strengths: housing A+, health & safety A+; Watch: amenities F, commute F.
- Palmer (suburban): math 23% / reading 35% proficiency, ranked #256 of 302 in MA (top 85%) — low school quality limits family demand, transient renter base, plan for 1-2y turnover.
- Zoned schools: Old Mill Pond (math 23% / reading 34%, grade F, #688 of 938 statewide, top 73%, 599 students, 0% FRL); Palmer High (math 25% / reading 38%, grade F, #265 of 343 statewide, top 77%, 535 students, 0% FRL) — zoned schools average 0% FRL vs 40% district-wide (40 pts lower); this property's tenant base skews higher-income than the district average.
- Market conditions: 26 active listings in the ZIP; 1 comparable units currently listed for rent nearby; solid renter incomes; 453 units permitted in Hampden County in 2024 (116 in 5+ unit buildings).
- This rent runs 31% of the median local income ($80k/yr) — at the standard rent-burdened threshold; future hikes will face affordability resistance.
Forward outlook
- Local home prices are declining (-3.0%/yr); year-one equity from $2k of loan paydown is wiped out by about $7k of value loss. Plan a longer hold.
- Hampden County population projected at +5% by 2050 — modest demand growth; plan on rents tracking national, not racing it.
Negotiation context
- Only 11 days on market — expect competitive offers; lowballing is unlikely to land.
- Current owner paid $85k; list at $225k implies a 165% gain — meaningful room to come down on a strong offer.
Risks & watch-outs
- Watch-outs: built in 1936 — expect roof / HVAC / electrical / plumbing capex.
- Climate carrying-cost: major wind risk, 27% chance of damaging wind over 30y — expect insurance premiums to compound above CPI over the hold.
Questions for the listing agent
- Built in 1936 — when were the roof, HVAC, electrical panel, plumbing, and water heater last replaced?
- Is there a deadline driving the sale (1031 exchange, divorce, estate, relocation)? That informs how much negotiation room exists.
- Schools are D-rated, which usually means shorter tenancies and higher turnover. Who's the typical renter profile here, and what's been the actual vacancy rate?
- What's the average days-on-market for RENTAL listings here right now (not sales)? A rising rental-DOM trend means longer vacancies and softer asking-rent achievability than the comps imply.
- What's the recent tenant-quality profile in this submarket — average credit score on applications, eviction rate, late-payment / NSF rate, and stable-employment percentage? A property-management company in the area should have these aggregated.
- How much new for-sale + rental construction is in the pipeline within 1–3 miles? Heavy new supply typically softens prices + rents 12–24 months out; constrained supply supports both.
Investment metrics
- 1% rule
- 0.92% ✗
- Cap rate
- 6.94%
- Cash-on-cash
- 2.30%
- DSCR
- 1.10
- GRM
- 9.0
CMA / ARV
- ARV (on-the-fly)
- $378,560
- Comps found
- 3
Show comp detail 3 sales within ~0.75 mi
| Address | Dist | Beds/Ba | Sqft | Sold | Price | $/sf | Match |
|---|---|---|---|---|---|---|---|
| 47 Flynt | 0.50mi | 3/1.0 | 1,238 (+10%) | 10mo | $375,000 | $303 | 51 |
| 8 Christine St | 0.41mi | 3/1.0 | 972 (-13%) | 14mo | $340,000 | $350 | 48 |
| 2 Carter St | 0.50mi | 2/1.0 (-1) | 960 (-14%) | 4mo | $324,250 | $338 | 45 |
Match score weights: distance 35% · size 25% · config 20% · recency 20%. Top-matched comps best support the ARV.
Projected returns pro-forma
-3.0% appreciation · 3.0% rent growth · sell at horizon
- IRR
- -12.7%
- Equity multiple
- 0.54×
- Total profit
- $-28,769
- Equity at exit
- $33,548
- IRR
- -3.6%
- Equity multiple
- 0.76×
- Total profit
- $-15,118
- Equity at exit
- $19,454
Cash invested: $63,000 (down + closing). Projections, not guarantees.
Landlord ↔ Tenant lean methodology
- Overall (STATE)
- 20 Strongly Tenant-Friendly
- State Massachusetts
- 20 Strongly Tenant-Friendly · D+15
- County
- — inherits STATE
- City
- — inherits STATE
ZIP-level market 01069
- Active inventory
- 26
- Price-to-rent
- 9.0×
Monthly cashflow live
- Estimated rent
- $2,078 medium interval (Pro) →
- Mortgage (P&I)
- −$1,180
- Tax from tax record
- −$248 /mo · $2,972/yr
- Insurance
- −$94
- HOA
- −$0
- Vacancy / Maint / Mgmt
- −$436
- Net cashflow
- $121
Break-even live
Sensitivity live
| Price | -10% $248 | -5% $184 | +0% $121 | +5% $57 | +10% $-7 |
|---|---|---|---|---|---|
| Rent | -10% $-44 | -5% $38 | +0% $121 | +5% $203 | +10% $285 |
| Rate | -1.0pp $234 | -0.5pp $178 | base $121 | +0.5pp $62 | +1.0pp $3 |
UW: 25.0% down · 7.5% · 30yr · 1.5% tax · 5.0% vac · 8.0% maint · 8.0% mgmt
Financing live
Cash to close
- Down payment
- $56,250
- Closing costs
- $6,750
- Reserves months
- —
- Total cash needed
- —
Loan-product check · same deal, 3 products live
Conventional
25% down · 7.5% · 30yr
- Down + closing
- —
- Monthly P&I
- —
- Monthly cashflow
- —
- DSCR
- —
- Eligible?
- —
Personal DTI + credit; lowest rate.
DSCR
20% down · 8.5% · 30yr
- Down + closing
- —
- Monthly P&I
- —
- Monthly cashflow
- —
- DSCR
- —
- Eligible?
- —
No personal income docs; deal must DSCR.
Hard money
10% down · 12.0% · 12mo
- Down + closing
- —
- Monthly P&I
- —
- Monthly cashflow
- —
- DSCR
- —
- Eligible?
- —
Short-term bridge; refi at stabilization.
Rent comps 1 comps
| Address | Beds | Baths | Sqft | Rent | $/sqft | DOM | Units | Dist |
|---|---|---|---|---|---|---|---|---|
| 99 Lawrence St Unit 2 Palmer, MA | 2.0 | 1.5 | 1000 | $1,600 | $1.60 | 45d | 1 | 1.37mi |
Listing history 8 events
-
2026-06-21days on market $225,000 Active 11 DOM
-
2026-06-18days on market $225,000 Active 8 DOM
-
2026-06-17days on market $225,000 Active 7 DOM
-
2026-06-16days on market $225,000 Active 6 DOM
-
2026-06-15statusdays on market $225,000 Active 5 DOM
-
2026-06-14days on market $225,000 New 3 DOM
-
2026-06-13remarks 699-char remark
-
2026-06-13$225,000 New 2 DOM
ⓘ Source: listings_history table (triggers on properties + properties_extension) + one-shot
backfill from property_details.listing_events for pre-trigger history.
Tax reassessment forecast MA · Partial reset (capped growth)
- Current annual tax
- $2,972 · $248/mo
- Projected year-2 tax
- $2,972 · $248/mo
- Expected delta
- $0/yr ($0/mo · 0.0%)
ⓘ Screening estimate from a state-policy table — verify with the county assessor before closing.
Climate risk First Street
- Flood 1/10 Low FEMA zone X (unshaded) · 0% chance over 30 yrs
- Wildfire 1/10 Low
- Heat 3/10 Moderate 7 d/yr ≥95°F today · 16 d/yr by 30 yrs out
- Wind 6/10 Major 27% chance of damaging wind over 30 yrs
- Air quality 3/10 Moderate 2 unhealthy d/yr today · 4 by 30 yrs out
Nearby sold comps map
Loading sold comps map…
Walkable amenities ~0.75 mi
Loading nearby amenities…
Taxation est. · year 1
- Rental income
- $24,941
- − Mortgage interest
- −$12,603
- − Property taxes
- −$2,972
- − Insurance
- −$1,125
- − Repairs & maintenance
- −$1,995
- − Management
- −$1,995
- − Depreciation
- −$6,545
- Taxable loss
- −$2,296
- Est. tax savings @ 24.0%
- +$551
- After-tax cash flow
- $1,998/yr
For passive investors: Depreciation is non-cash, so a rental often shows a tax loss while cash-flowing — sheltering income. Rental losses are passive: they offset passive income freely, and up to $25,000/yr can offset ordinary (W-2) income if you actively participate and your MAGI is under $100k (phasing out to $0 by $150k); unused losses carry forward. On sale, claimed depreciation is recaptured at up to 25%, and gains may owe capital-gains tax (a 1031 exchange can defer both). Figures are a year-1 estimate at your 24.0% rate — not tax advice; consult a CPA.
Schools (NCES district)
- District
- Palmer
- NCES district ID
- 2509300
- Math proficiency
- 23% ▼ -7.00%
- Reading proficiency
- 35% ▼ -4.00%
- Median HH income
- $52,654
- Composite
- 25.59/100
- National rank
- #7421
- State rank
- #256 of 302 in MA
Livability — Palmer Town
- Score
- 64/100
- State rank
- #194
- US rank
- #14511
Category grades
Schools grade is shown separately in the Schools card above.
Census & demographics
- Census place
- Palmer Town, MA
- County
- Hampden County · 230,965 people
- City population
- 12,457
- Metro
- Springfield, MA
- Population (ZIP)
- 8,821
- Household income
- $80,190
- Rent vs Own
- Severe rent burden
- 212.0
Population outlook (Hampden County) Hauer SSP2
- Today (2025)
- 485,646 people
- By 2030
- 491,517 · +1.2%
- By 2040
- 500,539 · +3.1%
- By 2050
- 508,827 · +4.8%
- By 2075
- 539,167 · +11.0%
- By 2100
- 545,698 · +12.4%
Race, ethnicity, and origin ACS 2023
- Neighborhood character
- Predominantly White (83%)
- Race & ethnicity
- White 83% Two or more races 10% Hispanic / Latino 5% Black 3%
- Hispanic origin (detail)
- Mexican 4%
- Common ancestry
- Romanian 16% Lithuanian 14% Russian 2%
- Foreign-born
- 2% · Canada
- Languages at home
- 94% English-only · French/Haitian/Cajun 2% Other Indo-European 1% Russian/Polish/Slavic 1%
Political lean MEDSL · Hampden
- 2024 margin
- Lean D (+8.9) · D 53.4% · R 44.5% · Other 2.1%
- 2008→2024 swing
- -16.4pp toward R · 2008: 25.3pp · 2024: 8.9pp
- All cycles
- 2024: D+8.9 2020: D+17.7 2016: D+16.0 2012: D+25.4 2008: D+25.3
Not yet ingested
- Civics
- —
Market trends
- HPI YoY
- ▼ -112.60%
- Current HPI
- 185.7406
- Rent YoY
- —
- Metro
- Springfield, MA
- State GDP YoY
- ▲ 2.28%
- F500 in state
- 38
Industry mix (Fortune 500 HQ in MA)
| Industry | F500 HQs | Revenue |
|---|---|---|
| Technology | 3 | $17B |
|
||
| Insurance | 2 | $84B |
|
||
| Retail | 2 | $76B |
|
||
| Life Sciences | 1 | $43B |
|
||
| Energy Technology | 1 | $31B |
|
||
| Aerospace / Defense | 1 | $18B |
|
||
Price history
+164.7% since first listed2 events — show timeline
- 2026-06-10 Listed $225,000 MLS PIN
- 1988-12-07 Sold (Public Records) $85,000 Public Records
Property tax history
+2.8%/yrLatest (2023): $2,972 · +11.5% YoY. Source: county tax records.
Cash-flow waterfall
monthlySold comps — $/sqft
last 12 mo · ≤1 miLoading sold comps…